Status, variation, development, and utilization of water resources in China
Abstract
The information about China's water resources yield and its utilization have been publicly released by its annual China Water Resources Bulletin since 1998. This paper introduces the facts of China's water resources and its development and utilization in 2022 and analyzes the variation of water resources, water supply structure, water use volume, and efficiency. In 2022, both precipitation and total volume of water resources in China were less than normal, and were unevenly distributed both temporally and geographically. There has been some decrease in water storage of some large- and medium-sized reservoirs, while the storage of lakes has remained relatively stable. Total water use increased to some extent compared with that in 2021, with further improvements of efficiency and pattern of water uses. There was no significant trend of change on annual precipitation and water resources in China from 1956 to 2022, but the capability of runoff generation in North China showed a decrease. To ensure national water security, China has made great effort to cope with the impacts of climate change and human activities by refined management of surface water resources and groundwater resources, as well as ambitious water-saving goals.
1 INTRODUCTION
China is one of the countries with the richest water resources in the world, and its water utilization quantity is also among the top of the world. China's water resources management system is based on the division of both watersheds and administrative regions. China's territory is divided into 10 Level-1 water resources zones (WRZs) covering 31 provincial-level administrative regions (PARs). Among the 10 Level-1 WRZs are six Level-1 WRZs in North China, namely the Songhua River, Liaohe River, Haihe River, Yellow River, Huaihe River, and northwest rivers, and the four Level-1 WRZs in South China, namely the Yangtze River (including Taihu Lake Basin), southeast rivers, Pearl River, and southwest rivers.
The water resources yield and utilization of the entire country as well as the specific numbers at respective administrative regions and river basins have been officially released by the Ministry of Water Resources of China through the annual publication of China Water Resources Bulletin (Ministry of Water Resources of the People's Republic of China, 2023) since 1998. This Bulletin serves as a timely monitoring and long-term record of the national water resources status and its development and utilization, which could support the decision making of water authorities and provide information for the general public. All the data cited in this paper are taken from this Bulletin which consists of three main parts, namely the quantity of water resources, water storage, and development and utilization of water resources.
To reach a reliable conclusion about the availability and utilization of national water resources, nationwide data that are most available are used, and the technical work have been done strictly following the guide to water resources assessment and the code of practice for water resources bulletin, as well as the relevant rules of water use statistics and survey. It should be noted that the nationwide data presented in China Water Resources Bulletin do not cover Hong Kong and Macao Special Administrative Regions and Taiwan Province due to data accessibility. The hydrological normal mentioned in the paper refers to the mean value over synchronous hydrological data series from 1956 to 2016.
2 QUANTITY OF WATER RESOURCES
2.1 Precipitation
Average annual precipitation in China was analyzed and calculated by integrated application and verification of Thiessen polygon method, isoline method and other methods based on observation data gathered from 18,000 rainfall stations throughout China.
In 2022, average annual precipitation in China was 631.5 mm, 2.0% less than normal, decreasing by 8.7% compared with that in 2021. Figure 1 shows variation of annual precipitation in China from 1956 to 2022.
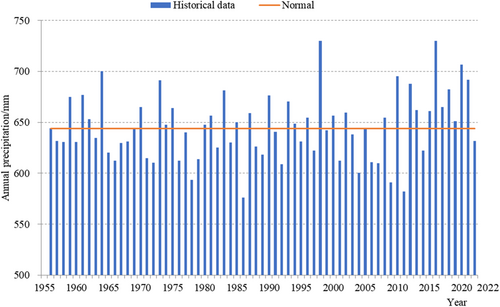
Yangtze River basin experienced a dry year of nearly 95% exceedance probability in 2022 as the precipitation in this year was only higher than that in 1978, 1986, and 2011 since 1956.
2.2 Water resources
Water resources were assessed based on observation data gathered from about 3000 stream-gauging stations and 19,000 groundwater monitoring stations all over China.
In 2022, the total quantity of surface water resources in China was 2598.44 billion m3, equivalent to 274.7 mm in depth, 2.2% less than normal and decreasing by 8.2% compared with that in 2021. Water flowing into seas in 2022 totaled 1579.32 billion m3, 4.8% lower than normal.
In 2022, quantities of groundwater resources (mineralization degree is not higher than 2 g/L) in China totaled 792.44 billion m3, 1.1% lower than normal, decreasing by 3.3% compared with those in 2021, including 177.41 billion m3 in plain areas and 639.61 billion m3 in mountainous/hilly areas, with overlapped quantities of 24.58 billion m3.
In 2022, quantities of water resources in China totaled 2708.81 billion m3, 1.9% lower than normal, down by 8.6% compared with those in 2021. In particular, the quantity of surface water resources and that of groundwater resources are 2598.44 and 792.44 billion m3, respectively (the nonoverlapped quantity between groundwater and surface water was only 110.37 billion m3). The total quantity of water resources made up 45.3% of the precipitation, or water yield of 286,000 m3/km2 per unit area on an average.
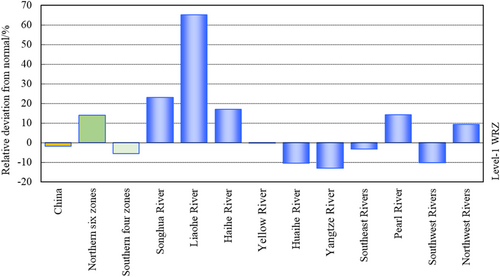
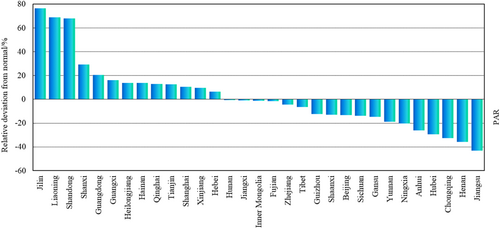
Total quantity of water resources in 2022 by Level-1 WRZ is shown in Table 1, and comparisons of the total quantity of water resources in 2022 with normal by Level-1 WRZ and by PAR are shown in Figures 2 and 3, respectively.
| Level-1 WRZ | Precipitation/mm | Surface water resources/billion m3 | Groundwater resources/billion m3 | Groundwater resources nonoverlapped with surface water resources/billion m3 | Total water resources/billion m3 |
|---|---|---|---|---|---|
| National total | 631.5 | 2598.44 | 792.44 | 110.37 | 2708.81 |
| Northern six zones | 340.6 | 498.83 | 264.74 | 96.72 | 595.55 |
| Southern four zones | 1145.8 | 2099.61 | 527.70 | 13.65 | 2113.26 |
| Songhua River | 560.0 | 156.56 | 55.04 | 24.19 | 180.76 |
| Liaohe River | 688.0 | 69.03 | 24.05 | 10.82 | 79.84 |
| Haihe River | 554.4 | 20.26 | 28.35 | 18.08 | 38.35 |
| Yellow River | 465.8 | 57.76 | 39.13 | 12.31 | 70.07 |
| Huaihe River | 783.1 | 61.46 | 40.04 | 21.72 | 83.18 |
| Yangtze River | 969.6 | 848.56 | 231.02 | 10.50 | 859.05 |
| Taihu Lake Basin | 1098.8 | 14.16 | 4.20 | 1.56 | 15.71 |
| Southeast Rivers | 1649.8 | 194.05 | 46.51 | 1.25 | 195.30 |
| Pearl River | 1729.3 | 540.40 | 124.53 | 1.90 | 542.30 |
| Southwest Rivers | 994.2 | 516.60 | 125.64 | 0.00 | 516.60 |
| Northwest Rivers | 154.5 | 133.76 | 78.13 | 9.60 | 143.36 |
- Note: Taihu Lake Basin (included in the Yangtze River WRZ).
- Abbreviation: WRZ, water resources zones.
3 WATER STORAGE
3.1 Large- and medium-sized reservoirs
Statistics gathered from 753 large-sized reservoirs and 3896 medium-sized reservoirs in 2022 indicate that the total year-end reservoir water storage stood at 418.07 billion m3, down by 40.62 billion m3 compared with the beginning-of-the-year water storage. The large-sized reservoirs held the total end-of-the-year water storage of 370.92 billion m3, decreasing by 36.63 billion m3 compared with beginning-of-the-year data; and the medium-sized reservoirs held the total end-of-the-year water storage of 47.15 billion m3, decreasing by 3.99 billion m3 compared with beginning-of-the-year data. Among the 10 Level-1 WRZs, Yangtze River marked the biggest decrease in reservoir water storage numbering 40.13 billion m3.
3.2 Lakes
Statistics of lake water storage refer to those monitored lakes each with a perennial surface area over 100 km2. Statistics from the monitoring data gathered from 76 lakes in 2022 indicate that the total year-end lake water storage stood at 144.99 billion m3, up by 1.81 billion m3 compared with beginning-of-the-year data. Among the monitored lakes, Qinghai Lake, Chagan Lake, Taihu Lake, and Huayanghe Lakes increased in water storage by 500, 320, 210, and 140 million m3, respectively, while Hongze Lake and Chaohu Lake decreased in water storage by 1200 and 360 million m3, respectively. Water storage of the monitored lakes bigger than 200 km2 in surface area in 2022 are presented in Table 2.
| Lake | PAR | Storage | Increase(+)/decrease(−) in storage | |
|---|---|---|---|---|
| End of year | Beginning of year | |||
| Chagan Lake | Jilin | 1100 | 780 | +320 |
| Taihu Lake | Jiangsu, Zhejiang | 4700 | 4490 | +210 |
| Hongze Lake | Jiangsu | 2450 | 3650 | −1200 |
| Gaoyou Lake | Jiangsu | 930 | 1070 | −140 |
| Luoma Lake | Jiangsu | 710 | 960 | −250 |
| Chaohu Lake | Anhui | 2390 | 2750 | −360 |
| Huayanghe (lakes) | Anhui | 1340 | 1200 | +140 |
| Poyang Lake | Jiangxi | 730 | 840 | −110 |
| Nansi lakes (upper) | Shandong, Jiangsu | 1050 | 1300 | −250 |
| Nansi lakes (lower) | 510 | 810 | −300 | |
| Honghu Lake | Hubei | 500 | 520 | −20 |
| Liangzi Lake | Hubei | 740 | 1040 | −300 |
| Dongting Lake | Hunan | 580 | 650 | −60 |
| Dianchi Lake | Yunnan | 1460 | 1500 | −40 |
| Erhai Lake | Yunnan | 2750 | 2770 | −20 |
| Fuxian Lake | Yunnan | 20,000 | 20,110 | −110 |
| Qinghai Lake (saltwater lake) | Qinghai | 90,420 | 89,920 | +500 |
- Abbreviation: PAR, provincial-level administrative region.
3.3 Groundwater
Groundwater regimes were evaluated based on the monitoring data gathered from the selected 19191 groundwater monitoring stations with monitored areas totaling around 3,500,000 km2 covering main plains, watersheds, and karst regions all over China.
By the end of 2022, groundwater tables showed a slight rise or a rise for 43.9% of shallow groundwater monitoring stations, 57.9% of deep groundwater monitoring stations, 48.7% of fault water monitoring stations, and 42.6% of karst water monitoring stations. Regarding 4 of the 10 Level-1 WRZs, more than 50% of groundwater monitoring stations showed a slight rise or a rise in the groundwater table, the respective data are 72.7% for Southeast Rivers, 60.5% for Pearl River, 59.6% for Haihe River, and 54.7% for Liaohe River; and for the other 6 Level-1 WRZs, more than 50% of groundwater monitoring stations showed a slight fall or a fall in the groundwater table, respectively, 67.0% for Northwest Rivers, 63.2% for Southwest Rivers, 62.1% for Huaihe River, 59.7% for Yangtze River, 58.8% for Songhua River, and 56.7% for Yellow River.
4 DEVELOPMENT AND UTILIZATION OF WATER RESOURCES
Information about China's development and utilization of water resources were obtained based on the data reported by around 182,000 water users of the country (Hao et al., 2022) which account for nearly 60% of the overall water use, including the large- and medium-sized irrigation systems, industrial sectors, service sectors, key public waterworks for municipal water supply and rural residents, and managed ecological/environmental recharge projects, while the rest of water was mainly used by small irrigation systems and nonkey public waterworks.
4.1 Water supply
In 2022, the total water supply in China numbered 599.82 billion m3, accounting for 22.2% of the total volume of water resources of the same year, comprising 499.42 billion m3, or 83.3%, from surface water sources, 82.82 billion m3, or 13.8%, from groundwater sources, and 17.58 billion m3, or 2.9%, from other (nonconventional) sources. Compared with that in 2021, the total water supply increased by 7.80 billion m3, of which surface water supply increased by 6.61 billion m3, groundwater supply decreased by 2.56 billion m3, and water supplies from other (nonconventional) sources increased by 3.75 billion m3.
Of the surface water supply, 32.1% was from storage works, 29.1% from diversion works, 33.8% from water-lifting works, and 5.0% from water transfer between Level-1 WRZs. Water transfers between Level-1 WRZs were mainly from the lower reach of Yellow River leftwards to Haihe River and rightwards to Huaihe River, and from the middle and the lower reaches of Yangtze River to Haihe River, Huaihe River, and Yellow River.
Of the groundwater supply, 97.6% was from shallow groundwater and the remaining 2.4% from deep groundwater.
Of the water supplies from other (nonconventional) sources, 84.9% was from reclaimed water and 6.0% from rainwater harvesting.
4.2 Water use
Total water use in China stood at 599.82 billion m3 in 2022, comprising of 90.57 billion m3 for domestic use, or 15.1% of the total, 96.84 billion m3 for industrial use (including 48.27 billion m3 for cooling of direct current thermal/nuclear power plants), or 16.2% of the total, 378.13 billion m3 for agriculture, or 63.0% of the total, and 34.28 billion m3 for managed ecological/environmental recharge, or 5.7% of the total.
As compared with that in 2021, the total water use in 2022 increased by 7.80 billion m3, of which domestic water use decreased by 0.37 billion m3, water for industrial use decreased by 8.12 billion m3, water for agriculture increased by 13.70 billion m3, and water for managed ecological/environmental recharge increased by 2.59 billion m3.
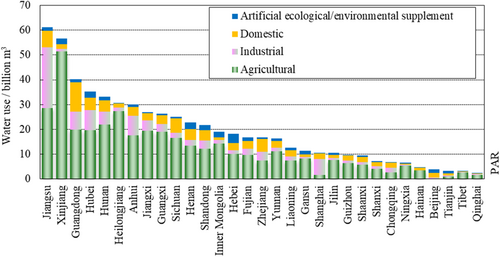
The water supply and water use by Level-1 WRZ in 2022 are shown in Table 3. Composition of water use in 2022 by PAR is presented in Figure 4.
| Level-1 WRZ | Water supply | Water use | ||||||||
|---|---|---|---|---|---|---|---|---|---|---|
| Surface water | Ground water | Other (nonconventional) sources | Total | Domestic | Industrial | Cooling of direct-current thermal/nuclear power plants | Agricultural | Managed ecological/environmental recharge | Total | |
| National total | 499.42 | 82.82 | 17.58 | 599.82 | 90.57 | 96.84 | 48.27 | 378.13 | 34.28 | 599.82 |
| Northern six zones | 180.56 | 76.80 | 11.06 | 268.42 | 30.88 | 20.43 | 1.46 | 195.50 | 21.61 | 268.42 |
| Southern four zones | 318.86 | 6.02 | 6.52 | 331.40 | 59.69 | 76.41 | 46.80 | 182.63 | 12.67 | 331.40 |
| Songhua River | 28.08 | 14.58 | 0.54 | 43.20 | 2.77 | 2.35 | 0.93 | 36.01 | 2.07 | 43.20 |
| Liaohe River | 8.53 | 9.44 | 0.89 | 18.86 | 3.14 | 1.77 | 0.02 | 12.78 | 1.17 | 18.86 |
| Haihe River | 20.44 | 12.80 | 3.83 | 37.07 | 6.99 | 3.89 | 0.03 | 18.69 | 7.50 | 37.07 |
| Yellow River | 26.24 | 10.75 | 2.17 | 39.16 | 5.58 | 4.30 | 0.00 | 25.89 | 3.39 | 39.16 |
| Huaihe River | 48.28 | 12.84 | 2.79 | 63.91 | 10.05 | 6.47 | 0.48 | 43.35 | 4.04 | 63.91 |
| Yangtze River | 206.82 | 3.80 | 3.74 | 214.36 | 34.10 | 59.22 | 40.91 | 112.74 | 8.30 | 214.36 |
| Taihu Lake Basin | 33.74 | 0.00 | 0.87 | 34.61 | 6.06 | 20.70 | 16.93 | 6.86 | 0.99 | 34.61 |
| Southeast Rivers | 27.35 | 0.28 | 0.88 | 28.51 | 6.97 | 5.14 | 1.05 | 14.54 | 1.86 | 28.51 |
| Pearl River | 74.51 | 1.61 | 1.79 | 77.91 | 17.35 | 11.50 | 4.84 | 46.75 | 2.32 | 77.91 |
| Southwest Rivers | 10.18 | 0.32 | 0.11 | 10.62 | 1.27 | 0.55 | 0.00 | 8.60 | 0.19 | 10.62 |
| Northwest Rivers | 49.00 | 16.38 | 0.84 | 66.22 | 2.35 | 1.65 | 0.01 | 58.77 | 3.45 | 66.22 |
- Note: Taihu Lake Basin (included in the Yangtze River WRZ).
- Abbreviation: WRZ, water resources zones.
4.3 Consumptive water use
Total consumptive water use in China in 2022 marked 331.02 billion m3, with a consumption rate of 55.2%, including 251.68 billion m3 by the agricultural sector, which represents 76.0% of the total and a consumption rate of 66.6%; 21.50 billion m3 by the industrial sector, which represents 6.5% of the total and a consumption rate of 22.2%; 35.84 billion m3 for domestic use, which represents 10.8% of the total a consumption rate of 39.6%; and 22.00 billion m3 for managed ecological/environmental recharge, which represents 6.7% of the total, and a consumption rate of 64.2%.
4.4 Water use indices
In 2022, the general per capita water use of China registered 425 m3, and water use per 10,000 yuan of gross domestic product (GDP) (at current price) was 49.6 m3. Irrigation water use per mu (1/15 ha) of irrigated farmland was 364 m3, with an overall irrigation efficiency of 0.572. Water use per 10,000 yuan of industrial added value (at current price) was 24.1 m3, 415 yuan/m3 in water productivity. Per capita domestic water use was 176 L/day, and per capita household water use in both urban and rural areas was 125 L/day.
5 VARIATION OF WATER RESOURCES AND ITS DEVELOPMENT AND UTILIZATION
5.1 Water resources evolution
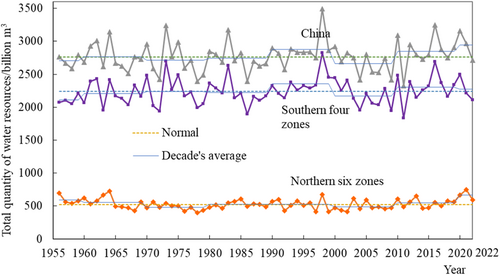
Figure 5 shows variations in the total quantity of water resources in China from 1956 to 2022, including four Level-1 WRZs in South China and six Level-1 WRZs in North China. As compared with normal, no significant variation was observed regarding the decade's average of China's total quantity of water resources, only 4.2% higher than normal during the 1990s, 3.6% lower than normal during the 2000s, and 3.1% higher than normal during the 2010s, and 6.6% higher than normal during the last 3 years of 2020, 2021, and 2022. The decade's average of the total quantity of water resources in four Level-1 WRZs in South China was 5.1% higher than normal during the 1990s, 3.0% lower than normal during the 2000s, and 2.7% higher than normal during the 2010s, respectively, and, 1.6% higher than normal during the last 3 years of 2020, 2021, and 2022; and regarding the six Level-1 WRZs in North China, it was basically normal during the 1990s, 6.3% lower than normal during the 2000s, and 4.5% higher than normal during the 2010s, and 28.1% higher than normal during the last 3 years of 2020, 2021, and 2022.
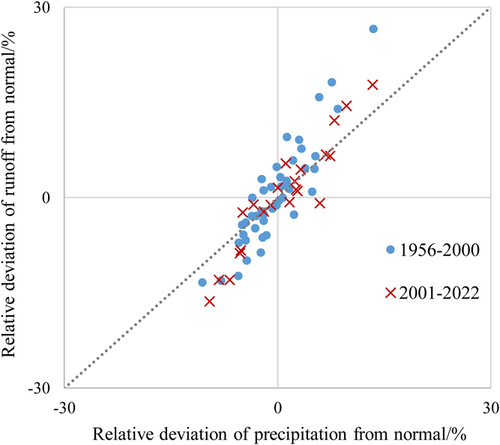
According to the long series of water resource assessment data, the average annual precipitation from 2001 to 2022 in China was 0.9% higher than that from 1956 to 2000, and the quantity of surface water resources was 0.3% higher. There were significant differences among the 10 Level-1 WRZs. The average surface water resources in Haihe River and Liaohe River from 2001 to 2022 were 20.8% and 12.7%, lower than that from 1956 to 2000, while the corresponding average annual precipitation was only 1.5% and 4.7% lower, so the proportion of precipitation converted into runoff decreased. Relative studies have shown that the runoff coefficient in these areas has decreased due to the significant impact of human activities on regional water cycle. The average annual precipitation in the Northwest Rivers from 2001 to 2022 was 9.6% higher than that from 1956 to 2000, and the quantity of surface water resources was 12.6% higher.
According to the national data, when the annual precipitation is higher than normal, the quantity of surface water resources in most years from 2001 to 2022 was relatively lower than that in 1956 to 2000. From 1956 to 2000, the average precipitation in wet years was 3.6% higher than normal, with the surface water resources 6.4% higher than normal. While for the wet years from 2001 to 2022, the average precipitation was 4.6% higher than normal, but the quantity of surface water resources was only 3.3% higher, indicating a decrease in runoff production capacity. It has been evidenced that the evolution of water resources is significantly influenced by the variation of spatial and temporal distribution of precipitation (Du et al., 2023; Padrón et al., 2020), land use and land cover change (Feng et al., 2016; Tan et al., 2020; Zhou et al., 2015), global warming (Konecky et al., 2023), and so forth. Comparison of relative deviation of precision and runoff from normal from 1956 to 2000 and, respectively, in 2001 and 2022 is shown in Figure 6.
5.2 Variation of water supply and water use
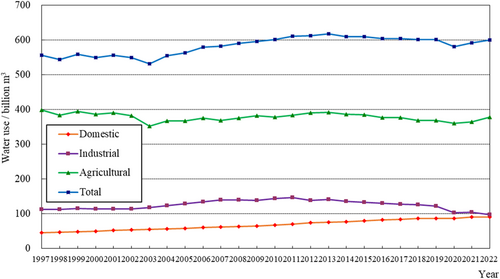
In general, total water supply and water use in China had increased slowly since the year 1997, and remained basically stable since the year 2013.
Within the total water supply, surface water supply and water supplies from other (nonconventional) sources had increased steadily, while groundwater supply presented a steady downward trend for recent years after a period of slowly rising. Regarding the surface water supply, water transfer between Level-1 WRZs had increased steadily; while for groundwater, deep groundwater supply had decreased steadily. Both percentages of the supplies from surface water and nonconventional sources in the total water supply had kept a momentum of gradual increase, while percentage of groundwater supply in the total had been declining accordingly.
Within the total water use, domestic water use had increased steadily. Industrial water use had gradually become stabilized after an overall increase and even slightly decreased for recent years, while the agricultural water use had fluctuated due to the variation of annual precipitation and the area of irrigation. The share of domestic water use in total water use had gradually increased, while that of both agricultural and industrial water use had declined accordingly. See Figure 7 for variation in water use in China from 1997 to 2022.
5.3 Improvement of water use efficiency
Data in all the previous publications of China Water Resources Bulletin indicate a significant improvement in China's water use efficiency since 1997 as both water use per 10,000 yuan of GDP and water use per 10,000 yuan of industrial added value remarkably decreased. In other words, water productivity has been significantly improved since 1997. Irrigation water use per unit area of irrigated farmland slowly decreased. Per capita aggregate water use remained basically stable at around 400–450 m3. Comparing the year 1997 and 2022, irrigation water use per mu of irrigated farmland had decreased from 492 to 364 m3, and water use per 10,000 yuan of GDP and that per 10,000 yuan of industrial added value decreased by 85.5% and 89.4% (calculated at comparable prices), respectively, during the period of 25 years. Compared with the year 2021, water use per 10,000 yuan of GDP and per 10,000 yuan of industrial added value decreased by 1.6% and 10.8% (calculated at comparable prices), respectively, in 2022.
Changes in water use indexes in China from 1997 to 2022 are presented in Figure 8.

6 CONCLUSIONS
Water security is regarded as one of the most important parts of national security of China. China attaches great importance to water resource protection and sustainable utilization, and has introduced a series of innovative measures for refined management of surface water resources and groundwater resources. Since 2011, the strictest water resource management system has been implemented, and a so called three-red-line targets for water use control have been defined (namely to control the total water use quantity, water use efficiency, and pollution discharge in water function zones). Since 2016, the River Chief (or Lake Chief) system was adopted which clarifies the main responsibility of local governments for river and lake management and conservation. In 2019, water use limit respectively for urban development, land use, population, and economic development was defined. In 2020, National Water-Saving Campaign and the Most Stringent Water Resources Management System were put forward. All those measures have been well implemented with satisfactory results so far.
According to the statistics in China Water Resources Bulletin, the red-line limit for both national and regional water use, as well as the target for water use efficiency including water use per 10,000 yuan of GDP, water use per 10,000 yuan of industrial added value and overall irrigation efficiency, have all been well achieved. Total water supply and water use throughout China remained basically stable with improvements in water use efficiency and pattern. Irrigation water use per mu of irrigated farmland decreased from 492 to 364 m3, while water use per 10,000 yuan of GDP and that per 10,000 yuan of industrial added value, respectively, decreased by 85.5% and 89.4% (calculated at comparable prices) during the past 25 years.
Although no significant changes were observed for the overall state of water resources in China, some areas in northern China, especially in Haihe River and Liaohe River, are faced with more serious water shortage risk due to the decrease of local water resources. Meanwhile, the intra-annual distribution of water resources in most parts of China have more or less changed with increasingly frequent extreme weather events. Besides the administrative management and market-oriented policies, abundant engineering measures have been carried out throughout China to ensure national water security, including the recent planning and implementation of National Water Grid. Hence, further research on the impacts of climate change and human activities on water cycle and available water resources and corresponding counter-measures (Song et al., 2013; Wang et al., 2010) are needed to support decision-making for water resources management.
ACKNOWLEDGMENTS
The study is financially supported by the National Natural Science Foundation of China (No. 52009140) and the National Key R&D Program of China (No. 2021YFC3201105).
ETHICS STATEMENT
None declared.
Open Research
DATA AVAILABILITY STATEMENT
China Water Resources Bulletin.


