Urban inundation forecasting based on hydraulic models coupling MIKE Flood and MIKE Urban: A case study of Tam Ky City, Vietnam
Abstract
Urban inundation has become a growing concern for many coastal cities around the world. Tam Ky City, located downstream of Ban Thach and Tam Ky rivers in central Vietnam, is no exception. According to annual statistics, the city frequently experiences heavy rainfall from tropical storms and monsoons, making inundation a recurring issue. In response to this challenge, this study developed a flood forecasting model specifically tailored for Tam Ky City, based on forecast rainfall and tidal levels. A key strength of the flood forecasting model lies in its integration of rainfall-runoff processes, effectively connecting the river basin and the city. To ensure the model's accuracy and reliability, the parameters of the flood forecasting model were meticulously calibrated and verified for floods occurred on rivers as well as in urban areas. An experimental flood forecast was performed during Typhoon Nuru on September 28, 2022, and the forecast results of inundation locations and depths in the city well reflected the actual observations.
1 INTRODUCTION
Urban inundation is a critical issue with significant adverse impacts on both the economy and the environment, as highlighted in several prior studies (Chen et al., 2022; Eldho et al., 2018; Luo et al., 2018). This phenonmenon poses a major challenge for many cities in central Vietnam. These cities are highly vulnerable to inundation due to exposure from 5 to 10 typhoons annually, resulting in intense rainfall ranging 50–100 mm/h. This vulnerability is exacerbated by the fact that most cities in the region are located in lowland areas, with urban drainage systems designed to discharge directly into nearby rivers. Therefore, during heavy rain events, urban drainage systems not only struggle to handle flow generated from inner city catchments but also face additional challenge posed by fluvial inundation from rivers.
Hydrological and hydraulic models are widely employed to investigate urban inundation. These models simulate inundation events using either one-dimension (1D) or two-dimension (2D) hydrodynamical models. The 1D model typically focuses on describing urban pipe drainage in a single direction, while the 2D model considers more complex surface water dynamics in two directions. Martins et al. identified the storm water management model (SWMM) as a typical 1D urban flood model to simulate rainfall-runoff and pipe drainage processes. Meanwhile, Bisht et al. (2016), Cloke and Pappenberger (2008) highlighted the coupling of MIKE Flood and MIKE Urban models as an approach to simulate hydraulic interactions between rivers and urban areas, with the integration of a high-resolution digital elevation model (DEM). The coupling of these two models (MIKE Flood and MIKE Urban) offers many advantages in simulating urban inundation, especially in situations where urban drainage systems are affected by river floods.
Tam Ky City has become one of the most exposed cities to urban inundation. With an average elevation ranging from +2.0 to +4.0 m, the city is located in close proximity to both the Tam Ky and Ban Thach rivers. Additionally, the city's drainage system directly discharges into the Ban Thach River through five outlets, making it highly susceptible to fluvial floods originating from the Tam Ky—Ban Thach River system, as well as to tidal impacts. To address this pressing issue, we proposed to develop an integrated urban inundation model incorporating both river basin and urban hydrological processes.
The aim of this study is to propose an urban inundation prediction model for Tam Ky City by coupling the river-urban inundation modeling with data forecasting of rainfall and tidal levels. The proposed model serves as an effective tool to predict urban inundation, particularly relating to the recent rainfall associated with Typhoon Nuru on October 10, 2022. The study will provide valuable insights for preparing for upcoming storms.
The paper is mainly organized in four sections. Section 2 describes the case study and hydraulic model used in the study, followed by a presentation of a data set of the model in Section 3. Section 4 provides the results obtained from the inundation prediction model and initiates a comprehensive discussion of the findings. Finally, the conclusions will be given in Section 5.
2 CASE STUDY AND HYDRAULIC MODEL
2.1 Case study
Tam Ky City, one of two cities situated in Quang Nam Province, serves as the administrative-economic center, with a total urban area of about 11 km2 (depicted by the black line in Figure 1). The drainage system of the city comprises an extensive pipeline network of 57 km, with more than 530 manholes connected to 7-km canals and 7 detention ponds. The drainage system discharges directly into the Tam Ky River and Ban Thach River through six outlets (as shown in Figure 1). A key limitation of the city's drainage system is that the bottom elevation of its six outlets ranges from −1.32 m to −0.28 m, while the flood water level in the Ban Thach River can reach from +1.7 m to +2.7 m, corresponding to Alarm Level I and III respectively.
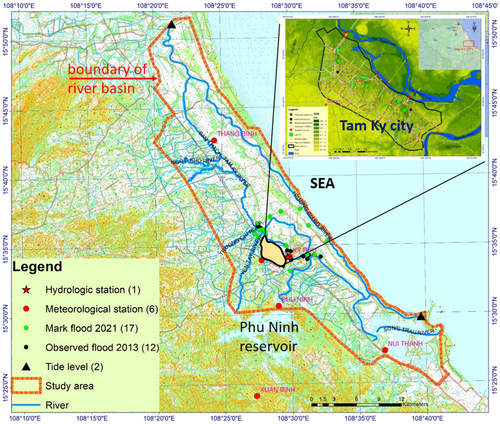
In Tam Ky City, inundation is a recurring issue that can be attributed to several factors. The primary reason behind is the concentration of flow from catchments of the Ban Thach and Tam Ky river basins due to heavy rain in these areas. Subsequently, the concentrated flow interacts with the discharge from the spillway operation from Phu Ninh reservoir and high tidal levels at Hoi An and Cua Lo. To effectively represent flow progress in the river basin, a hydraulic model was developed with its boundary extending to the North of the study area, as shown in Figure 1, covering a catchment area of more than 1000 km2 (the red line). Figure 1 also displays the location of meteo-hydrological stations, including six meteorological stations (Thang Binh, Tam Ky, Ky Phu, Phu Ninh, Xuan Binh, and Nui Thanh), a hydrologic station (Ky Phu), a tidal water level station (Hoi An), observed discharge at Phu Ninh reservoir and flood marks obtained from two flood events (2013 and 2021).
According to data from the Vietnam General Department of Meteorology and Hydrology, the central region is highly susceptible to typhoons and tropical typhoons, accounting for nearly 70% of all typhoons affecting Vietnam. These weather events, along with tropical depressions and cold air, often result in heavy rain, leading to severe inundation in the region. The average annual rainfall of the entire basin ranges from 3000 to 4000 mm. Rainfall distribution varies across seasons, with 65%–75% of the annual rainfall concentrated in the season from September to December. Observations from meteo-hydrological stations in Tam Ky City (the red circle in Figure 1) recorded a total rainfall of 531.4 mm over a 3-day period from 22 to 24 October 2021. During this period, the highest total rainfall in 24 h was 503.2 mm, and the heaviest rainfall in 1 h and 15 min was 61 and 23.4 mm, respectively. Figure 2 presents recent urban inundation events occurred in Tam Ky City.

2.2 Hydraulic model
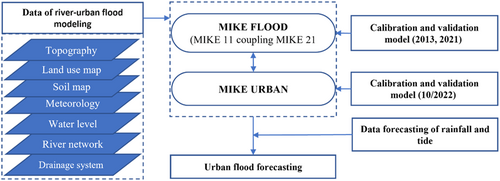
Forecasting urban inundation has emerged as a significant trend in recent times (Chen et al., 2022; Eldho et al., 2018). However, this task is complex as it is affected not only by such triggers as urban rainfall or river flood water levels (Bisht et al., 2016; Chen et al., 2022), but also by the characteristics of the drainage system and urban topography (Eldho et al., 2018). In this study, a hydraulic model was developed by integrating water body and urban data, effectively connecting the river basin and urban hydrological systems. This coupling was achieved by combining 1D processes, which encompass river channels and pipe systems, with 2D processes which involve overflow from rivers, urban manholes, and other components (DHI, 2014a, 2014b). The MIKE Flood model provided river channel water level, which served as tidal conditions for the MIKE Urban model representing the urban drainage system, while the MIKE-Urban model calculated the inundation volume for all manholes and outlets within the city (DHI, 2014c, 2014d). During normal conditions, all urban runoff is discharged to the river through the pipe system and outlets when the river water level is lower than the outlet elevation. However, when the river water level rises above the outlet elevation, interactions occur between urban runoff and river water, potentially resulting in blockages of the stormwater conveying system and manholes. As a consequence, urban inundation occurs. This hydraulic model was carefully calibrated and validated using actual inundation events. Subsequently, it can be employed to predict urban inundation through data forecasting of rainfall and tide. The general flowchart diagram of this study is illustrated in Figure 3.
3 DATA SET
3.1 Data for hydraulic model setup
The data used to set up the hydraulic model was collected from various reliable and available data sources, as described in Table 1 and Figure 4. In particular, the water level observation in the drainage system was measured directly by water level sensors located at Tran Quy Cap and Ton Duc Thang roads (indicated by two blue points in Figure 1b) on 7 and 8 October, 2022.
| Data | Description | Year | Data sources |
|---|---|---|---|
| Topography | Terrain elevation, raster, 30 × 30 m | 2014 | LUCCi, DONRE, Quang Nam Province People's Committee |
| Land use map | Land use classification, raster, 30 × 30 m | 2014 | LUCCi, DONRE |
| Soil map | Soil type classification, raster, 30 × 30 m | 2014 | LUCCi |
| Meteorological data |
|
2013, 2021, 2022 | Meteo-hydrological stations of Quang Nam Province, Vietnam |
| Water level |
|
2013, 2021, 2022 |
|
| River network | Cross-section, structures, bridges, weirs, culverts, dikes, and so on. | 2022 | Quang Nam Province People's Committee, Vietnam |
| Drainage system | Pipes, canals, manholes, outlets, basins, lakes. | 2022 | Tam Ky City People's Committee, Vietnam |

3.2 Boundary conditions
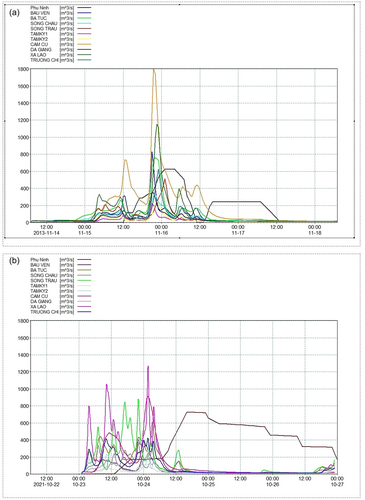
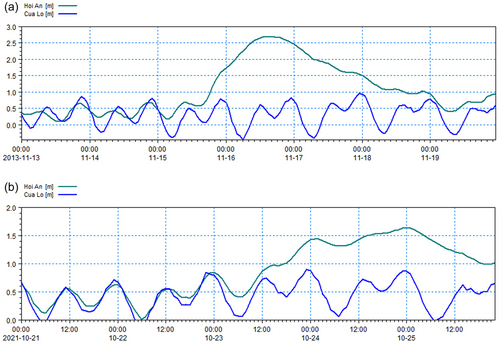
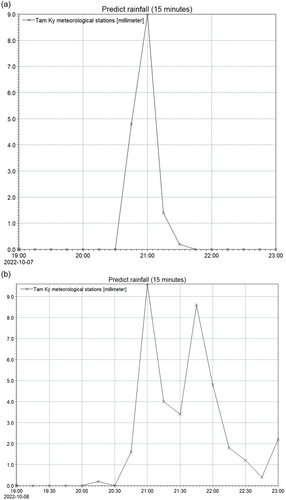
The 11 discharge boundaries and three water level boundaries of the MIKE Flood model are presented in Figures 5 and 6. The data includes the observed water level at Hoi An station, tidal levels at Cua Lo and Ky Ha extracted from the East Sea model, and discharge boundaries obtained from a hydrological model (MIKE NAM model). These data are crucial for calibrating and validating corresponding inundation events occurred in October 2021 and November 2013. In addition, Figure 7 shows two independent rainfall events in October 2022, providing data for calibrating and validating the MIKE Urban model.
3.3 Data for model calibration and validation
To calibrate and validate the models in this study, the Nash-Sutcliffe coefficient was employed, as proposed by critical findings of Moriasi et al. (2007). First of all, the MIKE Flood model was calibrated for the inundation event in October 2021 by iteratively modifying bed friction resistance in both the river and floodplain until the simulated water surface elevation matched the observed water level and flood extent. After that, this model was validated using data from the inundation event in November 2013. In this way, the observed level on the river at Ky Phu hydrological station (see the red star symbol in Figure 1) was used to evaluate the simulation performance. Finally, the MIKE Urban model was calibrated and validated based on comparison of observed and simulated water levels at two manholes corresponding to two independent rainfall events occurred in September 2022 (see Figure 7a,b).
3.4 Data input for flood forecasting
The data used for urban inundation forecasting includes rainfall in the river-urban basin and tidal levels. In this study, we utilized rainfall predictions obtained from the Windy website (https://www.windy.com/) and the tidal level predictions from the East Sea model. These data were extracted 48 h before the expected landfall of Typhoon Nuru in Tam Ky City (from 25 to 26 September 2022). These data were analyzed to provide inputs for the hydraulic model.
The Windy website provides four rainfall prediction models, namely GFS 22 km, ECMWF 9 km, ICON 13 km, and METEOBLUE (see Figure 8a). After careful evaluation using rain gauges, it was determined that the GFS 22 km model demonstrated better correlation in terms of intensity, accumulation, and duration. Therefore, we decided to use the rainfall data from the GFS 22 km model for inundation forecasting (Figure 8a).
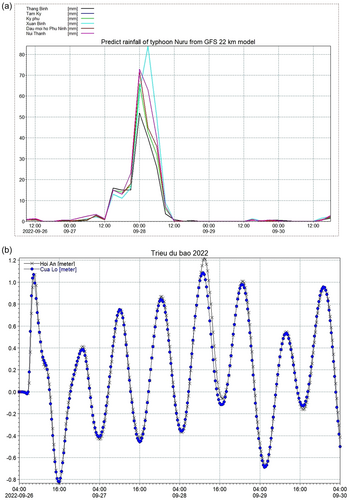
The prediction of tidal levels relies on the simulation results obtained from the MIKE 21/3 model (see Figure 8b) from the East Sea model. This model enables the simulation of tidal processes and wave propagation from offshore to the coastal area. The open boundaries of this model encompassed significant areas, including Taiwan, Luzon, Mindoro, Babalac, and Malacca straits.
4 RESULTS AND DISCUSSIONS
4.1 Calibration and validation of the hydraulic model for river basin
The simulated and observed river water levels obtained at Ky Phu (Tam Ky) hydrological station for calibration and validation are presented in Figure 9a,b. The evaluation of model quality, as indicated by efficiency criteria, demonstrated a high level of agreement with the observed data. The Nash coefficients in the calibration and validation periods were 0.96 and 0.73, respectively.
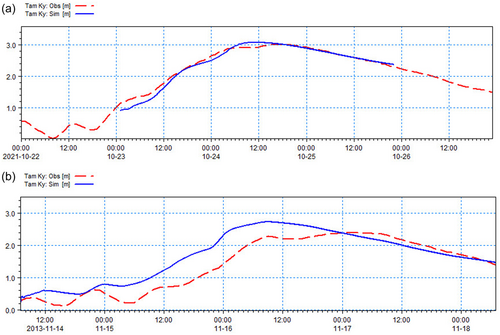
In addition, the hydraulic simulation results in floodplains demonstrated a high level of accuracy. The error of the flood elevation at 16 flood marks on October 2021 and the water depth at seven observation marks on November 2013 between the simulation and field survey was quite small (see Appendices 1 and 2). It indicates that the MIKE Flood model of the river basin is stable and reliable for urban inundation forecasting.
4.2 Calibration and validation of the hydraulic model for urban area
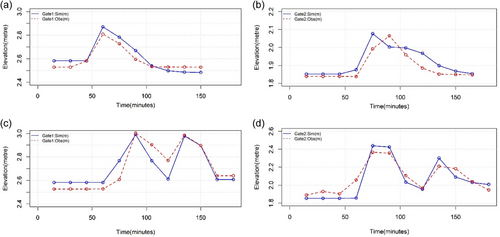
Calibration and validation results for urban areas from MIKE Urban model also showed good results. The Nash indicators at gate 1 and gate 2 (two black circles in Figure 1b) were 0.74, 0.61, 0.78, and 0.72, respectively (Figure 10a–d). Overall, the results indicate that the hydraulic model is reliable for urban inundation forecasting.
4.3 Urban inundation forecasting
Figure 11b presents the urban inundation forecasting map generated 48 h before Typhoon Nuru landed in Tam Ky City on September 26, 2022. The map is the result of the coupled river-urban inundation modeling, combined with data forecasts of rainfall (Figure 8a) and tidal levels (Figure 8b). The map shows that seven major roads are inundated, with water depths ranging from 0.1 to 0.4 m, including Hung Vuong (0.4 m), Phan Chau Trinh (0.4 m), Nguyen Duc (0.3 m), Dien Bien Phu (0.3 m), Ly Thuong Kiet (0.15 m), Tra Thu Do (0.15 m), and Nguyen Thi Dinh (0.15 m). Figure 12 presents photos taken after the landfall of Typhoon Nuru in Tam Ky City. These photos serve as visual evidence, demonstrating that the predicted water depths at the inundation points, as noted in Figure 11b (corresponding to note 1, note 2, and note 3), align well with the actual conditions observed in reality.


5 DISCUSSIONS
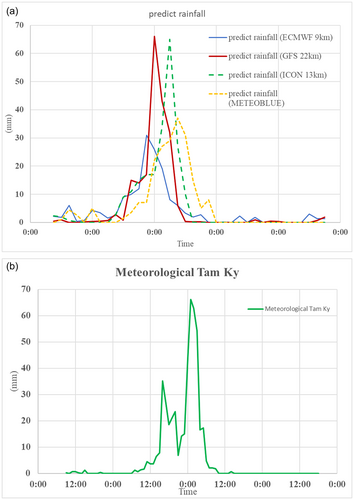
The forecast rainfall data plays a crucial role in urban inundation forecasting. Figure 13a represents the predicted rainfall of Typhoon Nuru in Tam Ky City from four models (GFS 22 km, ECMWF 9 km, ICON 13 km, and METEOBLUE). Among these models, two showed that forecasts aligned well with the actual rainfall (Figure 13b). Specifically, the GFS 22 km model outperformed the ICON 13 km model, while the rest two models exhibited less accurate results. The reliability of rain forecast depends not only on the model type but also on the timing of extracting the forecast rainfall data. In the near future, if rainfall data from radar become more reliable and available for Tam Ky City, inundation forecasting for Tam Ky City will have higher certainty.
6 CONCLUSIONS
This study proposed an innovative approach to predict urban inundation in Tam Ky City, Quang Nam. By leveraging freely available weather forecasting data and employing hydrology and hydraulic modeling technique for catchments, this study successfully generated a highly accurate inundation map for the area. The findings of study underscore the critical importance of coupling river basin and urban drainage processes to effectively address the challenges posed by interacting urban inundation and fluvial inundation. To achieve these results, a novel MIKE Flood model was proposed, which utilized river channel water level as the tidal condition for the urban drainage system in the MIKE Urban model, while the MIKE Urban model calculated the inundation volume for all manholes and outlets. The prediction of urban inundation in Tam Ky City was tested during the heavy rainfall event caused by Typhoon Nuru in September 2022. The study successfully forecasted the urban inundation before the typhoon landfall and the onset of severe weather, thereby providing stakeholders with crucial and timely information to proactively mitigate the inundation risks.
ACKNOWLEDGMENTS
We gratefully acknowledge the generous support and funding provided by the Science and Technology Fund of Quang Nam Province, under the project No. 32/HD-SKHCN, entitled “Assessment of flooding and proposed solutions to Tam Ky City in the context of urbanization and climate change”.
ETHICS STATEMENT
None declared.
APPENDIX 1
Calibration of the model by comparison between simulated and flood mark (FM) elevations during the extreme rainfall event from 22 to 26 October 2021 (see the blue points in Figure 1).
| Name | Simulated flood elevation (m) | Observed flood elevation (m) | Comparison |
|---|---|---|---|
| FM2 | 3.11 | 3.53 | −0.42 |
| FM3 | 3.03 | 3.70 | −0.67 |
| FM4 | 2.95 | 3.60 | −0.65 |
| FM5 | 3.11 | 3.50 | −0.39 |
| FM6 | 3.16 | 3.45 | −0.29 |
| FM7 | 2.90 | 3.82 | −0.92 |
| FM8 | 2.90 | 3.77 | −0.87 |
| FM9 | 1.58 | 1.21 | 0.37 |
| FM10 | 1.58 | 1.83 | −0.25 |
| FM11 | 1.57 | 1.65 | −0.08 |
| FM12 | 2.53 | 2.28 | 0.25 |
| FM13 | 2.33 | 2.07 | 0.26 |
| FM14 | 2.81 | 2.75 | 0.06 |
| FM15 | 2.68 | 2.65 | 0.03 |
| FM16 | 2.64 | 2.45 | 0.19 |
| MF17 | 2.73 | 2.70 | 0.03 |
APPENDIX 2
Validation of the model by comparison between simulated and observed flood (OF) elevations during the extreme rainfall event from 15 to 18 November 2013 (see the black points in Figure 1).
| Name | Simulated flood elevation (m) | Observed flood elevation (m) | Comparison |
|---|---|---|---|
| OF1 | 0.95 | 0.85 | 0.10 |
| OF2 | 0.84 | 0.40 | 0.44 |
| OF3 | 1.03 | 0.49 | 0.54 |
| OF4 | 0.85 | 1.04 | −0.19 |
| OF5 | 0.78 | 1.29 | −0.51 |
| OF6 | 1.14 | 1.03 | 0.11 |
| OF7 | 0.89 | 0.88 | 0.01 |
Open Research
DATA AVAILABILITY STATEMENT
The data that support the findings of this study are available from the corresponding author upon reasonable request.


