Application of NEXRAD precipitation data for assessing the implications of low development practices in an ungauged basin
Abstract
Hydrologic analysis in watersheds lacking rain gauge stations has been a challenge and even those with stations that do not contain the required amount of data create problems in model verification. So, the study integrates the Next Generation Weather RadarIII precipitation data and the Personal Computer Storm Water Management Model (PCSWMM) for evaluating the model's effectiveness. The study further integrates 100-year return period precipitation intensity and PCSWMM to generate a one-dimensional flood risk zone map, which shows the major sub-catchments under risk zones. Based on the identification of risk zones from PCSWMM, three different low-impact developments (LIDs), street plants, infiltration trenches, and green roofs are applied independently and uniformly to compare the decrease in flow. Thereafter, the prioritized list of critical sub-catchments from hydraulic modeling is compared with the compromise programming method, an approach for studying the decrement in flow by increasing LID application (infiltration trench) in the first five critical sub-catchments, suggesting planners and researchers identify the most critical sub-catchments and develop future potential strategies.
1 INTRODUCTION
The environment, human health, and well-being are all significantly impacted by two main global phenomena: urbanization and climate change. Both processes entail intricate interplays between ecological and social systems, and their effects frequently connect and overlap (Garschagen & Romero-Lankao, 2015). Day-to-day temperature study over North America show that climate change can potentially increase urbanization's adverse effects, such as heat island effects and the escalation of extreme weather (Tam et al., 2015). Urbanization can also change local and regional climate patterns by altering land use and land cover, such as the conversion of natural land cover to urban development (Metzger et al., 2006). A study in the southern United States infers urbanization can impact the hydrological cycle (O'Driscoll et al., 2010) and increase water demand, influencing the sustainability of urban water systems (Varis & Somlyódy, 1997). Climate change can also affect the availability and distribution of water resources, which may result in water stress in some areas (Hejazi et al., 2015). The intensification of heat waves and other extreme weather events brought on by climate change can exacerbate flooding and drought (Shrestha et al., 2020), which is also accelerated by urbanization. From 1940 to 2017, flood was the main reason for casualties in the United States and caused financial damage of approximately US$8 billion (National Weather Service, 2018). In the coastal regions of the United States, sea levels decreased when data from several rain gauge stations were automatically corrected (Gregory et al., 1992; Joshi et al., 2021). The capacity of watercourses to carry and discharge stormwater may be impacted by increase in impervious surface, raising the danger of floods. The management of infiltration volume is very important for the significant decrease in runoff (Shahzad et al., 2022).
For the application of any flood mitigation strategies, that is, study of decreases in runoff, it is important to demonstrate the flooding scenario. The creeks that were considered non-vulnerable are getting vulnerable and causing floods mostly in urban areas. The catchment of such creeks mostly lacks detailed historical and present precipitation and streamflow data. Such catchments are the ungauged catchments. The lack of rainfall data and streamflow creates a significant challenge in hydrologic and hydraulic modeling, as the model's output accuracy is highly dependent on the quality and quantity of data. Previous studies validated the model considering the gauged watershed of similar geographical features and then used it for the targeted watershed (Kastridis & Stathis, 2020). Also, researchers have been considering satellite and radar-based precipitation data to compare the model's effectiveness (Aryal et al., 2023; Bhusal, Ghimire, et al., 2023; Bhusal, Kalra, et al., 2023). Previous studies also show that the uncalibrated multi-satellite retrieved rainfall data does not predict the peak discharge with much accuracy as the data from direct rain gauge stations only if the rain gauge station is in appropriate location inside the watershed (Sapountzis et al., 2021). However, there is still significant uncertainty associated with the streamflow estimates of ungauged catchments and the accuracy of hydrological models in such areas still remains a challenge. Previous studies considered the use of distributed hydrologic modeling and threshold frequency for characterizing the flood risk areas (Reed et al., 2007). This study considers the use of the Gravois Creek catchment, where the streamflow is known in one station and the precipitation data is not available in the catchment.
The effects of flooding on a specific area, including the amount of flooding, the depth of water, and flow velocity, are frequently predicted using two-dimensional (1D)-flood models (Simões et al., 2011). In most cases, 1D-flood models are used in conjunction with two-dimensional (2D)-flood models, which offer more precise and thorough predictions of flood behavior (Kalra, Joshi, Baral, et al., 2021; Kalra, Joshi, Pokhrel, et al., 2021; Morales-Hernández et al., 2016). While 2D models are better suited for more complicated and variable systems, 1D-flood models are best used in relatively simple and uniform river systems (Dimitriadis et al., 2016). Compared to the 2D models, 1D-flood models are more straightforward and computationally efficient, making them simpler and faster to execute. Since the creek under consideration in this study is similarly a straightforward, uniform river system, 1D-flood modeling is considered. There are several software, such as Civil Geo-HECRAS (Kalra, Joshi, Baral, et al., 2021; Kalra, Joshi, Pokhrel, et al., 2021), Environmental Protection Agency's Storm Water Management Model (EPA-SWMM5; Jiang et al., 2015), MIKE URBAN (Hossain Anni et al., 2020), and PCSWMM for inundation analysis and generating flood risk maps. This study uses the PCSWMM for generating floodplain areas and developing risk areas. 100-year return period precipitation data from the National Oceanic and Atmospheric Administration (NOAA) is considered later for generating flood plains which is an estimate of the rainfall amount that has a 1% chance of occurring in any given year. According to NOAA, this is the data derived from historical extreme flood events. However, 100-year return period data is just an estimation from statistical approach and may not accurately reflect the actual rainfall events, but still it provides the worst-case scenario through the flood plain generated. There are other approaches like Log-Pearson and Gumbel distribution, but they require a very large range of datasets to process, so direct data from NOAA is considered.
Several low-impact developments (LIDs) are considered to study the decrease in urban flooding. A decentralized detention basin system is also applicable in decreasing runoff in urban watersheds (Bhusal, Ghimire, et al., 2023; Bhusal, Kalra, et al., 2023). Permeable pavements, green roofs, rain gardens, and other forms of green infrastructure are all used in LID approaches to collect, filter, and store stormwater runoff. These methods lessen the quantity of stormwater runoff that enters streams and streets, which can assist in lessening floods and erosion and enhance the water quality (Ahiablame & Shakya, 2016). Also, the flood project considering the North American Regional Climate Change Assessment Program decreased by considering LID (permeable pavement, bioretention cells, and green roofs; Ghimire et al., 2023). Traditional gray infrastructures, which are expensive to build and maintain and include stormwater retention basins and underground pipes, are less necessary due to LID procedures (Y. Sun et al., 2020). LIDs focus on sustainable practices like preserving or increasing greenery and porous surfaces to reduce runoff, which reduces the cost of timely maintenance and helps improve the groundwater level; unlike traditional methods, the infrastructures need timely maintenance. Increasing the percentage of greenery can also reduce the impact of climate change to some extent. In addition, using LID procedures can increase property prices, improve air quality, and improve wildlife habitat, among other advantages. In terms of managing flood risk and enhancing water quality in urban and suburban regions, LID approaches are helpful (Liu et al., 2021). The LID options available in PCSWMM are bio-retention cell, infiltration trench, permeable pavement, rain barrel, vegetative swale, rain garden, green roof, and rooftop disconnection.
The primary task to start the application of LID and flood management involves the simulation of rainfall-runoff model. This study considers the Personal Computer Storm Water Management Model (PCSWMM) for the rainfall-runoff model. For ungauged watersheds, satellite-based and radar-based data are helpful (Ashouri et al., 2015). Satellite-based precipitation data is gathered using satellite sensors, which gauge precipitation intensity from orbit (Knebl et al., 2005). Radar systems can offer real-time information about storms but have trouble identifying light precipitation and snow. Satellite sensors can provide global coverage, but they have lesser spatial resolution than radar data, which may make them less reliable in some circumstances. So, Next Generation Weather Radar (NEXRAD) data is typically considered. First, NEXRAD radar systems can offer more precise and thorough information regarding the location and intensity of precipitation because they have a better spatial resolution than satellite sensors (Liang et al., 2004). Second, NEXRAD data is more current and up-to-date than satellite-based data, which might delay several hours or more because it is gathered in real-time (Adams, III & Dymond, 2019). Third, NEXRAD data can be gathered despite cloud cover, but satellite-based data might need to be more precise in areas with much cloud cover (Zeng et al., 2020). The other alternative can be the use of ocean-atmospheric-oscillations and support vector machine (SVM) for predicting the precipitation for about a month, but predicting for a year, these two models show the variability which are unexplained (Kalra & Ahmad, 2012). Many recent studies involve comparing the results of hydrologic-hydraulic modeling with programming-based methods. This study also attempts to use the compromise programming method (CPM) for further detailed analysis.
- 1.
To assess the model's applicability in an urban watershed using NEXRAD precipitation data.
- 2.
To identify the risk of sub-catchment and junctions from 1D-flood analysis and risk zone map.
- 3.
To study the decrease in flow considering three different LIDs.
- 4.
To analyze and compare the critical sub-catchment list generated by the PCSWMM and the CPM, also study the decrease in flow by increasing LID application separately over identified critical sub-catchments.
The novelty idea of the study is the evaluation of the hydrologic model's effectiveness considering radar-based precipitation data and comparative study of flow decrement considering LID to provide insights into the approach for identification of critical sub-catchments. The approach is further analyzed by comparing the decrease in flow, increasing the application of one of the LIDs in the first five critical sub-catchments list generated by PCSWMM and CPM. The approach can be useful to identify the sub-catchments which could be highly prioritized for further development of flood mitigation or management techniques.
2 STUDY AREA
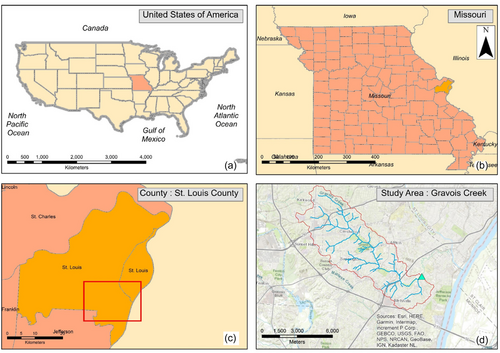
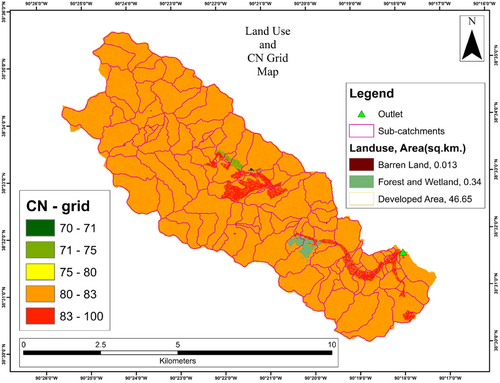
Gravois Creek is a stream in St. Louis County, Missouri, United States. The stream extends from Kirkwood to St. George. The outlet considered for the study is near Mehlville, with a latitude of 38°31′37.0″ and a longitude of 90°17′58.7″. The station id of the outlet is 07010180, and the datum is 128.67 m above. The watershed area delineated at the considered outlet point is approximately 48.43 km2. Since the study area considered is under the urbanized city, it covers the towns of Kirkwood, Oakland, Crestwood, Lakeshire, and Greenpark. Figure 1 shows the location map. The land use of the watershed covers 5.98 km2 of Developed Open Space, 24.66 km2 of Developed Low Intensity, 10.95 km2 of Developed Medium Intensity, 5.068 km2 of Developed High Intensity, 0.01 km2 of Barren Land, 0.10 km2 of Deciduous Forest, 0.005 km2 Evergreen Forest, 0.21 km2 of Mixed Forest, 0.02 km2 of Pasture, and 0.0045 km2 of Wetlands. Figure 2 shows the land use map.
The flow at the outlet point has been available from July 24, 1996, till the present. Model verification considers the flow value from May 20 to 25, 2019. The creek, considered less vulnerable in the past, has started to evidence flash floods due to unexpected storm events. The threatening flash flood was recorded on May 31, 2016 (Nolen, 2016), while again, the creek showed alarming flash flooding on June 26, 2019 (Benchaabane, 2019).
3 METHODOLOGY
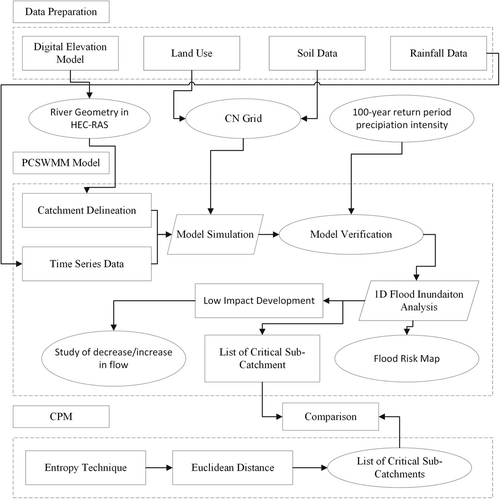
The study uses radar-based precipitation data to verify the model and considers the 100-year return period precipitation intensity to generate inundation area and 1D-flood risk zone map. Later, LID is considered to study the flow pattern and make a list of critical sub-catchment. Figure 3 shows the methodology flowchart outlining the framework developed for this study.
3.1 NEXRAD precipitation
The National Weather Service (NWS) in the United States manages the NEXRAD (Next-Generation Radar), the network of weather radar stations. The NEXRAD system uses Doppler radar technology and makes the data in several formats, including digital pictures, and gridded data products are helpful for forecasting and tracking precipitation events as well as supporting many weather-related applications, including flood warnings. NEXRAD precipitation data is updated every 5–10 min and has a spatial resolution of about 4 km. The data has several drawbacks, such as the difficulty of detecting light precipitation or precipitation at low levels. NEXRAD precipitation is a valuable resource for precipitation data in an ungauged watershed despite these drawbacks. NEXRAD has exceptional accuracy when compared to other satellite-based data (Huber & Trapp, 2009). Ras Mapper in PCSWMM helps to extract precipitation data and assign it to the individual sub-catchment.
3.2 Geometry processing
The primary step in any rainfall-runoff simulation is the generation of river geometry and is generated in HEC-RASThe digital elevation model is converted into the terrain surface in HEC-RAS and the geometry is digitized over the terrain surface. Since the rainfall-runoff simulation is assessed in PCSWMM, only the river geometry is generated, and Manning's coefficient is assigned in each river section. Manning's coefficient assigned in each section depends upon the land use near the river section (Passeri et al., 2018). Table 1 shows the river section and assigned Manning's coefficient.
| River section name | Land use | Manning's coefficient |
|---|---|---|
| River 1—Reach 1 | Developed Low Intensity | 0.05 |
| River 2—Reach 2 | Developed Medium Intensity | 0.06 |
| River 3—Reach 3 | Developed High Intensity | 0.08 |
| River 2—Reach 41 | Developed Medium Intensity | 0.06 |
| River 4—Reach 4 | Developed Low Intensity | 0.05 |
| River 1—Reach 51 | Developed Low Intensity | 0.05 |
| River 11—Reach 11 | Developed Medium Intensity | 0.06 |
| River 5—Reach 5 | Developed Low Intensity | 0.05 |
| River 5—Reach 71 | Developed Low Intensity | 0.05 |
| River 6—Reach 6 | Developed Low Intensity | 0.05 |
| River 1—Reach 61 | Mixed Forest | 0.1 |
| River 1—Reach 81 | Developed Medium Intensity | 0.06 |
| River 9—Reach 9 | Developed Medium Intensity | 0.06 |
| River 8—Reach 8 | Developed Medium Intensity | 0.06 |
| River 1—Reach 9 | Developed Low Intensity | 0.05 |
| River 8—Reach 101 | Developed Medium Intensity | 0.06 |
| River 1—Reach 31 | Developed Medium Intensity | 0.06 |
| River 1—Reach 13 | Developed Open Space | 0.03 |
| River 1—Reach 91 | Developed Open Space | 0.03 |
| River 1—Reach 111 | Developed Open Space | 0.03 |
| River 10—Reach 10 | Developed Medium Intensity | 0.06 |
| River 7—Reach 7 | Developed Medium Intensity | 0.06 |
3.3 Rainfall-runoff simulation
This study uses the PCSWMM for rainfall-runoff simulation. The professional tool PCSWMM allows the user an easy way of model creation with graphical user interface and time series data management for all aspects of water management. The digital elevation model from the United States Geological Survey (USGS) assists the river geometry and creates the sub-catchments. The river section from the HEC-RAS is directly imported into the PCSWMM. There are 93 sub-catchments created in this study. Figure 2 shows the sub-catchment. Further, the model requires the CN grid. Integrating land use and soil data yields the CN grid (Merwade, 2010). Figure 2 shows the CN grid of watershed area. Then the time series data of precipitation is assigned. This study considers the NEXRAD precipitation data. The Ras Mapper project of PCSWMM helps to extract the precipitation from NEXRAD and the Time Series from PCSWMM assigns the precipitation to each sub-catchment. To verify the model, the flow data from May 21 to 25, 2019. Later, for the flood modeling, the 100-year return period precipitation intensity creates the time series data in 6 min interval. SCS_Type_II_197.612 mm design storm with total rainfall of 197.612 mm is assigned to all sub-catchments on rain gauges (US Department of Commerce, 2005). An alternative to this is to integrate ocean-atmospheric-oscillation indices in an SVM directly. Such integration would allow streamflow to be predicted instantly 9–6 months in advance (Kalra et al., 2013).
3.3.1 1D-flood modeling
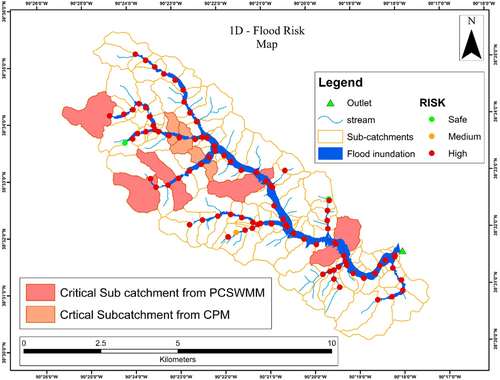
Flood modeling in PCSWMM involves the creation of floodplain transects and flooding vulnerable assets. Transects are created in 25 m intervals. The flood-vulnerable assets involve the addition of major urban infrastructure like bridges in the river centerline. The three major bridges are added to the flood asset layer. Furthermore, to point out the risk of each sub-catchment, a 1D-flood risk map is created in PCSWMM. In previous studies, the criteria of flood depth to map the risk area are usually compared with urban design settings criteria (Ouma & Tateishi, 2014; Q. Sun et al., 2022), but this study considers the in-built criteria of PCSWMM. It creates risk map on the basis of two parameters, duration, and depth of flooding (Luu et al., 2018). Table 2 shows the level of risk based on two criteria. The limit of the criteria varies with the watershed considered. The urban watershed considered in this study is compared on the basis of the criteria shown in Table 2. After hydraulic analysis, the color of the nodes represents the risk of sub-catchment. The nodes with green color represent the low risk, the orange color represents the medium risk, and the red color represents the high risk.
| Flooding duration | |||
|---|---|---|---|
| Flooding depth | 0–30 min | 30–60 min | 60–120 min |
| 0.15–0.25 m | Low risk | Medium risk | Medium risk |
| 0.25–0.5 m | Medium risk | High risk | High risk |
| >0.5 m | High risk | High risk | High risk |
3.3.2 Criteria for critical sub-catchment
Previous research has only taken runoff following a simulation that took several years of rainfall data into account when determining the criteria for critical sub-catchments (Tesfahunegn et al., 2013). Only 5 days of precipitation data from this study are used to verify the model, and data from a 100-year return period are used to analyze flood inundation. Additionally, the study applies the CAM to determine the most critical sub-catchments due to the narrow segmentation of the urban watershed. Surface area, slope, and impervious area are considered in this method's selection of the critical sub-catchments (Silva & Silva, 2020; Thompson et al., 2008).
3.4 Compromise programming method
The approach to multi-criteria decision-making is called CPM. It assumes that if the researcher acts logically, their option will fall within the subset of solutions, regardless of the decision maker's (DM's) preferences. In this study, Euclidean distance and the entropy technique were considered.
3.4.1 Entropy technique
 ()
() ()
() ()
()3.4.2 Euclidean distance
 ()
()3.5 Low-impact development
The risk of urban flooding is reduced by using several LID-related techniques. Infiltration trenches, green roofs, and bio-retention cells (street plants) are the three LIDs used in this study. The area of each unit, the number of replicating units, the surface width per unit, the percentage of the initially saturated area, the percentage of the impervious area treated area, and the percentage of the previous area treated are the values provided when assigning the LIDs. With one replicated unit, each unit's area is 100 square meters. With 50% of the impervious area treated and 10% of the previous area treated, the surface width is 10 m.
3.6 Verification
The verification of a model involves comparing the observed and simulated flow values using various statistical measures, including the Nash–Sutcliffe efficiency (NSE), root mean square (RMSE), percent bias (PBIAS), and standard deviation ratio (RSR). These measures are calculated to assess the accuracy and reliability of the model. To consider the model to be verified, the values of these measures should meet certain criteria, such as NSE greater than or equal to 0.65, and PBIAS within the range of  10% (Moriasi et al., 1983). The mean value of a set of data is also taken into consideration in these calculations. These values are obtained directly in PCSWMM.
4 RESULTS AND DISCUSSION
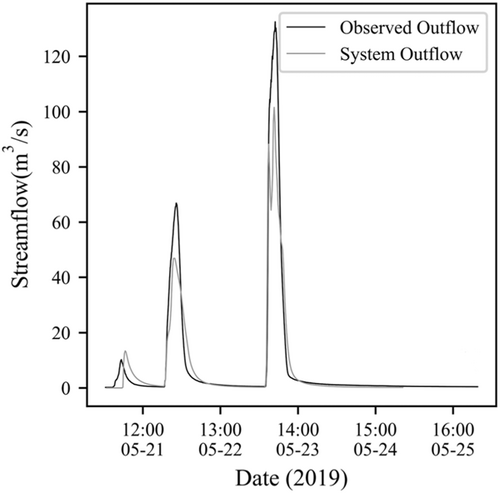
The study starts with the verification of PCSWMM model considering NEXRAD precipitation data. The RAS Mapper of the PCSWMM extracts the NEXRAD downloaded data and creates the data set for each sub-catchment of the watershed. By building individual rain gages for each of the 93 sub-catchments, the extracted rainfall data from May 21 to 25, 2019, are assigned to the defined watershed. Then, after the simulation, the model yields the outflow at the outlet point specified in the watershed. The outflow from each sub-catchment gets calculated which is further used in identifying critical sub-catchment on the basis of flow value. As a result, the system outflow generated by the simulated model is compared to the discharge from the USGS station. For a similar time frame, consider the maximum flow value after the simulation is 101.5 m3/s and the maximum flow value from the USGS gauge station from the same time frame is 132.5 m3/s. The correlation value is 0.91, the NSE value is 0.781, the NSE value is 7.19, and the RMSE value is 69.6. Therefore, the values obtained are within the range of verification values as mentioned in the methodology. As a result, when the model is verified, NEXRAD's precipitation is a good fit for the watershed's flow simulation in PCSWMM. Traditional rain gauges frequently lack the accuracy and resolution needed to provide accurate runoff predictions and flood warnings (Smiatek et al., 2017; Yu et al., 2019). According to earlier research, in any region, some stations exhibit a rising tendency in flow while others show a decreasing trend during different seasons in the same watershed (Thakur et al., 2020). Model verification has led to a consensus that the data are of excellent quality as an input to hydrological models (Kalin & Hantush, 2006; Koren et al., 1999). Figure 4 shows the hydrograph that represents the model's validation. The observed data and the system show that maximum flow values are 132.5 and 101.5 m3/s, respectively.
The verified model is again simulated considering the 100-year return period precipitation intensity, that is, 197.6 mm. Numerous studies consider the return period analysis to display the floodplain area and indicate the shift in extreme climatic circumstances. Therefore, a 2- to 100-year return period is accounted for to demonstrate how climate change would affect extreme rainfall events in the current risk of flooding (Das et al., 2013). Previous studies in St. Louis demonstrate the significant increase in flooding up to the 100-year return period, and then the increase is at a very slow rate (Kousky & Walls, 2014). Therefore, the study of the Gravois watershed considers precipitation over a 100-year return period and suggests solutions for its management to be ready for extreme flood events. This precipitation depth is now assigned to rain gages of all 93 sub-catchments. The 100-year return period precipitation is considered for the 1D-flood modeling and generates the maximum flow value of 762.3 m3/s (Figure 5). The mean outflow is 36.67 m3/s with the duration of exceedances of 95.5 h. The volume of water exceeded 12,670,000 m3. Figure 6 shows the inundation area generated from the 1D-flood modeling. The flood inundation map infers that the major tributary of the creek gets the flood from 100-year return period precipitation. 3.88 km2 is the approximate size of the flood plain. Only 0.128 km2 of undeveloped lands, such as forests, wetlands, and barren land, is covered by the floodplain. Approximately 3.68 km2 of the total area covers the developed or urbanized area, such as developed open space, developed low, medium, and high intensity. The generated flood inundation shows the maximum coverage of the urbanized area so, the majority of the developed land use is under the flood-prone zone. Therefore, the watershed requires effective planning to avoid any future social, environmental, and financial loss. Additionally, creating 1D-flood risk maps shows the watershed's higher risk zones. The PCSWMM in-built flood depth criteria are compared to each junction's flood depth, and the result is that the PCSWMM provides a risk map that shows the junction's risk and the catchment's risk. The criteria are described in Section 3. The color coding illustrates the risk. If the junction is green, it indicates that the watershed is in the low-risk/safe area; orange, the mild-risk area; and red, the high-risk area. So, looking at the flood risk map, most of the junctions illuminate the red color, except junctions J814 and J1074. The sub-catchment associated with the junctions J814 and J1074 are S70 and S33, respectively. Furthermore, J1074 illuminates the orange color which infers that the sub-catchment S70 is under medium risk and J814 illuminates the green color which infers that the sub-catchment S33 is in safe zone. Figure 6 shows the 1D-flood risk map.
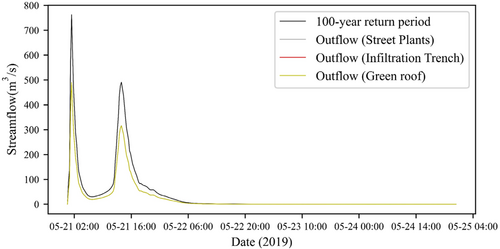
The susceptibility of each sub-catchment is revealed by identifying the junction risk. Previous research solely used LID at the sub-catchment contributing to high flow to study the decrease in flow at the exit. The Gravois watershed, however, had the most significant number of risky junctions. S33 and S70 are only low-risk/safe sub-catchments. Compared to other sub-catchments, these two have the smallest area. Although S33 is safe from 1D-flood risk analysis, it is on the top of the critical sub-catchment list by CPM. LID is therefore used throughout the watershed to examine the flow pattern. This study considers three LIDs: infiltration trenches, green roofs, and bio-retention cells (street plants). These three specified LIDs are used in urbanized watersheds with limited areas for flood planning and management. The berm height of 100 mm, the vegetation volume fraction of 0.1, Manning's roughness of 0.3, the surface slope of 0.25, and soil thickness of 450 mm are the characteristics given to street plants. Typical values are used to assign other properties. The properties of the infiltration trench are 100 mm berm height, 0.5 drain exponent, and 100 mm drain offset height. The characteristics of the green roof include 100 mm berm height, 0.1 plant volume fraction, 100 mm soil thickness, and 25.4 mm drainage mat. Typical values are used to assign other properties. The highest flow achieved after running the model with each LID considered separately is 490.6 m3/s for street plants, 489 m3/s for infiltration trenches, and 489 m3/s for green roofs. Figure 5 shows the decrease in hydrograph after LID application on comparing with the simulated outflow from 100-year return period precipitation. The comparison hydrograph illustrates the decrease in flow when various LIDs are considered. There is approximately 35.6% decrease in peak flow, while considering street plants, and 35.8% decrease while considering either infiltration trench or green roof. Since both the infiltration trenches and green roofs have low values, either LID can be used over a watershed as the optimum management approach to reduce the loss from flooding. Moreover, there is already 5.98 km2 of developed open space in watershed, which implies certain areas are already allocated for the plants which may be developed as parks. LID usage can be more significant to intercept, absorb, and retain runoff reducing the volume of water entering the streets and sewer systems.
Additionally, the CPM is considered to identify the watershed's critical sub-catchment and provide key insight for its management. The surface area, slope, and impervious area are the three factors considered. These three factors are considered because while applying the uncertainties on all parameters of the sub-catchment, sensitivity-based radio tuning calibration tool shows that the change in these parameters drastically change simulated flow values for flood inundation. Since three data sets exhibit irregularities in their values, a weighting factor calculated using the entropy technique is used for each parameter's data while determining the Euclidean distance. The code for calculation is written in C-Sharp (C#). Euclidean distance with the lowest value in a vector space indicates that the parameters under consideration are closely related. Therefore, the three closely related parameters play a significant role in determining the simulation's result value. So, the sub-catchment that shows the close relation of shape area, slope, and the impervious area for determining the flow simulation gets the low Euclidean distance. Therefore, the most critical sub-catchment is assigned based on the smallest Euclidean distance. According to previous studies, the sub-catchment with the highest outflow is the most critical one, but this is not likely to be true as output flow depends on the relation of several other values. In case of the Gravois watershed, the sub-catchment S61 is more critical for contributing maximum flow to the river, while CPM shows the S33 as more critical. The sub-catchment considered safe due to the low flood depth maintained is critical while considering the relation between the slope, surface area, and impervious area. Table 3 shows the five critical sub-catchment lists on the basis of flow from PCSWMM and Euclidean distance by the CPM.
| Rank for most critical | From PCSWMM | CPM |
|---|---|---|
| 1 | S61 | S33 |
| 2 | S12 | S72 |
| 3 | S44 | S22 |
| 4 | S48 | S34 |
| 5 | S35 | S17 |
- Abbreviations: CPM, compromise programming method; PCSWMM, Personal Computer Storm Water Management Model.
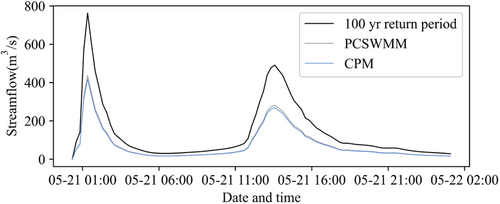
On applying LID over the watershed equally in each sub-catchment, the decrease in flow ranged from 35.6% to 35.8%. For more application of LID and study of the decrease in flow to suggest an approach for identifying the critical sub-catchments. LID is again increased in identified first five critical sub-catchments from two different methods. For this, the infiltration trench is considered, and on increasing the application of the infiltration trench in the first five critical sub-catchments from PCSWMM and CPM, the peak flow obtained is 436.81 and 416.99 m3/s, respectively. So, the decrement in flow is 42.7% when LID application is increased in critical ones from PCSWMM and 45.3% when critical ones are from CPM. Figure 7 shows the comparison of hydrograph from 100-year return period precipitation after the application of infiltration in critical sub-catchments from PCSWMM and CPM.
5 SUMMARY AND CONCLUSION
News of recent flash flooding in urban areas directs the community towards the study of urban watersheds like Gravois Creek and similar other watersheds. The planning and managing mitigation solutions require precise flood estimation and forecasting (Knebl et al., 2005; Zarei et al., 2021) and also, the identification of the watershed's crucial areas is equally essential for reducing social, environmental, and economic loss. The abnormality in precipitation causes flash floods in urban watersheds (Faccini et al., 2018; McLeod et al., 2017). In the current study, hydrologic modeling in PCSWMM considers fine-resolution precipitation data, NEXRAD. The model got verified with a correlation value of 0.91. In PCSWMM, the NEXRAD precipitation hence has better application for qthe ungauged watershed. So, the NEXRAD data can be considered for hydrological analysis in ungauged watershed.
By employing precipitation intensity over a 100-year return period, flood modeling in PCSWMM creates an inundation plain with a 3.88 km2 surface area. The created floodplain impacts the bulk of developed land uses. The 1D-flood risk map generated shows the risk of each junction. The color coding at each junction denotes the risk factor. Green denotes low risk, orange denotes medium risk, and red denotes extreme risk. Except for two sub-catchments, S33 and S70, all other junctions in the Gravois watershed exhibit a high risk. Consequently, the LID is used throughout the watershed to study the flow. Street plants, an infiltration trench, and a green roof are the three LIDs used in the watershed. The flow was reduced by 35.6% when considering street plants, 35.8% by infiltration trenches, and 35.8% by green roofs. Identifying critical sub-catchments is vital in flood management because it gives urban planners information they can use to manage a specific area immediately (Roughani et al., 2007). Previous studies considered LID increment only over the sub-catchments with high flow, but this study considers LID application over the critical sub-catchment list from CPM. The decrement of flow was high when the LID application was over critical sub-catchments from CPM rather than PCSWMM. However, surface area, slope, and impervious area also play a vital role in identifying critical sub-catchment. S61 is the most critical considering the flow value and S33, according to CPM. Therefore, when a mathematical model is considered, the S33, which is considered safe from flood risk assessments, is the most critical. Since S33 has a low surface and hence a low flow value, PCSWMM does not view it as a risk, but the close relationship between the three characteristics considered in CPM makes S33 the most critical one. Moreover, when the infiltration trench was considered and increased the application in critical sub-catchments, it showed the more decrement in flow when applied in the ones identified from CPM. The flow decreased by 45.3% when the infiltration trench was applied in the critical ones identified by CPM. The study concludes with the suggestion of considering the programming-based approach to directly identify the sub-catchments that require greater attention in the management of flood mitigation strategies.
The important research goal was to develop an approach for the identification of critical sub-catchments and give utmost importance to them. The application of LID over the critical sub-catchments from CPM showed a higher decrease in flow than those identified by hydraulic modeling, so the CPM-based approach is suggested for the application of LID. This approach can serve the global scientific community for flood management in ungauged urban watershed by directly identifying critical areas, or moreover direct application to watersheds with similar geographic features as Gravois. The advantages of the proposed analysis are NEXRAD data are easily available for modeling, flood risk of each sub-catchment is identified in hydraulic modeling, and critical sub-catchments are identified so that planners and managers can give priority to those areas. The drawbacks of the proposed study can be consideration of only three different LIDs and later considering only one LID after the identification of critical sub-catchments, also considering only single programming-based method for comparison. So, future studies can consider and combine several LIDs at a single simulation while considering the future projected flow value from climatic models (Aryal et al., 2022; Pokhrel et al., 2020)and compare the list of critical sub-catchments with other machine learning models. Additionally, the study can also be further extended to compare accuracy with machine learning models (Bhusal et al., 2022).
ACKNOWLEDGMENTS
The authors would like to thank the reviewer and associate editor for providing valuable comments that helped in improving the overall quality of the manuscript. The authors would like to thank the University of Illinois System (Award #107688) for providing research support for the current study. The authors would like to extend gratitude to Computational Hydraulics Int. (CHI) for providing access to PCSWMM.
ETHICS STATEMENT
The author assures that the paper has not been published anywhere.
Open Research
DATA AVAILABILITY STATEMENT
The data sets used in the current analysis are freely available from online resources. All the data links have been provided in the manuscript.


