Quantum Chemical, Spectroscopic and In Silico (Molecular Docking, Molecular Dynamic and ADME) Studies on Anti-Aging Pentapeptide-3 (Vialox)
Funding: The authors received no specific funding for this work.
ABSTRACT
Skin aging is accelerated by environmental factors such as long-term UV exposure, stress, smoking, alcohol consumption, and a poor diet. This process primarily results from the build up of oxidative stress caused by reactive oxygen species (ROS). Pollutants, toxins, and excessive exposure to ultraviolet A (UVA) radiation trigger the production of ROS. Common visible signs of skin aging, including wrinkles, spots, fine lines, and loss of moisture and elasticity, serve as both indicators and targets for treating skin aging. Anti-aging peptides have been extensively researched for their potential to prevent skin aging, maintain skin health, and reduce ROS due to their unique properties, including low molecular weight, modifiability, and minimal bioaccumulation. These peptides, known as cosmeceutical peptides, can interact with signaling pathways and receptors that play a crucial role in the skin aging process. Their ability to influence these mechanisms of aging is an important area of ongoing research in the field of skin treatment. Pentapeptide-3 (Vialox) has the sequence Gly-Pro-Arg-Pro-Ala and is derived from snake venom. It functions as an antagonist of the acetylcholine receptor, safely blocking the release of sodium ions at the synaptic membrane of muscles. This action prevents muscles from contracting as frequently, leading to muscle relaxation. This article attempts to investigate the potential interactions of Pentapeptide-3, a synthetic peptide, with Transforming Growth Factor-β receptor-1 (TGF-β receptor-1), Tumor necrosis factor-α (TNF-α), Mitogen-Activated Protein Kinase 14 (MAPK14), and RAC-alpha serine/threonine-protein kinase (AKT-1) signaling pathways, which are the targets of anti-aging activities with in silico approaches. The geometric optimization, theoretical vibrational wavenumbers, HOMO-LUMO, and MEP analyses were performed using the DFT method and the 6-31++G(d,p) basis set to describe and understand their electronic structure and reactive sites of Pentapeptide-3. A Potential Energy Distribution (PED) analysis was conducted to elucidate fundamental vibrational wavenumbers and their assignments. By comparing the theoretical and experimental wavenumbers from FTIR, ATR-FTIR, and Raman spectra, appropriate wavenumber assignments were also determined for each amino acid residue in the Pentapeptide-3 sequence. The molecular interactions of Pentapeptide-3 with various receptors that are important in skin aging were also explored using in silico methods, including molecular docking and molecular dynamics analysis. The molecular docking results revealed binding energies of −8.12 kcal/mol for (TGF-β receptor-I) and −8.25 kcal/mol for MAPK14. Additionally, molecular dynamics studies were conducted for 50 and 100 ns, indicating that Pentapeptide-3 remained stable in the active sites of both receptors. Theoretical, experimental, and in silico studies suggest that Pentapeptide-3 is a promising candidate for preventing and treating skin aging.
1 Introduction
Human skin is a dynamic structure that adapts to protect the body's internal systems from environmental factors while facilitating external interactions [1, 2]. As we age, our skin undergoes degeneration due to both internal aging mechanisms and external influences. Internal changes occur due to hormonal shifts and metabolic processes, while external factors include exposure to UV rays, pollution, toxins, alcohol and tobacco use, and an unbalanced diet. With aging, the skin's ability to retain moisture and its elasticity decline, leading to irregular pigmentation. The aging process is often marked by the development of fine lines and wrinkles as the skin becomes drier and loses its flexibility [3-8]. The skin consists of various tissues that function together and is structurally divided into three layers: the epidermis, dermis, and hypodermis. The epidermis is the outermost layer of the skin that interacts with the environment and protects against pathogens such as bacteria, viruses, and parasites. This layer is resistant to both chemical and mechanical damage and contains several important cell types. Melanocytes are pigment cells that protect the skin from UV radiation, keratinocytes are skin cells that support protein synthesis, cell growth, and overall skin structure, and Langerhans cells are immune cells that help guard the body against infections. Beneath the epidermis lies the dermis, which is composed of a dense network of collagen and elastin fibers that provide strength and flexibility to the skin. This network is surrounded by a gel-like substance known as the extracellular matrix (ECM). The dermis is also home to fibronectins, which play a crucial role in wound healing and cell growth. Additionally, the dermis contains various immune cells, including dermal dendritic cells, macrophages, mast cells, eosinophils, neutrophils, B-lymphocytes, and natural killer T cells, all of which are involved in preventing infections and repairing damaged tissue. The hypodermis, or subcutaneous layer, lies beneath the dermis and consists of collagen fibers and fat cells. It connects the dermis to muscles and bones, offering insulation and protection from external trauma and temperature extremes [1]. Changes due to skin aging are most evident in the dermis, but they also affect the epidermis and hypodermis layers. Structural alterations occur in collagen and elastin, which form the skin's framework, as well as in proteoglycans and glycosaminoglycans, which help maintain the skin's firmness and hydration. These changes lead to a deterioration of the ECM in the dermis, resulting in decreased skin thickness and elasticity. Moreover, changes in the ratios of collagen types IV, VII, and XVII, integrins, and laminins weaken communication between the epidermis and dermis and disrupt metabolic processes within these layers. Hyaluronic acid depletion in the epidermis due to aging contributes to skin dryness. Furthermore, the decline in the activity and populations of melanocytes and Langerhans cells in the epidermis leads to irregular pigmentation and diminished immune functions. In the hypodermis, aging is associated with a reduction in subcutaneous fat tissue [3-8].
Certain signaling pathways play a significant role in the process of photoaging. The TGF-β/Smad signaling pathway, which comprises transforming growth factor beta (TGF-β), cell receptors, and Smad proteins, plays a crucial role in regulating matrix metalloproteinase (MMP) activity and type I collagen synthesis in the dermis [4, 9-15]. TGF-β is an essential cytokine that regulates ECM synthesis, including collagen, elastin, and fibronectin, through its two receptors: type I TGF-β receptor (TGF-β receptor-1) and type II TGF-β receptor (T-βRII). TGFβ also acts as a growth inhibitor for keratinocytes, the cells responsible for repairing wounds and forming the epidermis layer of the skin. Conversely, it serves as a growth stimulator for dermal fibroblasts, which are capable of communicating with other cells to help maintain the integrity of the ECM. This matrix forms the basic framework of tissues and plays a crucial role in skin wound healing [9, 12-14]. Tumor necrosis factor-alpha (TNF-α) is a multifunctional cytokine that plays a key role in inflammation, immune responses, and apoptosis. Secreted by keratinocytes and dermal fibroblasts [16, 17], TNF-α is significant in the process of photodamage and photoaging of the skin, particularly due to exposure to ultraviolet (UV) radiation [18]. Keratinocytes function as a physical barrier in the skin, support immune defense, and modulate neurological functions [19]. On the other hand, dermal fibroblasts are essential for producing and regulating the ECM in the dermis, facilitating communication between different cell types, repairing skin physiology, and aiding in wound healing. Exposure to UVB radiation stimulates the production of TNF-α, which can lead to the deterioration of various cellular functions. This process triggers the release of collagenase and elastase, contributing to skin damage and the development of signs associated with photoaging [20-24]. AKT, also known as protein kinase B-I, is a serine/threonine protein kinase that serves as a crucial signaling hub in various cellular processes. It consists of three isoforms: AKT-1, which is involved in cell development and survival; AKT-2, which helps maintain glucose homeostasis through insulin signaling; and AKT-3, which is linked to brain development [25-28]. AKT plays a vital role in promoting cell survival in response to growth factors, oncogenes, and cellular stress [26, 29]. MAPK enzymes, or mitogen-activated protein kinases, are regulated by phosphorylation, which is a crucial process in signal transduction pathways. The MAPK signaling pathway plays a vital role in various biological processes, including apoptosis, differentiation, stress response, and proliferation [30-32]. An important component of the MAPK signaling pathway is the p38 pathway, which responds to environmental and cellular stress. The MAPK signaling pathway is particularly important for regulating oxidative stress and inflammation, both of which contribute to and accelerate the aging process [30, 33]. MAPK enzymes also play a pivotal role as modulators in inflammatory processes that increase with aging. Proper activation of these enzymes and an appropriate stress response are essential for cell survival [30, 34]. Maintaining normal levels of MAPK enzymes is crucial for delaying the effects of irreversible aging. Anti-aging peptides are considered a promising treatment option for therapeutic interventions due to their small size and exceptional ability to penetrate cell membranes. They can evade the immune system, exhibit high sensitivity, are cost-effective, and are easy to apply, making them a safe choice. These peptides play a significant role in anti-aging treatment strategies by facilitating communication between cells, regulating the activity of enzymes such as collagenase, aiding in the transport and delivery of biomolecules, and inhibiting the production of neurotransmitters like acetylcholine [35].
Cosmeceutical peptides are widely used in the cosmetics industry for their ability to interact with skin cells through various mechanisms. They are particularly effective in treating conditions such as skin aging, pigmentation issues, immune responses, and inflammation. Depending on their interactions within the cell, cosmeceutical peptides can be classified into four categories: signal peptides, carrier peptides, neurotransmitter-inhibitory peptides, and enzyme-inhibitory peptides [36]. Neurotransmitter-inhibitory peptides are especially important for reducing wrinkles and fine lines on the skin. They work by inhibiting the release of acetylcholine, a neurotransmitter that is released at the neuromuscular junction due to both voluntary and involuntary muscle movements. This inhibition prevents acetylcholine from binding to its receptors, resulting in smoother skin.
One example of a peptide in this category is Pentapeptide-3 [36, 37], commonly known by its trade name, Vialox. Pentapeptide-3 is a pentapeptide fragment derived from the peptide structure of Waglerin-1 venom, which is obtained from the temple viper (T. wagleri). The sequence of Pentapeptide-3 is Gly-Pro-Arg-Pro-Ala, and it acts as a competitive antagonist of the acetylcholine (ACh) receptor. It prevents sodium ion channels from opening by blocking the binding sites of nicotinic cholinergic receptors (nAChRs) that respond to the neurotransmitter acetylcholine. This inhibition improves the appearance of wrinkles and fine lines by preventing muscle contractions. In vitro studies have demonstrated that Pentapeptide-3 can reduce muscle cell contraction by 71% just in minutes after the initial application and by 58% after 2 h. Additionally, in vivo studies have indicated that after 28 days of use, Pentapeptide-3 reduces wrinkle size by 49% and increases skin smoothness by 47% [37-41].
To clarify the therapeutic effects of anti-aging peptides, it is essential to understand their structural properties, explore their interactions within various signaling pathways at the molecular level, and develop new strategies for both their current applications and future advancements.
This study investigated the anti-aging properties of Pentapeptide-3, a peptide whose effectiveness has been demonstrated through various in vivo and in vitro methods. Key signaling pathways, including Transforming Growth Factor-β1 (TGF-β receptor-1), Tumor Necrosis Factor-α (TNF-α), Mitogen-Activated Protein Kinase 14 (MAPK14), and RAC-alpha serine/threonine-protein kinase (AKT-1), were examined using in silico approaches. Potential interactions were analyzed through molecular docking and molecular dynamics simulations. Quantum mechanical calculations, such as optimization, vibrational wavenumbers, HOMO-LUMO orbital analysis, and MEP analysis, were conducted to elucidate the peptide's structure. Fundamental vibrational band analyses were also conducted using potential energy distribution (PED) analysis. Furthermore, the primary characteristic peaks of Pentapeptide-3 were investigated through experimental methods, including Fourier transform infrared spectroscopy (FTIR), attenuated total reflectance (ATR), and Raman spectroscopy. Research from theoretical, experimental, and in silico studies indicates that Pentapeptide-3 is a promising candidate for preventing and treating skin aging, showcasing its potential as an effective anti-aging peptide.
2 Materials and Methods
2.1 Material
Pentapeptide-3 with the sequence H-Gly-Pro-Arg-Pro-Ala-NH2, molecular formula C21H37N9O5, molecular weight 495.6 g/mol, and CAS number 135679-88-8 was purchased with 95% purity from Cayman Chemical Co. Inc.
2.2 Methods
2.2.1 Structural Analysis
The geometric structure of the Pentapeptide-3 (CAS: 135679-88-8) was obtained from the PubChem Database (CID: 11605666). Quantum mechanical computations were performed using the Gaussian 09 software package [42]. The calculations were carried out using density functional theory (DFT) with the B3LYP/6-31++G(d,p) [43] method. Pentapeptide-3 was first optimized, and then the theoretical vibrational wavenumbers were calculated. A PED analysis was conducted using the GAR2PED program [44].
2.2.2 Molecular Electrostatic Potential (MEP) Analysis
The MEP analyses for Pentapeptide-3 were performed using the Gaussian09 software with the DFT/B3LYP/6-31++G(d,p) basis set. MEP analysis provides valuable insights into the distribution of positive and negative charges within a molecule, which significantly influences its chemical reactivity and interaction profile. This type of analysis can also help us understand interactions in biological systems [45]. In the MEP map, regions with a positive electrostatic potential are represented in blue, while regions with a negative potential are depicted in red. The potential values increase positively along a gradient from red to blue, transitioning through colors such as orange, yellow, and green [46].
2.2.3 HOMO-LUMO Analysis
HOMO-LUMO energies were calculated for Pentapeptide-3 in both vacuum and aqueous mediums using the DFT method with the B3LYP theory level and the 6-31++G(d,p) basis set. The energies of the HOMO (Highest Occupied Molecular Orbital) and LUMO (Lowest Unoccupied Molecular Orbital) are important in quantum physics and chemistry, as they are used to calculate and evaluate key parameters such as ionization energy, electron affinity, and chemical hardness [47]. These parameters play a significant role in the chemical reactivity of the molecule. The HOMO is the highest energy orbital occupied by electrons within the molecule, and its energy relates to the molecule's ionization potential. Conversely, the LUMO represents the lowest unoccupied molecular orbital, with its energy associated with the molecule's electron affinity. We used the following formulas to calculate the relevant properties: Ionization energy (I) = −EHOMO, Electron affinity (A) = −ELUMO, Electronegativity (χ) = (1 + A)/2, Chemical potential (μ) = −(I + A)/2, Chemical hardness (η) = (I − A)/2 [48]. These calculations are crucial for understanding the reactivity of Pentapeptide-3.
2.2.4 FTIR and Raman Spectroscopy Analyses
Pentapeptide-3 was prepared using the KBr disk technique, a common method for preparing solid samples, and its FTIR spectrum was recorded with a Jasco FT/IR-6300 spectrometer covering the spectral range of 4000 to 400 cm−1. Additionally, the ATR spectrum of Pentapeptide-3 was obtained using an Alpha Bruker Platinum ATR spectrometer, also in the spectral range of 4000–400 cm−1. The Raman spectrum of the Pentapeptide-3 was captured at room temperature using a Jasco micro-Raman spectrometer (plate number NRS-3100) equipped with a 1200 lines/mm grating and a high-sensitivity cooled CCD. Both green and red lasers were employed, and notch filters were used to eliminate Rayleigh scattering before acquiring the spectrum. The calibration of the spectrometer was performed using the silicon phonon mode at 520 cm−1.
2.2.5 Molecular Docking Studies
The crystal structures of the enzymes TGF-β receptor-1 (PDB: 6B8Y) [49], TNF-α (PDB: 2AZ5) [50], AKT-1 (PDB: 4GV1) [51], and MAPK14 (PDB: 3ZSG) [52] were obtained from the Protein Data Bank. For the molecular docking analysis, interactions between the receptors and ligands were examined using the Schrödinger Software Maestro 12.5 program [53]. Before molecular docking, Pentapeptide-3 was prepared using the OPLS force field and the ligand preparation tool [54-56] within the Schrödinger Glide module. The receptors were prepared for docking by removing water molecules and ions from their structures and adding polar hydrogen atoms using the protein preparation tool in the same module. Charge values of the proteins were predicted based on the desired pH environment using PROPKA [57], and the optimization of the receptors was performed with the OPLS3 force field [58, 59]. To identify the appropriate binding site, the area with the ligand at its center was selected using the Grid tool, and the docking process was executed with standard sensitivity (SP).
2.2.6 Molecular Dynamic Studies
The ligand-receptor complex systems with the lowest binding energies, determined through molecular docking analysis, were selected for the molecular dynamics (MD) study. The MD analysis was conducted using the Desmond simulation package from the Schrödinger software [60, 61].
In this study, Na+ and Cl− ions were added to the system, and the TIP3P water model was employed to neutralize the receptor-ligand structure. Once the complex structures were neutralized with the added ions, the “steepest descent” algorithm was applied to obtain optimal geometries and prevent steric clashes. This algorithm minimized the energy of the systems. The complex structures that reached minimum energy levels were then stabilized at 1 atm and 300 K. Molecular dynamics trajectories of the resulting neutralized and stabilized complex structures were obtained by running MD simulations for 100 ns. These trajectories consist of sequential snapshots of the simulated molecular system, representing atomic coordinates at specific time intervals. The trajectories resulting from the MD studies were analyzed, focusing on the root mean square deviation (RMSD) and root mean square fluctuation (RMSF) values to gain insight into the stability of the complex structure. The RMSD value measures the average distance between a group of atoms, indicating how much a specific molecular structure deviates from the reference geometry over time. In contrast, the RMSF value measures the fluctuations of individual residues throughout the simulation, rather than the positional changes of the entire structure.
2.2.7 ADME Analysis
The Qik-Prop module [53] of the Schrödinger program was used to analyze the absorption, distribution, metabolism, and excretion (ADME) profile of the Pentapeptide-3 peptide. This module provides insights into how closely the compound adheres to Lipinski's rules for drug-likeness. To evaluate the drug-likeness profile of the candidate molecules, several parameters are calculated, including the number of hydrogen bond donors, the number of hydrogen bond acceptors, molecular weight (MW), the octanol/water partition coefficient (logPo/w), Caco-2 permeability, and HERG K+ channel blockage [62].
3 Results and Discussion
3.1 Geometrical Parameters
Pentapeptide-3, known by the trade name (Vialox) is a pentapeptide with the sequence Gly-Pro-Arg-Pro-Ala. The N-terminal end of the pentapeptide has a Glycine (Gly) residue, and the C-terminal end has an Alanine (Ala) residue. The pentapeptide structure, with the sequence Gly-Pro-Arg-Pro-Ala, has four peptide bonds depending on the structural arrangement. It is important to investigate peptide groups, along with N-terminal and C-terminal parts, that are effective in structural stability and activity. The initial and post-optimization geometrical structures of Pentapeptide-3 are given in Figure 1.
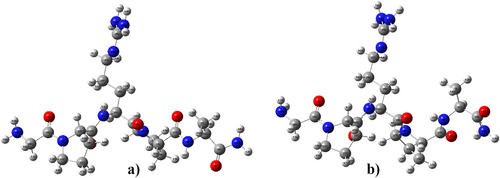
The geometric optimization was performed with the DFT/B3LYP method with 6-31++G(d,p) basis set by the Gaussian09 package program [42]. The neutral Pentapeptide-3 comprises 72 atoms with 210 vibrational frequencies. The calculated bond distances, bond angles, and torsion angles of Pentapeptide-3 were tabulated in Table S1.
In the optimization study of Pro-Tyr performed using the 6-31++G(d,p) basis set, the peptide bond length was reported as 1.3591 Å [63]. In this study, the peptide bonds of Pro-Arg and Pro-Ala in Pentapeptide-3 were determined to have lengths of 1.3586 and 1.3499 Å, respectively. In the optimization study of the Gly-Gln structure, the peptide bond length value was calculated as 1.362 Å [64], and in the optimization study of the Gly-Tyr structure, it was calculated as 1.37 Å [65]. In this study, the peptide bond between Gly-Pro in the amino acid chain of Pentapeptide-3 was determined to have a length of 1.3621 Å. As a result, the peptide bonds in Pentapeptide-3 were compatible with the reference values. The bond length of CO in the peptide group was calculated as 1.227 Å in the Gly-Tyr [65] study, and the CO bond in the peptide bond between Gly-Pro in Pentapeptide-3 was calculated as 1.2338 Å. While the bond length of CO in the peptide group of the Pro-Tyr dipeptide was 1.2312 Å [63], in this study, it was calculated as 1.2318 and 1.2393 Å in the Pro-Arg and Pro-Ala peptide groups in Pentapeptide-3, respectively. The NH bond lengths in the peptide group were calculated as 1.0105 Å (Pro-Arg peptide group) and 1.0211 Å (Pro-Ala peptide group), which are consistent with the literature value of 1.0166 Å [63]. The 4O-28C-7N, the 2O-25C-8N, and the 3O-27C-9N bond angles are calculated to be 121.656°, 122.908°, and 123.381°, respectively. These angle values were reported in the literature as 124.270° in the Pro-Tyr study [63] and 123.0° in the Gly-Tyr study [65].
3.2 Vibrational Analysis
The fundamental vibration wavenumbers of Pentapeptide-3 were calculated using the Gaussian 09 program with the DFT-B3LYP method and the 6-31++G(d,p) basis set. To ensure the accurate assignment of the vibrational modes, the %PED was calculated using the Gar2PED program. The theoretical wavenumbers were scaled using scale factors chosen as 0.958 for above 1800 cm−1 and 0.983 for below 1800 cm−1 [66]. FTIR, ATR-FTIR, and Raman spectra of Pentapeptide-3 are shown in Figures 2-5. Theoretical and experimental wavenumbers from FTIR, ATR-FTIR, and Raman spectra were compared, assigned based on literature values, and summarized in Table S2.


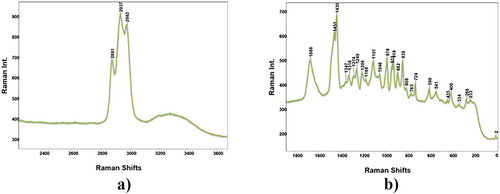

Pentapeptide-3 has a pentapeptide structure with the five-peptide sequence Gly-Pro-Arg-Pro-Ala. By determining the fundamental wavenumbers of Pentapeptide-3, they were assigned based on considering each amino acid residue in the sequence. The asymmetric and symmetric NH bond stretching wavenumbers were theoretically calculated at 3418 and 3347 cm−1. The NH bond stretching was theoretically calculated as 3415 and 3348 cm−1 in the literature [67] and was experimentally observed at 3414 cm−1 in the IR spectrum for glycine [68]. The NH stretching of the NHCO peptide group was calculated as 3301 cm−1, and a small intensity peak was observed at 3304 cm−1 in the ATR spectrum. Various wavenumbers were reported in the literature for CH bond stretching for aromatic and aliphatic groups [63, 68, 69] (see Table S2). In this study, asymmetric CH bond stretching was observed at 2980 cm−1 (ATR), 2989, 2957 cm−1 (IR), and 2982 cm−1 (Raman), and symmetric CH bond stretching was observed at 2881 cm−1 (ATR) 2885 cm−1 (IR), and 2881 cm−1 (Raman). CO bond stretching vibration mode is observed in the wavenumber range of 1800–1650 cm−1 [70]. The CO bond stretching in the carboxyl group of alanine was observed at 1733 cm−1 in the literature [71]. In this study, it was calculated theoretically as 1727 cm−1 and was observed at 1732 cm−1 in the Raman spectrum [72]. The amide I band is defined predominantly by CO (70%–85%) and CN (10%–20%) stretching vibrations in the peptide group, observed intensely in the range of 1600–1700 cm−1 [72, 73]. Amide I peaks belonging to the peptide groups in this study were observed at 1654, 1637 cm−1 in the ATR spectrum, 1699, 1683, 1668 cm−1 in the FTIR spectrum, and 1698, 1678, 1668 (red); 1666, 1637 cm−1 (green). Amide II vibrations are defined by the in-plane bending motion of NH (40%–60%) and CN stretching vibration (40%–18%) [72]. In this study, amide II peaks were observed at 1542 and 1533 cm−1 in the ATR spectrum, 1539 cm−1 in the FTIR spectrum, and 1547 and 1524 cm−1 [74] and 1545 cm−1 [75] according to the literature. Amide III vibrations are other amide group vibrations with CNH angle bending and CN stretching contribution. In the literature, it was usually observed around 1275–1200 cm−1 [73, 76, 77]. In this study, it was observed at 1243; 1197 cm−1 in the ATR spectrum, 1245 in the FTIR spectrum, and 1198 cm−1 in the Raman spectrum.
In agreement with the literature [67, 71], the HNH scissoring vibration mode of the glycine residue in the Pentapeptide-3 molecule was observed at 1557 cm−1 in FTIR, 1559 cm−1 in ATR spectrum. The HNH scissoring vibration mode of the arginine residue was also observed at 1626 cm−1 in ATR, 1624, 1599 cm−1 in the Raman spectrum. For arginine, this vibration mode was reported to be observed at 1639 and 1650 cm−1 in the IR and Raman spectra, respectively [78].
The HCH scissoring vibration mode of the proline residue was calculated as 1494 and 1491 cm−1 and observed at 1508 cm−1 in the Raman spectrum. In the literature, this mode of the proline was calculated as 1496 cm−1 and observed at 1490 cm−1 [63] and 1483 cm−1 [69] in the vibrational spectroscopy studies. Another HCH scissoring motion of the proline residue was observed at 1450 cm−1 in the ATR and 1451, 1452 cm−1 in the Raman spectra in this study, consistent with the literature [69]. This vibration mode of the alanine residue was observed at 1464 cm−1 in the FTIR spectrum in this study and the corresponding calculated value was given at 1465 cm−1. The HCH scissoring vibration mode of the alanine residue was reported as 1456 cm−1 (IR) and 1448 cm−1 (Raman) in the literature study [71]. Additionally, the HCH scissoring motion of the arginine residue in the Pentapeptide-3 molecule was observed at 1455 cm−1 in the FTIR spectrum and was calculated as 1454 cm−1 in the theoretical study. The HCH scissoring vibration mode of the glycine residue was also observed at 1435 cm−1 in the FTIR, 1430 cm−1 in the ATR, 1429 cm−1 (red laser) and 1430 cm−1 (green laser) in the Raman spectra. The HCH umbrella vibration mode of the alanine residue was also calculated as 1392 cm−1 and observed at 1393 cm−1 in the Raman spectrum, in accordance with the literature [71].
The CCH wagging motion of the arginine residue was reported in the literature to be observed in the IR and Raman spectra at 1364 cm−1 [63]. According to this information, in this study, the CCH wagging motion for the arginine residue was observed at 1365 cm−1 in the Raman spectrum. Additionally, this wavenumber was theoretically calculated as 1363 cm−1. Another wagging motion of the arginine residue was calculated as 1312 cm−1 and observed at 1310 cm−1 in the Raman spectrum. The CCH wagging motion of the proline residue was observed at 1284 cm−1 in the FTIR spectrum. Other CCH wagging motions were recorded at 1343, 1323, 1286, and 1269 cm−1 in the Raman spectra, in accordance with the literature values [69]. The CCH wagging motion of the glycine residue was observed at 1305 cm−1 in the Raman spectrum (red laser), while this mode was reported to be observed at 1310 cm−1 in the IR spectrum in the literature [79].
The CCH twisting mode of arginine was theoretically calculated as 1296 cm−1, while this mode was calculated as 1293 cm−1 theoretically in the literature [80]. In the experimental spectra, this mode was observed at 1295 cm−1 in the Raman spectrum (red laser). Additionally, the CCH twisting mode of arginine was also observed at 1212 cm−1 in the Raman spectrum, in accordance with the literature values [80]. The wavenumbers corresponding to the twisting mode of proline residues were observed at 1177 cm−1 in the ATR spectrum, at 1182 cm−1 in the FTIR spectrum, and at 1180 cm−1 in the Raman spectrum, which were similar to the theoretically calculated values.
The CCH rocking modes of proline residues were observed at 874 cm−1 in the ATR spectrum, at 876, 838 cm−1 in the FTIR spectrum, and at 882, 879, 838, 835 cm−1 in the Raman spectra [63]. The CCH rocking modes of arginine residue were observed at 1274, 1125, 859 cm−1 in the Raman spectrum. In addition, the rocking modes of arginine were observed at 1281, 1124 cm−1 (ATR) by [80]. Moreover, the CCH rocking modes of alanine were observed at 1319 cm−1 in the ATR and FTIR spectra, and 1318, 1023 cm−1 in the Raman spectra by [69, 71]. Theoretically, the wavenumbers corresponding to this mode were calculated as 1317 and 1022 cm−1.
The CNH rocking mode of glycine residue was observed at 1356 cm−1 in the FTIR spectrum. In addition, the peaks where rocking modes of arginine were observed are 1203, 1065 cm−1 in the FTIR spectrum and 1204, 1069 cm−1 in the Raman spectrum following the literature values [69]. The CNH rocking motion of the alanine residue was observed at 1261 cm−1 in the Raman spectrum.
The wavenumbers corresponding to the ring breathing modes of the two proline residues in the pentapeptide were determined as 833 cm−1 in the ATR spectrum for the second proline and 703 cm−1 in the Raman spectrum for the fourth proline. In addition, the wavenumber corresponding to the ring breathing modes of the proline residue was determined as 680 cm−1 in the ATR spectrum and 683 cm−1 in the Raman spectrum.
The CN bond stretching of the amino groups in the arginine side chain was observed at 1703 cm−1 in the FTIR and 1712 cm−1 in the Raman for the double bond and 1386 cm−1 in the Raman for the single bond stretching. The CN bond stretching vibration of proline was also recorded at 1198 cm−1 in the Raman spectrum and assigned to the calculated theoretical value of 1197 cm−1. The CC bond stretching for proline was observed at 1041 and 1042 cm−1 in FTIR and Raman, respectively. The CC bond stretching for arginine was recorded at 992 and 991 cm−1 in ATR and FTIR, respectively, while it was theoretically calculated at 996 cm−1.
Peaks corresponding to the CCNH movement of peptide groups were observed at 920, 660, 459, 437 cm−1 in the ATR spectrum, 920, 457, 440 cm−1 in the FTIR spectrum, and 919, 917, 662, 645, 435 cm−1 in the Raman spectra.
3.3 MEP Analysis
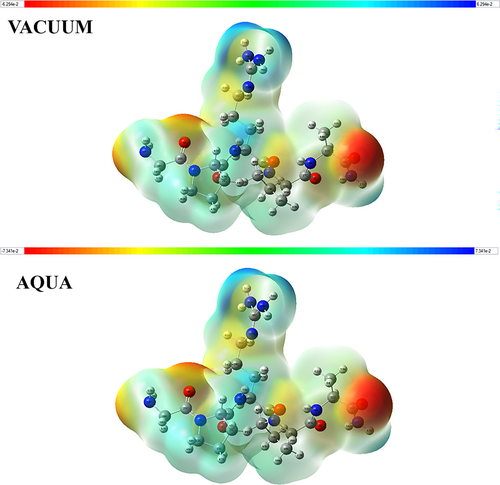
The MEP analysis of the Pentapeptide-3 molecule was conducted using the Gaussian09 software, employing the DFT/B3LYP/6-31++G(d,p) basis set. The analysis revealed that the potential values of the most electron-rich and electron-poor regions ranged between ±0.06294 a.u. The most electron-rich regions (indicated in red) in the Pentapeptide-3 were found at the O5 atom of the CO-NH2 group in the alanine amino acid, with an energy of −0.0628628 a.u. Another significant electron-rich area was located at the O4 atom near the peptide bond connecting the glycine and proline amino acids, yielding an energy value of −0.0534979 a.u. Additional red regions were identified at the O2 atom in the peptide bond between proline and arginine residues and at the N10 atom in the amino group of the glycine amino acid, with energies of −0.0452895 and −0.0494041 a.u., respectively. Conversely, the most electron-deficient region (shown in blue) was found at the amino groups in the side chain of the arginine amino acid. The energies for the blue regions associated with H71 and H72, bound to the N14 nitrogen in the arginine side chain, were measured as 0.051063 and 0.0500095 a.u., respectively. Additionally, the energy of H69, bonded to N13 in the arginine side chain, was determined to be 0.0467977 a.u. It was noted that the positions of the red and blue regions remained unchanged in an aqueous environment. The energies for the red regions at the O5, O4, O2, and N10 atoms were assessed at −0.0731681, −0.0649288, −0.0522337, and −0.0529426 a.u., respectively. The energy values for the blue regions at H71 and H72 bound to N14, as well as H69 bound to N13, were found to be 0.0583677, 0.0576936, and 0.053031 a.u., respectively (see Figure 6). The MEP potential plays a crucial role in predicting biological interactions [81, 82]. Compared to molecular docking and molecular dynamics analyses, the atoms in the identified red and blue regions are significant in the interaction profiles.
3.4 HOMO-LUMO Analysis
In a vacuum environment, the highest occupied molecular orbital (HOMO) of Pentapeptide-3 was located on the NH2 groups of the arginine residue, while the lowest unoccupied molecular orbital (LUMO) was distributed across the NH2 and CH2 groups of arginine. This HOMO-LUMO transition indicates that charge transfer within the Pentapeptide-3 in the vacuum environment occurs predominantly on the NH2 and CH2 groups of the arginine residue. In contrast, for the Pentapeptide-3 molecule in an aqueous environment, the HOMO remained on the NH2 groups of the arginine residue. However, the LUMO was located on the NH2 groups of the arginine residue, the CH2 groups of the alanine residue, the CH2 group of the proline residue, and the peptide bond between the proline and alanine residues. This suggests that the charge transfer for the Pentapeptide-3 in the aqueous environment occurs from arginine to alanine and proline residues.
The HOMO-LUMO frontier orbitals of Pentapeptide-3 calculated using TD-DFT/6-31++G(d,p) in vacuum and aqueous environments are presented in Figure 7.
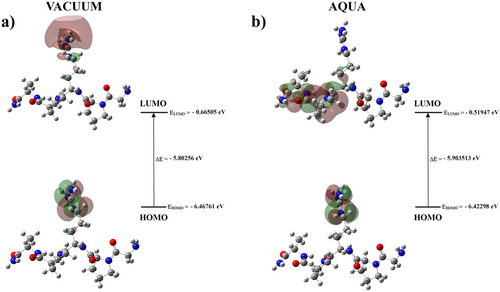
The HOMO and LUMO energies of Pentapeptide-3 in a vacuum environment are −6.46761 and −0.66505 eV, respectively. Based on these values, the energy gap between the HOMO and LUMO orbitals was calculated to be 5.80256 eV. Additionally, the ionization potential, electron affinity, electronegativity, chemical potential, and chemical hardness values of Pentapeptide-3 were derived from the HOMO and LUMO energy values, resulting in 6.46761, 0.66505, 3.56633, −3.56633, and 2.90128 eV, respectively, in the vacuum. In an aqueous media, the HOMO and LUMO energies of Pentapeptide-3 were found to be −6.42298 and −0.51947 eV. The energy gap between the HOMO and LUMO orbitals in this case was calculated to be 5.903513 eV. Furthermore, the ionization potential, electron affinity, electronegativity, chemical potential, and chemical hardness values of Pentapeptide-3 in the aqueous environment were assessed as 6.42298, 0.51947, 3.47136, −3.47136, and 2.95189 eV, respectively, utilizing the HOMO and LUMO energy values (see Table 1).
| Vacuum | TD-DFT/6-31++G(d,p) | Energy (a.u.) | Energy (eV) |
|---|---|---|---|
| HOMO energy | EHOMO | −0.23768 | −6.46761 |
| LUMO energy | ELUMO | −0.02444 | −0.66505 |
| Ionization potential | I = −EHOMO | 0.23768 | 6.46761 |
| Electron affinity | A = − ELUMO | 0.02444 | 0.66505 |
| Electronegativity | χ = (I + A)/2 | 0.13106 | 3.56633 |
| Chemical potential | μ = −(I + A)/2 | −0.13106 | −3.56633 |
| Chemical hardness | η = (I-A)/2 | 0.10662 | 2.90128 |
| Gap (ΔE) | ELUMO−EHOMO | 0.21324 | 5.80256 |
| Water | TD-DFT/6-31++G(d,p) | Energy (a.u.) | Energy (eV) |
|---|---|---|---|
| HOMO energy | EHOMO | −0.23604 | −6.42298 |
| LUMO energy | ELUMO | −0.01909 | −0.51947 |
| Ionization potential | I = −EHOMO | 0.23604 | 6.42298 |
| Electron affinity | A = − ELUMO | 0.01909 | 0.51947 |
| Electronegativity | χ = (I + A)/2 | 0.12757 | 3.47136 |
| Chemical potential | μ = −(I + A)/2 | −0.12757 | −3.47136 |
| Chemical hardness | η = (I-A)/2 | 0.10848 | 2.95189 |
| Gap (ΔE) | ELUMO−EHOMO | 0.21695 | 5.903513 |
The positions of the LUMO orbitals varied depending on the environment in which the peptide was placed. Therefore, in addition to molecular docking calculations in the vacuum, the peptide interactions in the dynamic system surrounded by water molecules were included to predict possible Interactions which depend on the dynamic variables in the system.
3.5 Molecular Docking Studies
3.5.1 Transforming Growth Factor-β1 (TGF-β Receptor-1)
The docking score obtained from the docking process of TGF-β receptor-1 (PDB: 6B8Y) with Pentapeptide-3 was −8.12 kcal/mol. Table 2 details Pentapeptide-3 interactions with TGF-β receptor-1 binding site residues and corresponding docking scores. Figure 8 also presents 2D and 3D images of Pentapeptide-3 interactions with residues in the TGF-β receptor-1 binding site.
| This study | References | ||||
|---|---|---|---|---|---|
| Ligand | Pentapeptide-3 | [83] | [84] | [85] | |
| Docking score (kcal/mol) | −8.12 | — | −10.186 | −6.755 | — |
| H-bonding interaction (Å) |
ASP290 (2.02) HIS283 (2.18) TYR282 (1.77,2.35) ILE211 (2.72) |
HIS283 (hb) TYR282 (vdw) ILE211 (pi-alkyl) |
ASP290 (3.22) (hb) TYR282 (3.06) (hb) |
HIS283 (3.18) (hb) | HIS283p (hb) |
| Aromatic H-bonding (Å) | — | — | — | — | — |
| Salt bridge(Å) | GLU245 (2.81) | — | — | — | — |
| Charged (negative) |
ASP290, GLU247 GLU245, GLU218 |
GLU245 (halogene) | — | — | — |
| Charged (positive) |
ARG294, ARG221 ARG215 |
— | — | — | — |
| Polar |
ASN293, SER287 HIS285, HIS283 SER210, THR200 |
SER287 (vdw) | — | — | — |
| Hydrophobic |
TYR295, TYR291 PHE289, TYR282 TYR249, TRP220 ILE211, PHE216 ALA202 |
TYR249 (pi-alkyl) | — | TYR249 (2.84) (hb) | — |
| Others | — |
ASP351 (hb) ALA350 (pi-alkyl) LEU340 (pi-sigma) ASN338 (hb) LYS337 (hb) GLY286 (hb) ASP281 (hb) SER280 (hb) VAL279 (vdw) LEU278 (alkil) PHE262 (vdw) LEU260 (pi-alkyl) LYS232 (pi-alkyl) VAL231 (vdw) ALA230 (pi-alkyl) VAL219 (pi-alkiy) |
GLU284 (2.98) (hb) LYS232 (3.15,3.32) (hb) VAL219 (pi-H) LYS213 (2.89,3.11) (hb) |
ASP351 (3.05) (hb) LYS232 (2.91,2.97) (hb) |
ALA350 (hydpc) LEU340 (hydpc) LYS232 (hb) VAL219 (hydpc) |
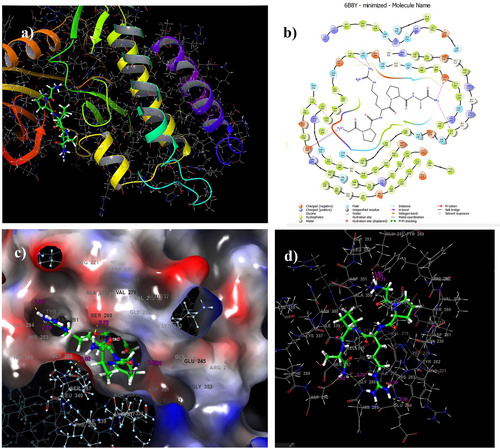
The docking study indicated that hydrogen bond interactions occurred with the amino acid residues ASP290, HIS283, TYR282, TYR249, and ILE211 of TGF-β receptor-1. Five hydrogen bonds were identified: one measured 2.02 Å with amino acid residue ASP290, another 2.18 Å with HIS283, 2.35 Å with TYR282, 1.77 Å with TYR249, and 2.72 Å with ILE211 (see Figure 8). Previous docking studies have reported varying binding energies ranging from −6.755 to −10.186 kcal/mol [84]. Thus, it can be concluded that Pentapeptide-3 exhibits a binding profile that is consistent with the literature for the 6B8Y structure.
Docking results show that Pentapeptide-3 forms a hydrogen bond with ASP290 of TGF-β receptor-1. Similarly, the ligand of Compound 14 [84] forms a hydrogen bond with this same residue in studies utilizing the same PDB code found in the literature. Additionally, Pentapeptide-3 establishes a 2.18 Å long hydrogen bond with the HIS283 residue, while Compound 18 [84] forms a slightly longer hydrogen bond of 3.18 Å with the same residue. Furthermore, the ligand D0A [83] and Compound 1 [85] also form hydrogen bonds with this residue, similar to Pentapeptide-3. Pentapeptide-3 forms two hydrogen bonds with the TYR282 residue, measuring 1.77 and 2.35 Å in length (see Table 2). Literature research indicates that Compound 14 [84] forms one hydrogen bond with this residue, measuring 3.06 Å, while D0A [83] establishes a Van der Waals interaction with the same residue. Moreover, Pentapeptide-3 has a hydrogen bond interaction with the ILE211 residue, and it was observed that D0A [83] forms a pi-alkyl interaction with this residue.
3.5.2 Tumor Necrosis Factor-α (TNF-α)
The docking score resulting from the interaction between TNF-α (PDB: 2AZ5) and Pentapeptide-3 was calculated to be −6.12 kcal/mol. Table 3 details Pentapeptide-3 interactions with TNF-α binding site residues and corresponding docking scores. Additionally, Figure 9 presents both 2D and 3D images illustrating the interactions of Pentapeptide-3 with the residues in the TNF-α binding site. Docking analysis revealed hydrogen bonding with TYR151, forming a 2.31 Å hydrogen bond.
| This study | References | |||||||
|---|---|---|---|---|---|---|---|---|
| Ligand | Pentapeptide-3 | [83] | [86] | [87] | [84] | |||
| Docking score (Kcal/mol) | −6.12 | — | −8.02 | −7.75 | −7.45 | −6.94 | −5.591 | −5.259 |
| H-bonding interaction (Å) | TYR151 (2.31) | TYR151 (pi-alkyl) | TYR151 (hb) | TYR151 (hb) | — | TYR151 (hb) | TYR151 (3.04) (hb) | TYR151 (3.06) (hb) |
| Aromatic H-bonding (Å) | — | — | — | — | — | — | — | — |
| Charged (negative) | GLU116 | — | — | — | — | — | — | — |
| Charged (positive) | LYS98, ARG32 | — | — | — | — | — | — | — |
| Polar |
GLN149, ASN31 HIS15 |
— | — | — | — | — | — | — |
| Hydrophobic |
PHE152, TYR151 VAL150 |
— | — | — | — | — | — | — |
| Others | — |
ILE155 (vdw) GLY122 (vdw) GLY121 (halogen) LEU120 (vdw) TYR119 (vdw) GLN61 (vdw) SER60 (vdw) TYR59 (vdw) ILE58 (vdw) LEU57 (vdw) LEU55 (vdw) |
GLY121 (hb) LEU120 (hb) ILE58 (hb) |
GLY122 (hb) GLY121 (hb) TYR119 (hb) GLN61 (hb) ILE58 (hb) |
GLY121 (hb) TYR119 (hb) GLN61 (hb) |
— | — | SER60 (2.68) (hb) |
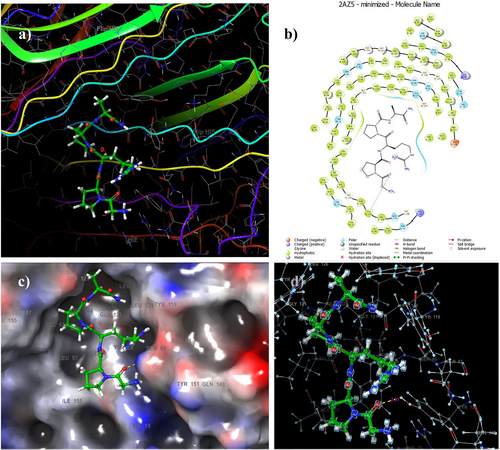
In the literature on docking studies, various binding energies have been reported, ranging from −5.259 to −8.02 kcal/mol [84, 86, 87]. It was found that Pentapeptide-3 exhibited a binding profile with TNF-α that aligns well with these findings. The docking study indicated that Pentapeptide-3 forms a 2.31 Å hydrogen bond with the TYR151 amino acid residue of TNF-α. In comparison, other studies using the same PDB code reported that the ligand Quercetin [84] establishes a 3.04 Å hydrogen bond with this residue, while the ligand Ferulic Acid [84] shows a 3.06 Å hydrogen bond interaction. Furthermore, the ligands Sarcoxacyclol A1 [86], Hesperidin [87], and Schisantherin A [87] also form hydrogen bonds with the same residue in a manner similar to Pentapeptide-3. In contrast, the ligand 307 from 4P7U [83] engages in a pi-alkyl interaction with this residue (see Table 3).
3.5.3 RAC-Alpha Serine/Threonine-Protein Kinase (AKT-1)
AKT proteins play a crucial role in regulating various cellular functions, including cell proliferation, survival, metabolism, and angiogenesis in both normal and cancerous cells. Most AKT proteins contain three main domains: an N-terminal pleckstrin homology domain, a serine/threonine-specific kinase domain, and a C-terminal regulatory domain. These proteins become phosphorylated by phosphoinositide 3-kinase (PI3K). The AKT/PI3K pathway is a vital component of numerous signaling pathways, which involve the binding of membrane-bound ligands, such as receptor tyrosine kinases, G-protein coupled receptors, and integrin-associated kinases. Aging is also associated with increased cellular apoptosis. In senescent cells, PI3K/AKT/mTOR signaling is significantly more activated than in young cells. A strong affinity for AKT enzymes emphasizes their importance in regulating the PI3K/AKT/mTOR pathway during the aging process. The interactions of Pentapeptide-3 with the residues in the binding site of AKT-1, along with the corresponding docking score energy values, are detailed in Table 4. Additionally, Figure 10 presents both 2D and 3D images illustrating the interactions of Pentapeptide-3 with the residues in the AKT-1 binding site.
| This study | References | |||||||||||||
|---|---|---|---|---|---|---|---|---|---|---|---|---|---|---|
| Ligand | Pentapeptide-3 | [83] | [88] | [89] | [90] | [91] | [92] | [93] | ||||||
| Docking score (kcal/mol) | −7.38 | — | −10.3 | −12.3 | −11.5 | −7.86 | −6.4 | −8.3 | −7.9 | −8.4 | −7.8 | −8.2 | −9.3 | −9.686 |
|
H. bonding interaction (Å) |
ASP292 (1.93) ASN279 (1.93) GLU234 (1.62) |
GLU234 (hb) (2.67) ASN279 (hb) (3.77) |
ASP292 (hydpc, 4.11, 3.99) | ASP292 (hb,2.15) | ASP292 (esc,4.16) | — | — | — | — | — | — | — | — | — |
| Aromatic H-bonding (Å) | — | — | — | — | — | — | — | — | — | — | — | — | — | — |
| Charged (negative) |
GLU441, GLU440 ASP439, ASP434 ASP292, ASP283 GLU278, GLU234 GLU228, GLU191 ASP190 |
GLU278 (hb) (2.83) |
GLU278 (esc,4.83) GLU191 (hb,2.17) |
— | GLU191 (hb,2.75) | — | — | — | — | — | — | — | — | — |
| Charged (positive) |
ARG436, LYS289 LYS276, ARG273 ARG241, ARG222 HP194, LYS189 LYS182, LYS179 LYS163, LYS158 LYS154 |
LYS179 (alkyl) (4.0) | LYS158 (hb, 3.39) | LYS158 (hb,3.39 ve 2.57) | — | — | ARG273 (hb) | ARG273 (int.) | LYS276 (hb) | — | LYS179 (hb) | — | — | LYS179 (hydpc) |
| Polar |
GLN445, THR443, THR435, THR312 THR291, ASN279 SER240, HIE238 ASN231, THR211 ASN199, THR197 THR195, THR160 |
— | — | — |
THR312 (hb, 3.0) THR160 (hb, 2.9) |
— | — | — | — | — | — | — | — | — |
| Hydrophobic |
PHE237, PHE236 LEU235, LEU202 LEU196, ALA193 VAL192, ILE186 VAL185, LEU181 ILE180, MET178 ALA177, TYR176 |
LEU181 (alkyl) (5.11) ALA177 (pi-alkyl) (3.59, 5.35) |
— | ALA177 (hydpc, 5.27) | — | — | — | — | — | — | — | — | — | ALA177 (hydpc) |
| Salt bridge (Å) | GLU234 (2.58) | — | — | — | — | — | — | — | — | — | — | — | — | — |
| Others | — |
MET281 (hb, 3.58) ALA230 (hb, 2.99 ve pi-alkyl 5.25, 4.69) GOL505 (hb, 2.58, 2.82) MET227 (pi-sulfur, 4.95) GLY162 (halogen, 3.38) GLY157 (hb,3.66) LEU156 (pi-alkyl,5.22) VAL164 (alkyl,5.28 ve pi-alkyl,5.42) |
LEU156 (hb, 2.8) | VAL165 (hydpc, 3.96) |
GLY311 (hb, 2.28) LEU295 (hydpc, 5.11 ve 4.97) |
— |
TYR326 (hb) LYS297 (hb) |
CYS310 (hb) LYS307 (hb) LYS297 (int) |
LEU295 (hb) GLY294 (hb) |
TYR229 (hb) |
LEU295 (hb) GLY294 (hb) |
— | — | — |

The docking score obtained from the docking process of AKT-1 (PDB: 4GV1) with Pentapeptide-3 was determined to be −7.38 kcal/mol. The docking study of AKT-1 and Pentapeptide-3 showed that hydrogen bond interactions occurred with the amino acid residues ASP292, ASN279, and GLU234, also glycerol molecule in the crystal structure. Upon examining the hydrogen bond interactions, a total of five hydrogen bonds were formed with glycerol which were 1.84 and 2.11 Å long, respectively. Additionally, the hydrogen bonds with residue ASP292 measured 1.93 Å, with ASN279 also at 1.93 Å, and with GLU234 at 1.62 Å. Furthermore, a salt bridge measuring 2.58 Å was observed with residue GLU234.
In the docking studies reviewed in the literature, various binding energies were observed, ranging from −6.4 to −12.3 kcal/mol [88-93]. The docking score we obtained aligns with these findings, indicating that Pentapeptide-3 has a binding profile with AKT-1. Our docking study revealed that Pentapeptide-3 forms a hydrogen bond measuring 1.93 Å with the ASP292 amino acid residue of AKT-1. Previous studies with the same PDB code reported that the Galuteolin ligand forms a hydrogen bond of 2.15 Å with the same residue, similar to Pentapeptide-3. Additionally, the Capivasertib and Linarin ligands were found to create hydrophobic and electrostatic interactions with the ASP292 residue, respectively. The docking study also showed that Pentapeptide-3 has hydrogen bond interactions of 1.93 Å with the ASN279 residue and 1.62 Å with the GLU234 residue. In comparison, AKT-1's ligand, 0XZ [83], forms hydrogen bonds measuring 3.77 and 2.67 Å with the same residues, respectively (see Table 4).
3.5.4 Mitogen-Activated Protein Kinase 14 (MAPK14)
To better understand the molecular mechanisms of aging and their roles in specific signaling pathways, we conducted a docking analysis to examine the binding energy and binding profiles of the Pentapeptide-3 to MAPK14. This assessment aimed to evaluate the peptide's activity on MAPK14, which is upregulated with age. Physiological levels of this enzyme are recognized for their active role in slowing irreversible aging and promoting longevity. The results indicated that the Pentapeptide-3 interacted with MAPK14, exhibiting a binding energy of −8.25 kcal/mol. The docking score obtained from the docking process of MAPK14 (PDB: 3ZSG) with Pentapeptide-3 indicates significant interactions. The study revealed hydrogen bond interactions with the amino acid residues LEU171, GLY170, LYS53, and TYR35.
In total, five hydrogen bonds were formed during the analysis: two with the amino acid residue LEU171 measuring 2.02 and 1.78 Å in length; one with the GLY170 residue at 1.79 Å; one with the LYS53 residue at 1.86 Å; and one with the TYR35 residue at 2.60 Å. Additionally, a salt bridge measuring 4.10 Å was observed with the GLU71 residue. Table 5 details Pentapeptide-3 interactions within the MAPK14 binding site and corresponding docking scores. Additionally, Figure 11 presents both 2D and 3D images illustrating these interactions.
| This study | References | ||||||||||
|---|---|---|---|---|---|---|---|---|---|---|---|
| Ligand | Pentapeptide-3 | [83] | [94] | [95] | |||||||
| Docking score (kcal/mol) | −8.25 | — | −7.80 | −7.22 | −8.64 | −7.61 | −8.69 | −6.28 | −8.78 | −9.26 | −8.90 |
| H-bonding interaction (Å) |
LEU171 (2.02) LEU171 (1.78) GLY170 (1.79) LYS53 (1.86) TYR35 (2.60) |
LEU171 (pi-alkil, 5.21) LYS53 (hb, 3.15) TYR35 (pi-alkil,4.15) |
— | TYR35 (arene-arene) | LYS53 (hb) | TYR35 (arene-arene) | LYS53 (hb) | LYS53 (hb) | LYS53 (hb) |
GLY170 (hb) LYS53 (hb) |
LYS53 (hb) |
| Aromatic H-bonding (Å) | — | — | — | — | — | — | — | — | — | — | — |
| Charged (negative) |
ASP168, ASP112 ASP88, GLU71 ASP43 |
— | — | — | — | — | — | — | — | — | — |
| Charged (positive) |
LYS165, LYS152 LYS76, ARG73 ARG70, ARG67 LYS54, LYS53 ARG49 |
— | — | — | — | — | — | — | — | — | — |
| Polar |
THR185, ASN159 ASN155, SER154 HIE148, ASN115 HIE107, THR106 HIE77, THR68 SER56, SER37 SER32, SER28 ASN14 |
HIS107 (hb, 3.30) THR106 (pi-sigma) |
— | — | — | — | — |
THR106 (arene-H) |
— | — | — |
| Hydrophobic |
LEU171, PHE169 LEU167, ILE166 ALA111, MET109 LEU108, VAL105 LEU104, TYR103 VAL102, ALA41 ALA40, CYS39 VAL38, TYR35 ALA34, VAL30 PRO29, LEU27 TYR24 |
PHE169 (pi-pi, 3.84) MET109 (hb, 272) LEU104 (alkyl, 5.03) VAL38 (pi-sigma, 3.82) VAL30 (pi-sigma, 3.76) |
MET109 (hb, 3.4) |
PHE169 (arene-arene) VAL38 (arene-H) |
PHE169 (arene-arene) MET109 (hb) VAL38 (arene-H) |
PHE169 (arene-arene) VAL38 (arene-H) |
PHE169 (arene-arene) MET109 (hb) VAL38 (arene-H) |
VAL38 (arene-H) |
PHE169 (arene-arene) MET109 (hb) VAL38 (arene-H) |
PHE169 (arene-arene) MET109 (hb) VAL38 (arene-H) |
PHE169 (arene-arene) MET109 (hb) VAL38 (arene-H) |
| Salt bridge (Å) | GLU71 (4.10) | ||||||||||
| Others | — |
ILE84 (alkyl, 5.03) LEU75 (alkyl, 4.85) ALA51 (pi-alkyl, 3.65) |
— | — | — | — | — | — | TYR53 (arene-arene) | TYR53 (arene-arene) | TYR53 (arene-arene) |
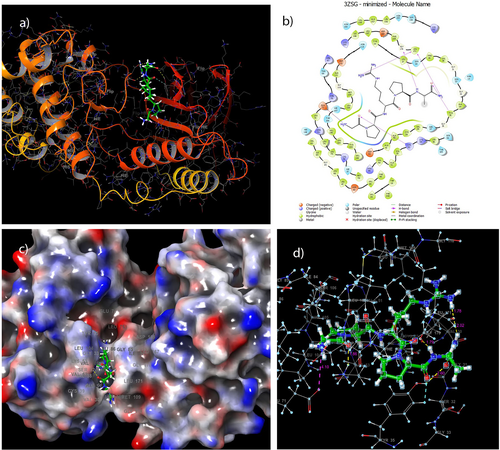
The docking studies reported in the literature indicate a range of binding energies from −6.28 to −9.26 kcal/mol [94, 95]. Our docking score aligns well with these findings, demonstrating that Pentapeptide-3 interacts with MAPK14 effectively. In our docking study, we observed that Pentapeptide-3 forms a hydrogen bond with a length of 1.86 Å with the LYS53 amino acid residue of MAPK14. In comparison, the receptor's ligand, T75 [83], forms a longer hydrogen bond of 3.15 Å with the same residue. Additionally, ligands 10a,10c, 10d, 11a, 11b, and 12d [95] also show hydrogen bond interactions with LYS53, similar to Pentapeptide-3. We also noted that Pentapeptide-3 establishes a hydrogen bond with the LEU171 residue, which correlates with T75 displaying a pi-alkyl interaction with this same residue. Furthermore, our docking study indicates that Pentapeptide-3 interacts with the TYR35 residue through a hydrogen bond. T75, its ligand, similarly exhibits a pi-alkyl interaction with TYR35, while ligands 7c and 10b demonstrate an arene-arene interaction with this residue. Finally, Pentapeptide-3's hydrogen bond interaction with GLY170 is supported by literature, which shows that the 11b ligand also forms a hydrogen bond with this residue comparably, as summarized in Table 5.
3.6 Molecular Dynamic Studies
3.6.1 Transforming Growth Factor-β1 (TGF-β Receptor-1)
The geometric structures obtained from the molecular docking analysis of Pentapeptide-3's TGF-β receptor-1 complex structure were utilized in a molecular dynamics (MD) study. In this MD study, 30 Na+ ions and 37 Cl− ions were added to the system, and 10 638 TIP3P water models were included to neutralize the TGF-β receptor-1 receptor-ligand structure. The MD simulations of the TGF-β receptor-1 and Pentapeptide-3 complex were performed for 100 ns. A close examination of the RMSD values revealed that the Cα RMSD, which is crucial for assessing the stability of the TGF-β receptor-1 structure, ranged between 1.0 and 1.7 Å. The side chain RMSD varied from 0.4 to 2.6 Å, while the Backbone RMSD, which reflects the stability of the main chain skeleton, was consistent with the Cα values. Ligand RMSD analysis showed that the “Lig fit Prot” value, which indicates the stability of the ligand in the receptor's docking region (depicted in red), fluctuated between 0.4 and 2.5 Å. The RMSD value of “Lig fit Lig,” which assesses the internal fluctuations of the ligand atoms by aligning them with the reference conformation (shown in pink), ranged from 0.1 to 1.0 Å. These changes are illustrated in Figure 12a. In the graph, the alpha-helical regions highlighted in salmon and the beta-strand regions highlighted in blue represent areas that persist in more than 47.06% of the entire simulation. Notably, the alpha-helical structures of TGF-β receptor-1 are more prevalent than the beta-strand structures. A closer examination of the RMSF graph reveals that the green vertical lines, which indicate the amino acid residues where Pentapeptide-3 interacts with TGF-β receptor-1, are predominantly found around regions 25,100, and 150. The RMSF of the protein can also be correlated with the experimental x-ray B factor (shown on the right y-axis). While a direct correspondence is not anticipated due to the differing definitions of RMSF and B-factor, the simulation results demonstrate that the RMSF values are consistent with the crystallographic data, as illustrated in Figure 12b. Additionally, the RMSF value of the ligand (L-RMSF), presented in Figure 12c, is useful for characterizing changes in the atomic positions of the ligand. The L-RMSF graph displays the fluctuations of the ligand atoms corresponding to its two-dimensional structure. This provides insights into how the ligand fragments interact with the protein and their entropic roles in the binding process. The “Fit Ligand on Protein” line, represented in red, shows fluctuations of the ligand relative to the protein, while the “Ligand” line, in pink, displays fluctuations of each atom within the ligand. These RMSF values reflect the internal atomic fluctuations of the ligand. Notably, the atoms that exhibit the most fluctuations are Oxygen atoms numbered 5, as well as Nitrogen atoms numbered 7, 8, 9, and 12.

As a result of the MD study, it was determined that the Pentapeptide-3 interacted with TGF-β receptor-1 residues through various types of bonds. It formed hydrogen bonds with residues located at residue numbers ILE211, LYS213, LYS232, GLU245, TYR249, and ASP351. Additionally, it engages in ionic bonding with residues at residue numbers GLU245, ASP290, LYS337, and ASP351. The Pentapeptide-3 also established hydrophobic interactions with residues at residue numbers ILE211, VAL219, ALA230, LEU260, and LEU340. Furthermore, it was observed that the Pentapeptide-3 engaged in water bridge interactions with residues located at ILE211, GLY212, LYS213, LYS232, GLU245, TYR249, ASP290, LYS335, LYS337, ALA350, ASP351, and LEU352. These findings are illustrated in Figure 13a. The ligand was observed to interact continuously with residue ASP290 for 100 ns, more than with other residues. It also formed multiple interactions with residues GLU245, ASP351, LYS213, and, to a lesser extent, with residues ILE211 and LYS232. These interactions are illustrated in Figure 13b. In Figure 13c, during the molecular dynamics simulation, it was noted that the residues ASP351 and GLU245 engaged with the H3N+ group of the ligand 99% and 98% of the time, respectively. Meanwhile, residues LYS213 and ASP290 interacted with the NH group at rates of 98% and 94%, respectively. Moreover, ASP290 formed interactions with the H2N+ group at 94%, respectively. Additionally, residues ILE211 formed interactions with the NH2 group at 78%, respectively. Finally, residues LYS232 and ASP351 interacted with oxygen through water molecules (H2O) at 79% and 65%, respectively.
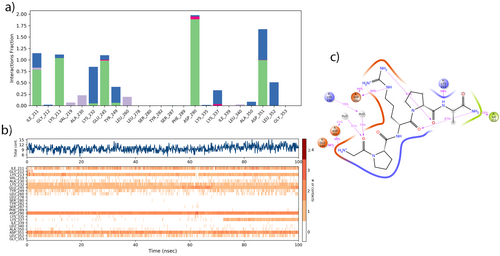
Hydrogen bonds involving ASP290, HIS283, TYR282, and ILE211, along with a salt bridge at GLU245, were confirmed in docking analysis. These findings were further validated by molecular dynamics (MD) analysis, which evaluates interactions dynamically. ASP290 interaction remained stable throughout the 100 ns simulation, with a 94% effectiveness rate. The electrostatic interaction associated with GLU245 remained highly effective, maintaining a rate of 98%. The interaction involving the ASP351 residue was identified during molecular dynamics (MD) analysis, showing a 99% interaction rate. However, this interaction was not detected at the bonding level for docking analysis. But, it was observed in residues that had close interactions during docking analysis. This same interaction was also confirmed through the results of the MD analysis.
In order to assess the temporal stability and conformational behavior of the ligand–receptor complexes, simulations of 50 and 100 ns were systematically compared across all target proteins. For TGF-β receptor-1, the RMSD value of the “Lig fit Prot” metric—which indicates the stability of the ligand within the receptor's binding pocket (visualized in red)—ranged from 1.0 to 2.8 Å during the 50 ns simulation, whereas in the 100 ns simulation it ranged from 0.4 to 2.5 Å. Similarly, the RMSD value of “Lig fit Lig,” reflecting the internal conformational fluctuations of the ligand atoms relative to their initial positions, ranged from 0.7 to 1.2 Å at 50 ns and from 0.1 to 1.0 Å at 100 ns. These results suggest that the ligand achieved slightly improved positional and conformational stability over the extended simulation period. Notably, the interacting residues between the receptor and the ligand remained largely consistent across both simulations, with the exception of LYS335, which participated in interactions at 50 ns but was not involved at 100 ns. Moreover, a comparative analysis of the 50 and 100 ns MD simulations revealed that, specifically at 50 ns, Vialox formed additional hydrogen bond interactions with TYR282, TYR283, LYS337, and ALA350 residues, as well as water bridge interactions with TYR282, GLU284, and ASN338 residues—interactions observed at 100 ns. Overall, while the numerical differences between the two simulation durations are not dramatic, the slightly lower RMSD values observed at 100 ns indicate enhanced structural stability and a more relaxed conformational state. This suggests that although a 50 ns simulation provides reasonably reliable interaction data, extending the simulation to 100 ns yields a more stable and comprehensive picture of the ligand's behavior within the binding site (Figure S1).
3.6.2 Tumor Necrosis Factor-α (TNF-α)
In the molecular dynamics (MD) study, 31 Na+ ions and 32 Cl− ions were added to the system, along with 11 224 TIP3P water models, to neutralize the TNF-α receptor-ligand structure. The analysis of the TNF-α and Pentapeptide-3 complex revealed that the RMSD of the Cα atoms ranged from 0.7 to 1.6 Å. Additionally, the side chain RMSD values varied between 1.5 and 2.6 Å, while the backbone RMSD values were consistent with those of Cα. The “Lig fit Prot” value fluctuated between 0.5 and 2.6 Å, and the RMSD value for “Lig fit Lig” ranged from 0.3 to 0.7 Å. These changes are illustrated in Figure 14a.

The beta-strand structures of TNF-α were found to be more prevalent than the alpha-strand structures. The RMSF graph shows that the green vertical lines, which represent the amino acid residues where the Pentapeptide-3 interacts with TNF-α, are primarily located in the 50th, 200th, and 250th regions as shown in Figure 14b. The simulation results indicate that the RMSF values align with the crystallographic data, as shown in Figure 14c. As a result of the molecular dynamics (MD) study, it was observed that Pentapeptide-3 formed hydrogen bond interactions with the following residues of TNF-α: SER60(A), GLN61(A), TYR119(A), GLN149(A), TYR151(A), SER60(B), GLN61(B), GLY121(B), GLY122(B) and TYR151(B). Additionally, it exhibited hydrophobic interactions with LEU57(A), TYR59(A), TYR119(A), TYR151(A), TYR155(A), LEU57(B), TYR59(B), TYR119(B), VAL123(B), and TYR151(B), LEU157(B). Water bridge interactions were noted with TYR59(A), SER60(A), GLN61(A), TYR119(A), LEU120(A), GLY121(A), GLN149(A), TYR151(A), ILE58(B), SER60(B), TYR119(B), LEU120(B), and GLY121(B). These interactions are illustrated in Figure 15a.
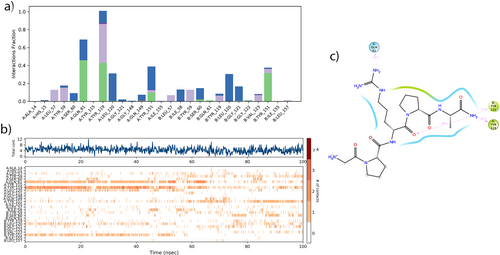
The ligand continuously interacted with TYR119(A) for 100 ns, more frequently than with other residues. Pentapeptide-3 also interacted continuously and multiple times with residues TYR119(A) and GLN61(A). It maintained a continuous interaction with residue LEU120(A) and TYR151(B) until 55 ns. Furthermore, it interacted multiple times with residue TYR151(A) for the same duration. These interactions are illustrated in Figure 15b. As shown in Figure 15c, during the MD simulation, residues TYR119(A) and GLN61(A) interacted with the NH2 group of the ligand at rates of 41% and 34%, respectively. Additionally, residue TYR151 interacted with oxygen at 31%. While only a hydrogen bond interaction with residue TYR151 was detected in the molecular docking analysis, interactions with TYR119 and GLN61, which were more dominant and effective for 100 ns, were also revealed in the MD analysis.
According to MD analyses of the TNF-α receptor complex, the RMSD value of the “Lig fit Prot” metric ranged between 1.2 and 2.8 Å during the 50 ns simulation and between 0.5 and 2.6 Å in the 100 ns simulation. Similarly, the “Lig fit Lig” RMSD value, which reflects the internal conformational fluctuations of the ligand, ranged from 0.8 to 1.2 Å at 50 ns and decreased to a narrower and lower range of 0.3 to 0.7 Å at 100 ns. These findings indicate a slightly more conformationally stable and compact state of the ligand during the extended simulation period. Although some variation in interacting residues was observed—such as the absence of GLY121(A) and LEU120(A) interactions at 100 ns that were present at 50 ns—the overall interaction profiles remained largely consistent between the two simulations. While a gradual reduction in RMSD values and interaction variability was noted at 100 ns, the absence of any dramatic structural or energetic shifts suggests that the difference in simulation time does not substantially alter the interpretation of ligand–receptor dynamics. Thus, while longer simulations may capture finer details and slightly enhanced stability, 50 ns simulations still offer a reliable and representative picture of binding behavior. Furthermore, a comparison of interaction profiles revealed that at 100 ns, Vialox established hydrogen bond interactions with SER60(A) and SER60(B), hydrophobic interactions with TYR151(A) and LEU157(B), and water bridge interactions with GLY121(A), GLN149(A), TYR151(B), ILE58(B), and SER60(B). In contrast, at 50 ns, Vialox formed hydrogen bonds with GLY121(A), GLY121(B), and LEU120(B). These subtle differences reinforce the notion that although extending the simulation time can refine interaction mapping, it does not fundamentally alter the binding characteristics observed at 50 ns (Figure S2).
3.6.3 RAC-Alpha Serine/Threonine-Protein Kinase (AKT-1)
In the molecular dynamics (MD) study, 31 Na+ and 30 Cl− ions were introduced into the system, along with 10 822 TIP3P water models, to neutralize the AKT-1 receptor-ligand complex. The analysis of the MD simulation for the AKT-1 and Pentapeptide-3 complex revealed that the root-mean-square deviation (RMSD) values for the Cα atoms ranged between 1.0 and 2.7 Å. The side chain RMSD values varied from 1.5 to 3.5 Å, while the backbone RMSD aligned closely with the Cα values.
Ligand RMSD analysis in the AKT-1 binding site showed that the “Lig fit Prot” value ranged from 0.6 to 3.0 Å, while the “Lig fit Lig” RMSD varied from 0.5 to 2.0 Å. These changes are illustrated in Figure 16a. It was observed that the alpha-helical structures of AKT-1 were maintained over more regions compared to the beta-strand structures. A closer inspection of the root-mean-square fluctuation (RMSF) graph indicates that the green vertical lines, representing the amino acid residues where Pentapeptide-3 interacts with AKT-1, are most prominent in region 150. The simulation results show that the RMSF values align well with the crystallographic data, as depicted in Figure 16b. The atoms exhibiting the most fluctuations are the oxygen atom numbered 5, as well as the nitrogen atom numbered 13 (see Figure 16c).
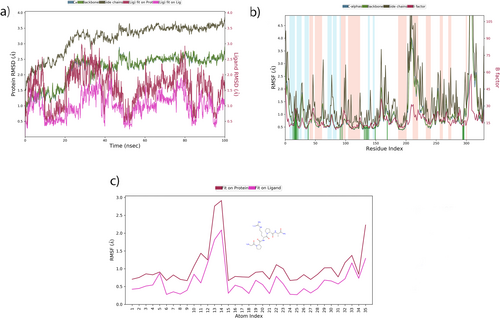
The molecular dynamics (MD) study showed that Pentapeptide-3 engages in various interactions with the residues of AKT-1: it formed hydrogen bonds with residues LYS158, VAL164, GLU234, LYS276, GLU278, ASN279, ASP292, and ASP439; engages in hydrophobic interactions with residues VAL164, LEU181, PHE237, MET281, and PHE438; participates in ionic interactions with residues GLU234, GLU278, and ASP439; and establishes water bridge interactions with residues LEU156, LYS158, THR160, PHE161, GLY162, GLU234, ASP274, GLU278, ASN279, ASP292, TYR437, and ASP439. These interactions are detailed in Figure 17a.
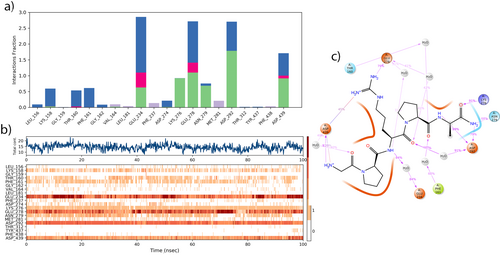
It was observed that the Pentapeptide-3 interacted continuously with residues ASP292, GLU278, and GLU234 for 100 ns, more than with other residues. It also had continuous and multiple interactions with residues GLU234, GLU278, ASP292, ASP439, ASN279, and LYS158. Furthermore, it maintained continuous interactions with residues PHE161 and THR160 as shown in Figure 17b. During the molecular dynamics (MD) simulation, ASP292 interacted with the NH, NH2 groups at rates of 99% and 79%, respectively. Residue ASN279 interacted with NH2 group for 68% of the time. Addditionally residue LYS276 interacted with oxygen for 91% of the time. GLU234 and GLU278 exhibited interactions with NH over H2O at rates 84%, 41% respectively. ASP439 formed salt bridge interaction with H2N+ and H3N+ groups at rates of 45%, 30%, respectively. Residue LYS276 interacted with oxygen for 91% of the time. Moreover, ASP292, PHE161, ASP439, GLU278, and THR160 interacted with oxygen over H2O at rates 60%, 60%, 40%, 41%, 42%, respectively as illustrated in Figure 17c. The docking analysis results indicated interactions among ASP292, ASN279, and GLU234, with Pentapeptide-3, exhibiting the shortest hydrogen bond, indicating the strongest interaction. However, interactions with ASP292, GLU278, and ASP439, which are as effective as GLU234, were also detected as a result of the MD analysis. An electrostatic interaction with GLU234 was found during the docking analysis. Furthermore, molecular dynamics analysis revealed that interactions with GLU278 and ASP439 also demonstrated similar electrostatic effects. Interactions such as additional hydrogen bonds with LYS276, GLU278, and ASP439, along with hydrophobic interactions like LEU181, VAL164, PHE237, and MET281, which were not detected in the docking analysis, were revealed through MD analysis. According to MD analyses of the AKT-I receptor complex, the RMSD value of the “Lig fit Prot” metric ranged from 0.8 to 3.6 Å during the 50 ns simulation and decreased slightly to 0.6–3.0 Å in the 100 ns trajectory. Likewise, the “Lig fit Lig” RMSD, which gauges internal conformational fluctuations of the ligand, spanned 0.4–2.3 Å at 50 ns and narrowed modestly to 0.5–2.0 Å at 100 ns. These values point to moderate internal motion and suggest that, although both simulations capture dynamic ligand behavior, the extended 100 ns run confers a marginal improvement in positional stability within the binding pocket. Interaction profiles were largely conserved across both simulations; however, ASP274 and LYS158—engaged at 50 ns—were no longer involved at 100 ns (see Figure S3b,e). Despite such minor shifts, no dramatic structural or energetic changes emerged, indicating that simulation length does not fundamentally alter the ligand–receptor binding characteristics. The slightly reduced fluctuation range at 100 ns nonetheless hints at a more refined equilibrium conformation, underscoring the value of longer trajectories for capturing subtle stabilization phenomena. A closer comparison of specific contacts corroborates this conclusion. At 100 ns, Vialox uniquely displayed hydrophobic interactions with PHE438 and ionic interactions with THR160. By contrast, at 50 ns the ligand formed hydrogen bonds with LEU156, hydrophobic contacts with PHE161, ionic interactions with ASP292, and water-bridge interactions with GLU191 and LYS276. These nuanced differences reinforce that, while 50 ns simulations provide a reliable snapshot of binding dynamics, extending the simulation to 100 ns affords a slightly more comprehensive and equilibrated depiction without revealing any transformative changes (Figure S3).
3.6.4 Mitogen-Activated Protein Kinase 14 (MAPK14)
In the molecular dynamics (MD) study conducted, 38 Na+ and 34 Cl− ions were added to the system, and 12 224 TIP3P water models were used to neutralize the MAPK14 receptor-ligand structure. MD analysis of the MAPK14-Pentapeptide-3 complex showed that the RMSD of Cα atoms ranged from 1.0 to 2.7 Å. Additionally, the side chain RMSD values varied between 1.5 and 3.6 Å, while the backbone RMSD values were consistent with the Cα RMSD values. The “Lig fit Prot” values ranged from 1.3 to 3.2 Å, and the RMSD values for “Lig fit Lig” were between 0.5 and 1.6 Å. These changes are illustrated in Figure 18a.
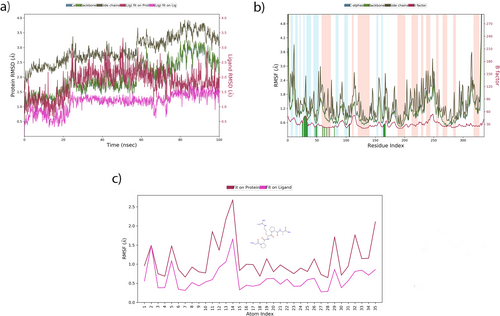
The alpha-helical structures of MAPK14 were found to be more prevalent than the beta-strand structures. A detailed examination of the RMSF graph reveals that the green vertical lines, which represent the amino acid residues where Pentapeptide-3 interacts with MAPK14, primarily appear in region 30. The simulation results indicate that the RMSF values align well with the crystallographic data, as illustrated in Figure 18b. The atoms that exhibited the most fluctuations were the oxygen atom numbered 5, along with nitrogen atoms numbered 11 and 12 as shown in Figure 18c.
The molecular dynamics (MD) study determined that Pentapeptide-3 formed hydrogen bonds with the residues VAL30, SER32, TYR35, GLY36, LYS53, and GLU71, as well as with residues ASP168, GLY170, and LEU171. Additionally, Pentapeptide-3 displays hydrophobic interactions with residues VAL38, ALA51, LEU75, and ILE84, along with MET109, PHE169, and LEU171. Pentapeptide-3 also engaged in ionic interactions with residues ALA34, TYR35, LYS53, HIS64, ARG67, and GLU71, as well as with ASP168. Furthermore, it was observed to participate in water bridge interactions with VAL30, SER32, ALA34, TYR35, GLY36, LYS53, LYS54, HIS64, GLU71, MET109, GLY110, ASP168, PHE169, and LEU171, as shown in Figure 19a.
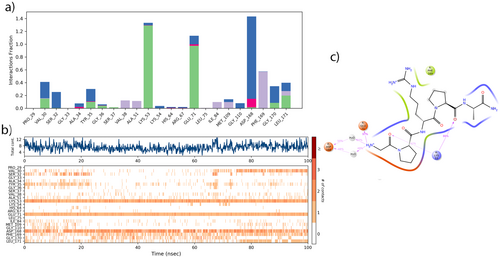
The Pentapeptide-3 was observed to interact continuously with the ASP168, GLU71, LYS53 residues for 100 ns, more frequently than with any other residues. Additionally, it showed continuous interactions multiple times with ASP168, PHE169, LEU171, and GLY170 residues. A detailed examination of the interactions between the ligand and the protein residues revealed that interactions constituting more than 20.0% of the simulation time in the selected trajectory are shown in Figure 19b. During the MD simulation, it was noted that the GLU71 residue interacted with the Pentapeptide-3's H3N+ at a rate of 97%. The ASP168 residue had interactions with H3N+ over H2O at rates of 50% and 48%, while the LYS53 residue interacted with oxygen at rates of 86% and 42%, as illustrated in Figure 19c. The docking analysis revealed a compelling interaction, with two hydrogen bonds forming with the LEU171 residue and additional bonds established with GLY170, LYS53, and TYR35. These critical connections significantly enhance docking to the receptor's binding site, underscoring the strength of this interaction. An electrostatic interaction between GLU71 and the NH3 group was also effective in the docking analysis. In the MD analysis, the same group interaction with GLU71 remained effective throughout the majority of the simulation, at 97%. Both hydrogen bonding and electrostatic interactions were present with GLU71. In the MD analysis, the hydrogen bond interactions observed during the simulation were most active with the LYS53 and GLU71 residues. Meanwhile, the interactions with LEU171 and TYR35, which had been significant during the docking analysis, kept their effectiveness throughout the MD analysis. The hydrophobic effect of PHE169 was especially noticeable in the molecular dynamics analysis.
According to MD analyses of theMAPK14 receptor complex, the RMSD value of the “Lig fit Prot” metric—which reflects the stability of the ligand within the receptor's docking site (visualized in red) fluctuated between 0.8 and 3.2 Å during the 50 ns simulation and between 1.3 and 3.2 Å in the 100 ns simulation. Similarly, the RMSD value of “Lig fit Lig,” which assesses the internal conformational fluctuations of the ligand relative to the reference structure, ranged from 0.6 Å to 1.6 Å at 50 ns and from 0.5 to 1.6 Å at 100 ns. These results indicate comparable levels of conformational stability across both simulation durations, with only minor differences in fluctuation ranges. The slightly elevated lower-bound RMSD in the “Lig fit Prot” metric at 100 ns may reflect an early conformational adjustment followed by stabilization. Importantly, the same key residues were involved in receptor–ligand interactions in both simulations, indicating a consistent binding pattern over time. Overall, no significant deviations or dramatic conformational changes were observed, suggesting that both 50 and 100 ns simulations effectively capture the stable and reproducible binding behavior of Vialox with the MAPK14 receptor. Further comparison of specific interaction profiles revealed that at 100 ns, Vialox uniquely formed a hydrogen bond with the SER37 residue and exhibited ionic interactions with HIS64 and GLY36 for 50 ns MD simulation. Conversely, at 100 ns, the ligand engaged in hydrophobic interactions with VAL30, TYR35, and LEU75, as well as water bridge interactions with SER37 and PHE169. While these differences highlight the dynamic nature of ligand–receptor contacts over time, they do not represent major shifts in binding mode or affinity. Therefore, although the 100 ns simulation provides additional detail and slightly enhanced resolution of interaction dynamics, the overall binding behavior remains consistent and stable across both simulation durations (Figure S4).
3.7 ADME Analysis
The Qik-Prop module of the Schrödinger program played a crucial role in evaluating drug similarities within macromolecular structures derived from the docking analysis of the Pentapeptide-3 and its receptors. This tool assesses how closely the drug candidate aligns with 95% of existing drugs and predicts molecular properties critical to its efficacy. In line with Lipinski's rules, the Qik-Prop module employs key parameters including the number of hydrogen bond donors (ranging from 0 to 6), hydrogen bond acceptors (2 to 20), molecular weight (130.0 to 725.0), and the octanol/water partition coefficient logP (−2 to 6.5)—to assess drug performance comprehensively.
ADME analysis of each receptor-Pentapeptide-3 complex revealed a molecular weight of 495.581 g/mol, demonstrating adherence to Lipinski's rule of five, a critical benchmark for evaluating drug viability. Additionally, based on the results of the ADME analysis, the LogP octanol–water partition coefficients, which indicate the lipophilicity of the compounds, are consistent with Lipinski's rules.
The coefficients are as follows: −4.098 for TGF-β receptor-1-Pentapeptide-3, −3.990 for TNF-α-Pentapeptide-3, −4.033 for AKT-1-Pentapeptide-3, and −4.189 for MAPK14-Pentapeptide-3. Regarding the skin permeation rates of these complexes, they were estimated to be −10.587 cm/h for TGF-β receptor-1-Pentapeptide-3, −9.712 cm/h for TNF-α-Pentapeptide-3, −9.762 cm/h for AKT-1-Pentapeptide-3, and −10.543 cm/h for MAPK14-Pentapeptide-3 (see Table 6). The skin permeation rates of these complexes were estimated as −10.587 cm/h for TGF-β receptor-1-Pentapeptide-3, −9.712 cm/h for TNF-α-Pentapeptide-3, −9.762 cm/h for AKT-1-Pentapeptide-3, and −10.543 cm/h for MAPK14-Pentapeptide-3. These skin permeation values suggest that Pentapeptide-3 may be suitable for topical application. Moreover, IC50 values of HERG K+ channel blockage, which is related to cardiac effect mechanisms, have been estimated as 1.229 for TGF-β receptor-1-Pentapeptide-3, 1.534 for TNF-α-Pentapeptide-3, 1.480 for AKT-1-Pentapeptide-3, 1.093 for MAPK14-Pentapeptide-3. The values obtained are within the safe range and do not cause toxicity in terms of cardiac disorders. Based on the predicted data, the number of hydrogen bond donors and acceptors affecting the passive diffusion of drugs through cell membranes during absorption and distribution was estimated as 8.5 for hydrogen bond donors and 15 for hydrogen bond acceptors. The numbers of hydrogen bond acceptors and donors are in accordance with Lipinski's rules, indicating that our drug candidate can demonstrate oral bioavailability. This compliance underscores the potential of our drug candidate, positioning it favorably for further development and testing in the pharmacological landscape.
| Receptors | |||||
|---|---|---|---|---|---|
| TGF-β receptor-1 | TNF-α | AKT-1 | MAPK14 | ||
| Property | 6B8Y | 2AZ5 | 4GV1 | 3ZSG | Recommended |
| Docking score (kcal/mol) | −8.12 | −6.12 | −7.38 | −8.25 | |
| Molecular weight MW (g/mol) | 495.581 | 495.581 | 495.581 | 495.581 | (130.0/725.0) |
| Solute total SASA | 816.483 | 779.828 | 782.164 | 819.926 | (300.0/1000.0) |
| Solute hydrophobic SASA | 480.609 | 491.443 | 491.046 | 486.403 | (0.0/750.0) |
| Solute hydrophilic SASA | 335.875 | 288.385 | 291.117 | 333.523 | (7.0/330.0) |
| Solute as donor-hydrogen bonds | 8.500 | 8.500 | 8.500 | 8.500 | (0.0/6.0) |
| Solute as acceptor-hydrogen bonds | 15.000 | 15.000 | 15.000 | 15.000 | (2.0/20.0) |
| Solute ionization potential (eV) | 8.225 | 7.453 | 7.354 | 8.248 | (7.9/10.5) |
| Solute electron affinity (eV) | −0.362 | −0.455 | −0.407 | −0.225 | (−0.9/1.7) |
| Polarizability (Angstroms3) | 47.235 M | 45.197 M | 45.096 M | 46.643 M | (13.0/70.0) |
| QP logP for hexadecane/gas | 16.903 M | 16.015 M | 16.027 M | 16.806 M | (4.0/18.0) |
| QP logP for octanol/gas | 37.142 M | 39.970 M | 36.987 M | 36.893 M | (8.0/35.0) |
| QP logP for water/gas | 35.170 M | 33.911 M | 32.750 M | 33.786 M | (4.0/45.0) |
| QP logP for octanol/water | −4.098 | −3.990 | −4.033 | −4.189 | (−2.0/6.5) |
| QP logS for aqueous solubility | 0.621 | 0.685 | 0.127 | 0.037 | (−6.5/0.5) |
| QP logS—conformation independent | 1.118 | 1.118 | 1.118 | 1.118 | (−6.5/0.5) |
| QP logK hsa serum protein binding | −2.324 | −2.363 | −2.377 | −2.377 | (−1.5/1.5) |
| QP logBB for brain/blood | −3.402 | −2.755 | −2.807 | −3.454 | (−3.0/1.2) |
| No. of primary metabolites | 9 | 10 | 10 | 9 | (1.0/8.0) |
| Predicted CNS activity (−− to ++) | — | — | — | — | |
| HERG K+ channel blockage: log IC50 | 1.229 | 1.534 | 1.480 | 1.093 | (concern below −5) |
| Apparent Caco-2 permeability (nm/s) | 0 | 1 | 1 | 0 | < 25 poor > 500 great |
| Apparent MDCK permeability (nm/s) | 0 M | 1 M | 1 M | 0 M | < 25 poor > 500 great |
| QP log Kp for skin permeability | −10.587 | −9.712 | −9.762 | −10.543 | (Kp in cm/h) |
| Jm. max transdermal transport rate | 0.000 | 0.000 | 0.000 | 0.000 | Micrograms/cm2/h |
| Lipinski rule of 5 violations | 2 | 2 | 2 | 2 | (maximum is 4) |
| Jorgensen rule of 3 violations | 2 | 2 | 2 | 2 | (maximum is 3) |
| %Human oral absorption in GI (+−20%) | 0 | 0 | 0 | 0 | (< 25% is poor) |
4 Conclusion
This study thoroughly investigated the structural properties of Pentapeptide-3 (Vialox) and its potential interactions with biological targets. The anti-aging effects of this peptide have been demonstrated in various studies using in vitro and in vivo methods. The research employed a combination of theoretical, experimental, and in silico approaches. DFT-based quantum chemical calculations, spectroscopic analyses (FTIR, ATR-FTIR, and Raman), and molecular modeling studies (molecular docking, molecular dynamics simulations, and ADME analyses) demonstrated that Pentapeptide-3 can significantly interact with key biomolecular targets (TGF-β receptor-1, MAPK14, AKT-1, and TNF-α) involved in skin aging. HOMO-LUMO analyses provided essential information about the chemical reactivity of the molecule, and it was determined that HOMO orbitals are concentrated on the arginine residue. In contrast, LUMO orbitals were found to be distributed among arginine, proline, and alanine residues, depending on the environmental conditions. This situation revealed the electron transfer potential of Pentapeptide-3, highlighting its ecological sensitivity and ability to interact with various target sites. The HOMO-LUMO energy gap of 5.80 eV (vacuum) and 5.90 eV (aqueous medium) indicates the stability of the molecule and its low chemical reactivity. HOMO and LUMO regions have been identified as possible receptor-interacting regions for molecular docking analysis.
MEP maps were effective in defining potential binding areas by determining electrostatically rich and poor regions, and these were found to be compatible with the docking analysis results. Molecular docking analyses revealed that pentapeptide-3 exhibited strong and specific binding to four biological targets that play a critical role in the aging process. High binding energies were obtained with TGF-β receptor-1 (−8.12 kcal/mol) and MAPK14 (−8.25 kcal/mol) receptors, while significant binding was observed with TNF-α (−6.12 kcal/mol) and AKT-1 (−7.38 kcal/mol) targets. It was determined that pentapeptide-3 interacted with TGFβ receptor-1 via hydrogen bonds at key binding sites, including ASP290, HIS283, TYR282, and ILE211, and with MAPK14 via LEU171, GLY170, LYS53, and TYR35. The binding profile observed, especially with the TGF-β receptor-1, was quite substantial when compared to reference ligands in the literature.
Molecular dynamics (MD) simulations are crucial for determining whether the static binding profiles obtained from docking studies are maintained over time. The RMSD and RMSF values observed in the TGF-β receptor-1 pentapeptide-3 complex for 100 ns showed that the peptide remained stable in the binding site, providing high interaction continuity, especially with residues such as ASP290, GLU245, and ASP351. The hydrogen and ionic bonds, which account for over 90%, indicate that the peptide has a strong interaction profile in dynamic environments. The intrinsic flexibility of the peptide and its stability in the binding site suggest that the molecule can maintain its activity in biological environments.
Vibrational spectra were detailed both theoretically and experimentally. In the analyses performed on 210 vibrational frequencies, theoretical wavenumbers were compared with experimental FTIR, ATR-FTIR, and Raman data; especially characteristic vibrations belonging to functional groups such as NH, CO, CH, and CNH were successfully assigned. PED analysis supported the spectral interpretations of these vibrational modes, enabling a detailed identification of vibrational components associated with each amino acid residue. The high correlation between the spectroscopically obtained IR and Raman peaks and theoretical values strengthened the accuracy of the modeling. When evaluating these comprehensive findings together, it can be concluded that Pentapeptide-3 functions not only as a neurotransmitter inhibitor against acetylcholine receptors but also as a multifunctional anti-aging agent. It targets cellular signaling pathways associated with aging, including TGF-β receptor-1, MAPK14, TNF-α, and AKT-1.
These findings suggest that Pentapeptide-3 may be effective not only as a neurotransmitter inhibitor but also through various mechanisms, including antioxidant defense, inflammation regulation, and cell regeneration. The relationship between this peptide, which is primarily known for its anti-wrinkle effects in the literature, and cellular signaling pathways at the biomolecular level has been revealed in detail for the first time in this study. Thus, the study provides an original contribution to the existing literature on the activities of cosmeceutical peptides at the molecular target level. Pentapeptide-3 is also a multifunctional cosmeceutical peptide with the potential to be effective against targets directly related to aging mechanisms, including cellular stress, inflammation, matrix degradation, and cell death. With its structural stability, low toxicity potential, broad target spectrum, and high binding stability, pentapeptide-3 is an essential candidate for cosmeceutical and therapeutic applications.
Future studies should investigate whether different derivatives or structural modifications of Pentapeptide-3 exhibit higher binding efficiency. Additionally, it is important to elaborate on its interactions with various target proteins and binding modes. A detailed investigation of pharmacokinetic and pharmacodynamic parameters, including delivery mechanisms to target tissues and long-term safety profiles, is also necessary. Furthermore, evaluating its biological activity, conducting efficacy-safety studies, and performing bioavailability analyses will enhance the versatile potential of the peptide, allowing for its assessment as an innovative agent in both therapeutic and cosmeceutical applications.
Acknowledgments
This work was supported by the Scientific Research Projects Coordination Unit of Istanbul University [FYL-2023-40218, ÖNAP-2423]. Authors are thankful to the Schrödinger team for providing technical support in using Schrödinger's Small-Molecule Drug Discovery Suite and Desmond Suite.
Open Research
Data Availability Statement
The data that supports the findings of this study are available in the Supporting Information of this article.


