Feasibility study of a multi-lesion cyberknife radiotherapy plan verification method using a 2D array with pre-set roll angles
Abstract
Background
When validating intracranial multi-lesion CyberKnife M6/S7 plans with SRSmapcheck, setting the array to a fixed 0° measures only one target dose distribution, leaving the other lesions unmeasured. Moreover, the CyberKnife treatment planning system does not support roll verification tools, and testing confirms that X-sight fiducial marker guidance is incompatible with free array roll. A novel method and workflow are required to validate multi-lesion plans with random positions.
Methods
A geometric model was established based on the relationship between SRSmapcheck and the tumor location. For two tumors spaced 77 mm apart (each 20 mm in diameter, or one 40 mm apart and the other infinitesimally small), the corresponding array roll angle interval was approximately 15.05°. The SRSmapcheck and StereoPHAN computed tomography (CT) images were acquired at 15° intervals, starting at 0°, and preprocessed into phantom plans for verification. A total of 101 intracranial multi-lesion plans were verified using the fixed 0° and pre-set roll angle methods to optimize the dose distribution, particularly in high-dose and rapidly varying areas. A two-sample test compared the results of the 0° versus pre-set roll angle verification and assessed the performance under different criteria to determine suitable criteria for pre-set roll angle verification.
Results
The equivalent diameter of the 296 tumors ranged from 5 to 45 mm (average: 21.86 mm). Each plan had an average of 2.97 lesions. Using the pre-set roll angle method, 2.34 targets were assessed on average (89.83% of lesions had diameters ranging from 10 to 40 mm), compared to 1.32 targets on average in 0° plans. Statistically significant differences occurred at 2 mm/1% and 2 mm/2% in the γ analysis, showing that plan pass rates were stable between the fixed 0° and pre-set roll angle methods. Relaxing either the distance to agreement or dose deviation significantly increased the pass rates during pre-set roll angle verification, whereas cross-transforming criteria had minimal impact. For pre-set roll angle methods, it is recommended to use 1 mm/1% (action limit: 86.0%±13.3%) and 1 mm/2% (action limits: 91.6%±7.9%) for γ analysis.
Conclusion
SRSmapcheck with the pre-set roll angle method can verify intracranial multi-lesion CyberKnife plans by measuring multiple targets in a single validation and comparing the 1 mm/1% and 1 mm/2% γ analysis criteria.
1 INTRODUCTION
Brain metastases develop in 10–26% of patients diagnosed with solid tumors and, among those affected, multiple metastases occur in 70–80% of cases.1-3 Stereotactic radiosurgery (SRS) has demonstrated excellent local control while preserving cognitive function and quality of life.4-6 Consequently, SRS has emerged as a standard of care for patients with one to three metastases, and numerous centers have investigated its application in patients with more than three metastases.7-9 A prospective observational trial demonstrated no decrease in survival or increase in local recurrence or toxicity in patients treated for two to four versus five to ten brain metastasis.10 Such SRS plans typically require the use of a CyberKnife M6/S7 equipped with a high-precision multi-leaf collimator (MLC).11 MLC-based SRS plans require rigorous pre-treatment plan validation.12 The irradiation angle of the CyberKnife distribution is approximately 4π, differing from that of a linear accelerator.13 The SRSmapcheck 2D array is used for verification within the StereoPHAN at a fixed 0° roll angle at the authors’ institution. However, multi-lesions often exhibit irregular spatial distributions and using a 2D array at this angle typically allows for the effective measurement of only one or two lesions. If a 2D array with a pre-set roll angle could measure target areas outside the horizontal plane, it would enable dose distribution measurements for multiple targets in a single verification. For CyberKnife treatment planning systems that do not allow the adjustment of the image roll angle in phantom plans, the experimental results indicate that the approach recommended by SunNuclear for validating target areas distributed outside the horizontal plane is not feasible. Therefore, establishing targets in off-horizontal regions of interest (ROIs) may require an alternative workflow.
To enhance the verification capability of CyberKnife MLC plans to address the complexities associated with the random distribution of target locations in multi-lesion SRS, this study aims to refine the verification method by leveraging the existing SRSmapcheck and StereoPHAN systems. The proposed approach aims to expand the measurement range and improve the quality control of multi-lesion SRS plans.
2 METHODS
2.1 Test equipment
A Philips Brilliance (Philips, Eindhoven, NL) Big Bore Computed Tomography (CT) system was used for image acquisition. A CyberKnife (Accuray Inc., Sunnyvale, CA, USA) M6 C0521 was equipped with fixed aperture cones and a MLC.14 The treatment planning system (TPS) and transmission network were the Precision v1.1 and Accuray networks. This study employed Monte Carlo (MC) algorithms for the dose calculation.15-18 SRSmapcheck (SunNuclear, Melbourne, FL, USA) was used as a verification tool in conjunction with StereoPHAN, which featured an adjustable horizontal base and two blocks. A horizontal ruler was employed to verify the roll angle of SRSmapcheck.
2.2 Geometric model of the position relationship between the 2D array and double lesions
A highly practical approach would be to avoid scanning a set of 2D array images for each plan. However, this study adopted a more reasonable strategy where an appropriate roll angle interval was set based on the size of the common brain tumors. In this case, the lesions were simplified as regular spheres. As illustrated in Figure 1(a), the dose calculation level was situated at the center of the double-layer detector.19 The desired 2D array roll angle interval corresponded to different lesion sizes, as shown in Figure 1(b). In the scenario depicted in Figure 1(c), the target doses of the two lesions were acquired by adjusting the position of the 2D array. However, when the array was configured as shown in Figure 1(d), it could not measure another lesion after relocation. Figure 1(d) shows the maximum roll angle interval capable of measuring tumors A and B. The geometric transformation related to the dose calculation level and tumor, as illustrated in Figure 1(e), was derived accordingly. Under these conditions, the maximum roll angle interval was determined according to the criteria shown in Figures 1(d) and (e).

Correspondence between the lesions and suitable roll angle interval of the 2D array.
Note: During the verification process, SRSmapcheck was rolled to isolate the target area, thereby enabling direct measurement of the dose distribution within and around the target.
In Formula (1):
is the required roll angle interval;
A and B are the diameters of the lesions;
77 is the width of the SRSmapcheck 2D array, with a unit of mm.
SRS plans are primarily employed for treating tumors with diameters < 40 mm that are commonly distributed at 20 mm.20 Ensuring accurate dose distribution at the SRSmapcheck detector array level requires the selection of an appropriate rolling angle interval to account for the random positions and varying sizes of the tumors. In this study, an extreme scenario was considered: both tumors were 20 mm in diameter or one tumor was 40 mm while the other was nearly infinitesimal. According to Formula (1), , thus θ < 15.05°, rounded to 5°, such as 15, 10 or 5°. In this study, a 15° interval was selected for testing, while considering the demands of image scanning, image segmentation, and planning. If the target area is smaller, the value of “A + B” should be proportionally reduced, thereby resulting in a correspondingly smaller angular interval.
2.3 Image acquisition and pre-processing
The StereoPHAN was positioned at the front of the CT couch, with its head protruding from the head of the couch. Subsequently, the SRSmapcheck and solid water fillers were placed, and both StereoPHAN and SRSmapcheck were adjusted horizontally using a horizontal ruler and lasers in the CT room. To minimize the artifacts caused by high-density components, chest scan conditions were employed. The scanning range was extended from 2 cm in front of the StereoPHAN head to the posterior of the base, utilizing a 1 mm layer thickness. Subsequently, the StereoPHAN was adjusted to the next pre-set roll angle, and scans were repeated until all angles were utilized. The SRSmapcheck image obtained through CT scanning was labeled based on the pre-set roll angle and “cot” of the intermediate value between two adjacent angles for each roll angle. Images obtained at different roll angles are shown in Figure 2.
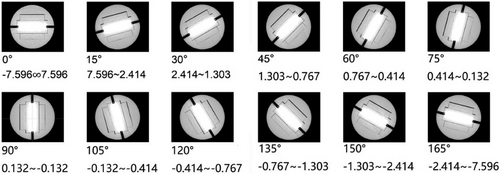
CT images of the 2D array obtained at various pre-set roll angles.
Note: In the CyberKnife TPS, the distance from the center of each tumor to the foot of the vertical guideline was measured using the length measurement tool and horizontal/vertical guidelines, thereby obtaining the “cot” result. This result was then compared with the numerical ranges provided below each roll angle image in the figure, and roll angles within the specified range were selected.
Subsequently, the CT images were reconstructed and contoured in the CyberKnife TPS for dose calculation and alignment, specifically focusing on the array and central detector structures. Essential CT images obtained from SunNuclear were used to aid in contour construction.
2.4 Preparation, irradiation, and comparison of plan verification
The distance between the two lesions should not exceed 77 mm, which was measured using the distance tool in the CyberKnife TPS. In addition, the spacing between different layers was calculated based on the thickness and number of layers in the CT image. The SRSmapcheck image with the corresponding pre-set roll angle was loaded onto the phantom plans.
StereoPHAN and SRSmapcheck were positioned at the head of the CyberKnife couch with the base set in a horizontal orientation. The StereoPHAN was then adjusted to match the angle specified in the phantom plan, and the roll angle was verified using the indicator depicted in Figure 3. The X-sight tool was employed to track the fiducials within the array and correct any positional or angular deviations. Subsequently, the array was irradiated according to the phantom plan, and the resulting output dose was recorded. The calculated flux in the plan was compared with the measured results, as shown in Supplementary Figure S1.
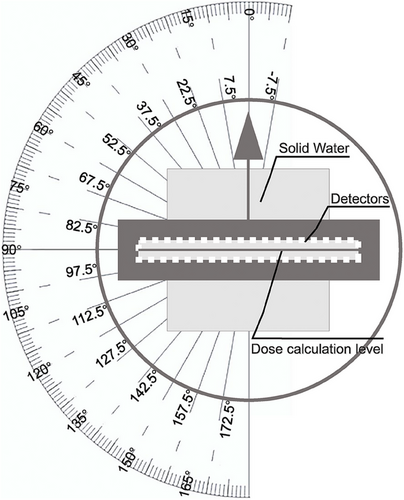
Angle indicator for the CyberKnife TPS and “SRSmapcheck+StereoPHAN” system.
Note: From the rear of the StereoPHAN, specifically at the SRSmapcheck insertion position, forward observations were used to verify the accuracy of the array roll angle.
This study specifically focused on analyzing the dose distribution within a high-dose area. A total of 101 cases of MLC-based multi-lesion plans were selected, and verification plans using the pre-set roll angle and the fixed 0° methods were generated and validated. The positioning of the array was optimized to maximize measurement of the lesions and target areas. The flux distribution at the dose calculation level was obtained, and the two methods were validated and compared under identical conditions. The outcomes of plan validation were recorded in detail.
The pass rates of the pre-set roll angle and fixed 0° methods were compared using Gamma (γ) analysis criteria of 1 mm/1%, 1 mm/2%, 2 mm/1%, and 2 mm/2% as well as the dose deviation (DD) within 1–3%. The comparison was performed in the absolute dose mode, with a threshold set at 10% and a scaling factor set at 1.0, as shown in Supplementary Figure S2. Angular correction was applied and spatial offsets were calculated.
2.5 Comparison of verification methods
It was determined whether the pre-set roll angle method yielded pass rates similar to those of the fixed 0° method to confirm its feasibility. The pass rate consistency was evaluated under various criteria to identify stable settings for the pre-set roll angle method.
2.6 Statistical analysis
A double-sample t-test was conducted to assess the validation method differences. The steps were as follows:
2.6.1 Statistical significance test
α = 0.05 was set. If P < 0.05, there was a statistically significant difference in the mean pass rates between the two verification methods. If P ≥ 0.05, the difference may have been due to random variation, but it could not be inferred that the means of the two groups were the same, and the risk of Type II errors (such as reduced test power due to an insufficient sample size) should be considered.
2.6.2 Comparison criteria screening
Comparison of the fixed 0° and pre-set roll angle validation methods: The pass rates of the two methods were compared through a two-sample t-test to determine the criteria with no significant differences (P ≥ 0.05).
Analysis of the roll angle criteria stability: Two-sample t-tests were conducted for each pair of comparison criteria in the pre-set roll angle verification to identify consistent settings (P < 0.05), removing abnormal results from parameter fluctuations.
3 RESULTS
3.1 Target and dose area distribution
The fluxes of the phantom plan with a pre-set 90° roll angle and the original plan with a 0° roll angle are shown in Figure 4.
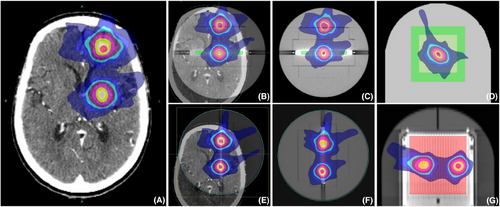
Fluxes of verification cases with 90° 0° roll angles.
Note: As an example, the fixed 0° method was used to obtain the dose distribution data for only one lesion target area. This was because the verification plan excluded fields that did not pass through the detector array, leading to the omission of the dose distribution for the second target area. By applying a roll angle that directly “cuts” through the target area, the dose distributions for both lesions could be accurately obtained.
All multi-lesion treatment plans completed within the experimental deadline were verified in this study, with a total of 101 cases. Each case contained two to eight lesions, and the detailed distribution of lesion numbers is listed in Table 1.
| Validation plan Type | Targets | |||||||
|---|---|---|---|---|---|---|---|---|
| Average | 2 | 3 | 4 | 5 | 6 | 7 | 8 | |
| Cases | 2.97 | 61 | 26 | 12 | 4 | 1 | 2 | 1 |
In the phantom plan with a pre-set roll angle, more than 2/3 of the plans obtained the dose for two targets, and over 1/5 of the plans obtained the dose for three or more targets. In contrast, in the fixed 0° method plan, less than 1/3 of the plans obtained the dose for two targets, as listed in Table 2. The pre-set roll angle method achieved a lesion coverage rate of 78.78%, which was significantly higher than the rate of 44.44% achieved using the fixed 0° method. Most multi-target plans are better suited to the pre-set roll angle method to ensure that the dose distribution is obtained for two or more targets.
| Validation plan type | Targets | |||||
|---|---|---|---|---|---|---|
| Average | 1 | 2 | 3 | 4 | 5 | |
| Fixed 0° method | 1.32 | 67.6% | 32.4% | 0% | 0% | 0% |
| Pre-set roll angle method | 2.34 | 0% | 73.27% | 20.79% | 4.95% | 0.99% |
- Note: The target volume and diameter distribution for all cases are listed in Table 3.
| Equivalent volume (cc) | 1.05-2.09 | 2.09-4.19 | 4.19-6.28 | 6.28-8.38 | 8.38-10.47 |
| Equivalent diameter (mm) | 5-10 | 10-20 | 20-30 | 30-40 | 40-45 |
| All study lesions | 29 | 119 | 84 | 47 | 17 |
| Lesions measured in pre-set roll angle verification | 7 | 87 | 79 | 46 | 17 |
- Note: For the convenience of analysis, the irregular target areas in the table were approximately regarded as spherical, and their equivalent volumes and diameters were calculated.
The equivalent diameter distribution of all tumors ranged from 5 to 45 mm, with an average diameter of 21.86 mm. Approximately 84.46% of the tumors had equivalent diameters between 10 and 40 mm, whereas approximately 68.58% of the tumors had equivalent diameters between 10 and 30 mm. Among the 236 lesions measured in 101 cases, 89.83% had nominal diameters ranging from 10 to 40 mm, with an average diameter of 24.01 mm.
3.2 Plan pass rate in Gamma (γ) analysis
In Figure 5(a), under the 1 mm/1% criteria, the γ pass rates for the 0° plans ranged from 74.4% to 94.4% with a mean value of 89.2%, while those for the pre-set roll angle plans ranged from 73.4% to 96.0% with a mean value of 86.7%. In Figure 5(b), under the 1 mm/2% criteria, the γ pass rates for the 0° plans ranged from 91.1% to 99.6% with a mean value of 96.7%, while those for the pre-set roll angle plans ranged from 83.7% to 99.8% with a mean value of 95.3%. In Figure 5(c), under the 2 mm/1% criteria, the γ pass rates for the 0° plans ranged from 85.2% to 99.4% with a mean value of 95.1%, while those for the pre-set roll angle plans ranged from 86.8% to 100% with a mean value of 94.2%. In Figure 5(d), under the 2 mm/2% criteria, the γ pass rates for the 0° plans ranged from 94.6% to 100% with a mean value of 98.6%, while those for the pre-set roll angle plans ranged from 94.7% to 100% with a mean value of 98.3%.
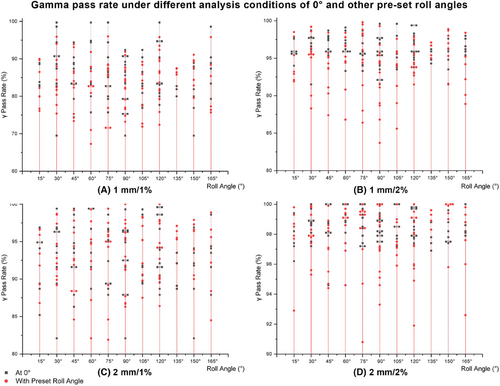
γ pass rate results under the four criteria of 1 mm/1%, 1 mm/2%, 2 mm/1%, and 2 mm/2%.
Note: By comparing the γ analysis results under the four criteria of 1 mm/1%, 1 mm/2%, 2 mm/1%, and 2 mm/2%, this study evaluated whether the pass rate of the pre-set roll angle plans was comparable to that of the 0° plans, thereby assessing whether the new method introduced any systematic errors.
3.3 Plan pass rate in the dose deviation analysis
As shown in Figure 6(a), under the 1% criteria, the DD pass rates ranged from 43.8% to 66.5% for the 0° plans and from 36.7% to 67.3% for the pre-set roll angle plans. In Figure 6(b), under the 2% criteria, the DD pass rates ranged from 60.6% to 90.1% for the 0° plans, and from 61.3% to 94.0% for the pre-set roll angle plans. In Figure 6(c), under the 3% criteria, the DD pass rates ranged from 73.4% to 100% for the 0° plans and from 72.4% to 96.7% for the pre-set roll angle plans.
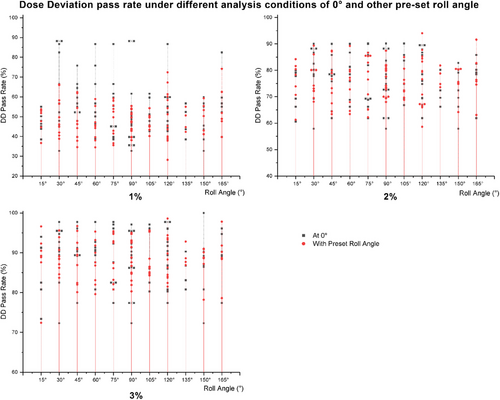
Comparison results of DD analysis under 1%, 2%, and 3% criteria.
Note: In the DD analysis, the planned pass rates of the 0° and pre-set roll angle plans were comparable.
3.4 Appropriate analytical methods and criteria
The results of the double-sample t-test comparing the pre-set roll angle and fixed 0° methods are listed in Table 4.
| Homogeneity of variance | Comparison methods and criteria | ||||||
|---|---|---|---|---|---|---|---|
| 1 mm/1% | 2 mm/1% | 1 mm/2% | 2 mm/2% | 1% | 2% | 3% | |
| Homogeneity | 0.885 | 0.894 | 0.002 | 0.004 | 0.519 | 0.943 | |
Under the γ analysis criteria at 2mm/1% (P = )and 2mm/2% (P = 0.002), and DD analysis at 1% (P = 0.004), P < 0.05 indicated that the means were significantly different. Under the γ analysis criteria at 1mm/1% (P = 0.885) and 1mm/2%(P = 0.894), and DD analysis at 2% (P = 0.519) and 3% (P = 0.943), P > 0.05 suggested that the differences may have been due to random factors.
Furthermore, as listed in Table 5, relaxing the criteria from 1mm/1% to 1mm/2% or 2mm/1%, and subsequently to 2mm/2% led to a significant increase in the pass rate. When comparing the 2mm/1% and 1mm/2% groups (P = 0.072), the observed differences may be attributed to random factors.
| Comparison methods and criteria | |||||
|---|---|---|---|---|---|
| Homogeneity of variance |
1mm/1% vs. 2mm/1% |
1mm/1% vs. 1mm/2% |
1mm/2% vs. 2mm/2% |
2mm/1% vs. 2mm/2% |
2mm/1% vs. 1mm/2% |
| Homogeneity | 0.072 | ||||
4 DISCUSSION
Pretreatment validation of SRS plans for multi-lesions is essential because of the intricate dose distribution and potential errors.12 High-precision verification tools, such as film and high-resolution 2D arrays have been widely used to verify SRS plans.21, 22 Although SRSmapcheck collaborates with StereoPHAN and facilitates measurements at various roll angles, adjusting the images of the verification tool is not supported when creating phantom plans using the CyberKnife TPS, and the fiducial tracking method employed in the verification renders it unfeasible to modify the rolling angle of the array during irradiation. This study investigated the feasibility of disabling fiducial tracking during validation. Specifically, the following test workflow was adopted: (1) position verification was performed using X-sight, (2) the SRSmapcheck angle was adjusted, (3) image guidance was disabled during treatment, and (4) the treatment plan was executed. However, significant discrepancies were observed between the measured and calculated results, with pass rates ranging from 40% to 65% across the three verification plans. Despite efforts to adjust the position, angle, and scale factors, and eliminate planning-related issues, no discernible improvement in the results was achieved, leading to the conclusion that this approach was unfeasible. It is speculated that the position of SRSmapcheck may have changed after angle adjustment, and targeted dose calculations for the rolled SRSmapcheck detector array in the phantom plan were lacking. The SRSmapcheck 2D array was positioned in StereoPHAN at a fixed roll angle of 0° to evaluate the SRS plans.23 Individualized verification of CyberKnife SRS plans with complex lesion distributions using a fixed 0° array set for multiple brain tumor therapies is considered impractical.24 Therefore, it is crucial to select an appropriate pre-set roll angle for the 2D arrays and utilize them to measure the target locations. However, blindly selecting a small angular interval requires acquiring numerous CT scanning images, defining structural contours, and verifying the roll angle setting. The method of scanning the corresponding phantom images for each treatment plan is also not feasible in practice.
By statistically analyzing the tumor volumes of all the cases in the study and approximating the tumors as spheres, their equivalent diameters (i.e., the diameters of the spheres) were calculated. The results showed that 84.46% of the tumors in this study had equivalent diameters ranging from 10 to 40 mm, with an average diameter of 21.86 mm. Among the 236 measured lesions, 89.83% had nominal diameters ranging from 10 to 40 mm, with an average diameter of 24.01 mm. This distribution characteristic is consistent with the assumptions of the geometric array model set in this study. According to the geometric model of the relationship between the tumor and the 2D array position designed in this study, for typical cases where both tumors have diameters of 20 mm or one tumor has a diameter of 40 mm while the other is infinitely small, it is advisable to use an angular interval range of < 15.05°. In radiotherapy plans, it is common for the volume and diameter of the target dose distribution to be slightly larger than those of the lesions. Considering the preparatory workloads and statistical analysis of tumor volumes, using 15° for testing is a suitable choice. If the lesion volumes in clinical cases are smaller, the roll angle interval can be adjusted accordingly. All the pre-set roll angle verification plans could measure and evaluate the dose to more than two targets, which would enable a better evaluation of randomly distributed targets. By contrast, approximately two-thirds of the 0° verification plans could only measure the dose to one target volume.
Between the pre-set roll angle and the fixed 0° methods, the results of the two-sample test for the γ and DD comparison criteria indicated that no significant differences were observed under γ analysis criteria of 1%/1mm and 2%/1mm, suggesting that any discrepancies may be attributed to random factors. Notably, DD analysis alone is not suitable as the primary method for SRS/FSRT plan verification and should only be used as an auxiliary reference. In the pre-set roll angle verification method, a two-sample t-test was performed on the γ analysis results across different criteria. The results indicated that individually relaxing either the distance to agreement (DTA) or DD criteria led to significant changes in pass rates, whereas swapping the DTA and DD parameters did not substantially alter the γ analysis. In conclusion, when employing γ pass rate analysis for the pre-set roll angle method, it is recommended to use the 1%/1mm criterion with a pass rate limit of 86% ±13.3%, and the 2%/1mm criterion with a pass rate limit of 91.6% ±7.9%. This result is consistent with the pass rate performance reported in TG218 for multi-focal lesion verification using SRSmapcheck.25
The fiducial recognition accuracy and position correction effects of the X-sight system were found to be insufficient at specific angles.26 For example, at 60, 105, and 120°, the fiducial marker located in the middle of SRSmapcheck was obscured by high-density regions. Additionally, at 45 and 135°, the fiducial marker positioned at the head of SRSmapcheck partially overlapped with one side of X-sight; however, it remained distinguishable on the other side and could still be used for position and angle correction. These issues introduced obvious errors and uncertainty during the position verification process prior to plan irradiation. This observation is consistent with the findings of verification experiments using fiducials for angle alignment,27 and is relevant to the accuracy of position correction in CyberKnife plan validation.28 During verification, a plan with a pre-set roll angle of 30° was mistakenly recorded as 45°, leading to the use of a 45° pre-set roll angle array for verification. The X-sight tool is incapable of detecting an angle error as large as 15° and therefore cannot correct such discrepancies. Therefore, in practical applications, it is essential to avoid such large angle errors by exercising caution.
In plans with low pass rates, most failure points were concentrated in regions where the dose rapidly decreased between different lesions, causing the measured results to be lower than the calculated plan values. Furthermore, small target volumes in certain plans may result in varying responses owing to the influence of small fields or beam sizes.29 In addition, array correction of the dose and angle response affects the pass rate.30 In such cases, the small size and varied location of the lesions result in a mismatch between the dose calculation resolution of the 2D array and the target regions, making accurate verification challenging.
In the plan verification for multiple lesions, some studies have proposed employing the patient-specific quality assurance method, which involves verifying each target area individually. This approach focuses on the overall pass rate of the treatment plan and places significant emphasis on rigorously assessing the treatment accuracy for each target area.31 However, this method has the limitations of prolonged treatment equipment usage and relatively low efficiency in practical applications. In contrast, this study demonstrated the ability to verify the dose distribution for at least two lesions in a single measurement, thereby significantly enhancing efficiency. Furthermore, when integrated with the patient-specific quality assurance method, this study demonstrated the capability to validate the dose for all target areas in treatment plans involving multi-lesions, particularly those with three or more lesions. For CyberKnife plans, utilizing a phantom structure that mimics the human head anatomy and integrates point dose and film verification functions represents a feasible approach.32 However, to comprehensively address the complexities of beams incident across the entire 4π angular range in non-isocentric and non-coplanar configurations, a new verification tool is indispensable. This tool must be capable of measuring beam incidence at any angle with full 4π angular coverage, applying angular response corrections to the measurement data, and enabling 3D dose reconstruction.
5 CONCLUSION
This study aimed to develop a geometric model to determine the optimal roll angle interval in 2D array measurements, accounting for array characteristics and typical brain tumor volumes. SRSmapcheck was used to compare verification outcomes between the pre-set roll angle and fixed 0° methods, thereby assessing the feasibility and value of its application in validating multi-lesion plans delivered by CyberKnife. Using SRSmapcheck and StereoPHAN with pre-set roll angles enables dose calculation and measurement of multiple tumors. For lesions <77 mm apart and with diameters of 10–40 mm, a roll angle interval of < 15.05° is applicable. The plan pass rate can be evaluated using γ analysis criteria of 1 mm/1% and 1 mm/2%. This approach facilitates the measurement and evaluation of CyberKnife delivery plans for multiple targets across various lesion scenarios, thereby enhancing the assessment capabilities for randomly distributed targets (Supporting information).
AUTHOR CONTRIBUTIONS
All authors contributed to the study's conceptualization and writing. Tengxiang Li performed the conceptualization and roles/writing - original draft. Jinhu CHEN performed investigation. Ruimin HE performed the software. Qingtao QIU performed supervision. Quan TANG, and Yong YIN commit on writing - review & editing. All authors read and approved the final manuscript.
ACKNOWLEDGMENTS
This project was funded by the Natural Science Foundation of China (Grant No. 82072094), Nature Science Foundation of Shandong Province (Grant No. ZR2019LZL017), Taishan Scholars Project of Shandong Province (Grant No. ZR2019LZL017), Xinjiang Uygur Autonomous Region Key Research and Development Project (Grant No. 2022B03019-5), Tumor Precision Radiotherapy Peak Plan (Grant No. 2021HZ81), and Scientific and Technological Innovation Plan Project of Medical Staff in Shandong Province (Grant No. SDYWZGKCJH2023017).
CONFLICT OF INTEREST STATEMENT
The authors have no relevant financial and non-financial interests to disclose.
ETHICS APPROVAL
This study was an observational study. The Shandong Cancer Hospital and Institute Research Ethics Committee confirmed that ethical approval was not required.


