Comparison of Rapid Arc and Intensity Modulated Radiotherapy in a True Beam Linear Accelerator for 6 MV: Application of AAPM TG-119 tests in treatment planning and quality assurance
Abstract
Objective
We developed rapid arc (RA) and intensity-modulated radiotherapy (IMRT) plans based on the American Association of Physicists in Medicine Task Group-119 (AAPM TG-119) proposals and compared the planning and quality assurance results.
Materials and Methods
Two treatment plans were used for each study patient: one using 7–9 IMRT fields and the other using the two full-arc RA methods. Plan optimization and dose calculations were performed using 6 MV photons and EclipseTM with the anisotropic analytical algorithm (AAA). Task group (TG)-119 described the planning objectives used to evaluate the treatment plans generated for this study. Point dose, planar fluence measurement, and trajectory log file analysis are used for quality assurance.
Results
The conformity index (CI) for treatment plans varied between 0.76–0.91 when using IMRT and 0.75–0.93 when using RA. The homogeneity index (HI) was approximately 0.10–0.24 (IMRT) and 0.07–0.23 (RA). The ratio of the total number of monitor units required for IMRT to that required for RA was between 0.87 and 2.14. The treatment log files exhibited higher gamma passing with RA than with IMRT.
Conclusion
RA plans were more effective than IMRT plans in achieving the test goals. Point dose measurements and electronic portal imaging device (EPID)-based planar fluence measurements showed statistically insignificant differences between the IMRT and RA plan quality assurance (QA) results. However, the trajectory log file analysis exhibited better gamma-passing results for RA than for IMRT.
1 INTRODUCTION
The goal of nonuniform intensity-modulated radiotherapy (IMRT) beams is to provide a steep dose gradient that delivers a high conformal dose distribution to the target while sparing the adjacent organs at risk (OAR). Yu et al. proposed a technique in 1995 capable of delivering intensity-modulated arc therapy (IMAT) treatments, in which dose conformity was significantly better than conventional treatments.1 Using a single dynamically modulated arc approach, Otto et al. established a novel plan optimization platform for the efficient and precise delivery of treatments.2 Studies have shown that rapid arc (RA) optimization is well suited for online verification and adaptation, with delivery times reduced to 1.5–3 min for a 200 cGy fraction.3 To commission and perform quality assurance (QA) of delivery systems, Ling et al.4 proposed benchmark picket fence tests based on the principles proposed by LoSasso et al. for dynamic IMRT QA, which showed that the effect of gantry rotation on leaf error was minimal (<0.2 mm).5 In 2009, the American Association of Physicists in Medicine (AAPM) issued IMRT commissioning guidelines to test the accuracy of IMRT planning and delivery systems.6 Tests were established as part of the procedure to determine the overall accuracy of IMRT planning and delivery. Using TG-119 as a baseline criterion, we aimed to evaluate whether RA was better at generating plans of equivalent quality to IMRT. Several articles have reported the clinical benefits and compared the current procedures for various sites between RA and IMRT.7-11 Although Ezzell et al. did not prescribe specific techniques, they provided the structure and guidelines for clinical radiation oncology required to make informed decisions when implementing IMRT programs in their clinics.12
Mynampati et al. reported that baseline and benchmark commissioning data for IMRT/VMAT can be established with the Task Group (TG)-119 objectives.13 Another article had an objective similar to the previously mentioned article.14 The trajectory log files automatically track a wide range of parameters. Each log file tracks 130 variables during treatment and compares real-time measurements to the predetermined treatment plan, sampled every 20 ms.15 Trajectory log file analysis was useful for determining treatment efficacy, as shown in a previous article. Comparative analyses of IMRT and VMAT using traditional methods (TG-119) and advanced log file analyses using Pylinac (v3.7.1) were not found in our literature review. The prostate, C-shaped, head-neck, and multi-target test cases had the same IMRT and VMAT plan evaluation criteria used in our study. To the best of our knowledge, no publications are comparing VMAT and IMRT using the mechanisms discussed in this study. Our research aimed to determine whether VMAT is as effective as IMRT for producing high-quality treatment plans.
2 MATERIALS AND METHODS
Several studies on applying TG-119 tests under different clinical conditions13-15 are available. The beam setup, IMRT targets, and techniques for assessing the dosimetric results were all defined in AAPM TG-119. Computed tomography (CT) datasets, along with the radiotherapy (RT) structure set, were obtained from the AAPM website (www.aapm.org) and integrated into the Eclipse treatment planning system (v15.6, Eclipse, Varian, Palo Alto, CA, USA). Figure 1 illustrates the test structures of CTs placed on water-equivalent plastic slabs.
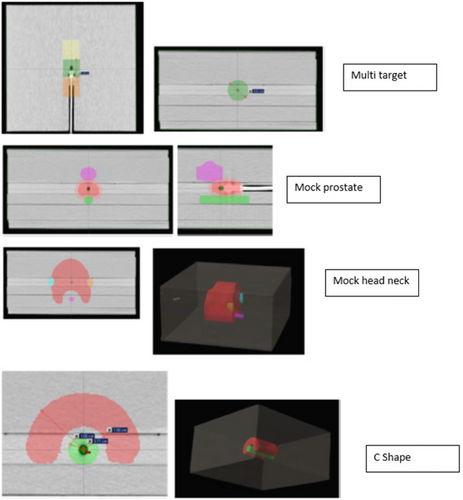
Prostate, head-neck, C-shaped, and multi-target plans of the AAPM TG 119 test structure set.
AAPM TG-119, American Association of Physicists in Medicine Task Group 119.
The comparison conditions for this study were as follows: The same four CT structure sets available from the AAPM website with the already drawn structure set (head-neck, prostate, multi-target, and C-shape) were used for planning comparison. For the IMRT field, the same criteria were selected as mentioned in the AAPM guidelines. The energy used for all plans was 6 MV. The field weights were automatically determined using a treatment planning system. No normalization mode was selected for all plans (IMRT and RA) to place them on a common comparison platform. The organs at risk were obtained from the AAPM-provided structure set (multiple PTVs, parotid, spinal cord, rectum, and bladder, as applicable for the different sites). The same optimization goals were used for RA and IMRT. The same calculation grid space (0.25 cm) was used for all the calculations. Seven equispaced IMRT fields (50° interval) were used for multi-target case IMRT. For the prostate test, seven equispaced fields were selected for planning the IMRT (50° apart). For the head-neck and C-shaped IMRT plans, nine equally spaced coplanar IMRT fields (40° gantry intervals) were used. The RA plan for all the study structure sets was created using two full coplanar arcs (179°–181° counterclockwise and 181°–179° clockwise gantry angles with complementary collimator angles of 30 ° and 330°). The isocenter positions for each study structure set were the same for the RA and IMRT.
This study consisted of four commissioning issues: test prostate, head-neck, C-shaped target, and multi-target. The test prostate structure set included the gross target volume (GTV), planning target volume (PTV), rectum, and bladder. The prostate PTV overlaps one-third of the rectum. In the PTV head and neck test cases, we included OARs, left and right parotids, and the spinal cord. The distance between the spinal cord and the PTV was 1.5 cm. The C-shaped structure comprised a 1.5 cm inner and 3.7 cm outer radius of the C-shaped PTV. The OAR core was a 1 cm radius cylindrical structure with a 0.5 cm gap between the C-shaped PTV and the core. Three cylindrical structures 4 cm in diameter and 4 cm in length were placed along the coronal axis in a multi-target structure set. Couch attenuation was considered during the dose calculation by inserting the IGRT medium couch model into the CT data via the Eclipse treatment planning system.
Absolute dose measurements were made with a 0.015 cc PinPoint ionization chamber (PTW, Freiburg, Germany), and gamma measurements were performed with an electronic portal imaging device (EPID) QA system (Varian Medical Systems, Palo Alto, CA, USA). A Varian aS1200 EPID detector (Varian Medical Systems, Palo Alto, CA, USA), which has a large area (40 cm × 40 cm), a small pixel size (0.0336 cm), and advanced acquisition electronics, is potentially an improved design for dosimetry.16
Treatment plans for 6 MV energy were made using the Eclipse treatment planning system (Eclipse v 15.6; analytical anisotropic algorithm (AAA), 15.6; True Beam with Millennium MLC; Varian Medical Systems, Palo Alto, CA, USA). Two plans were developed for each test case: one with IMRT (dMLC) and the other with the RA method, following the TG-119 guidelines and including the orientation and number of gantry angles indicated by the guidelines. The plan optimization parameters were maintained similarly for each test case for both IMRT and RA. For the prostate and multi-target cases, seven static gantry angles 50 ° apart and two full arcs (179–181 ° counterclockwise and 181–179 ° clockwise) were selected. For the RA plans, the collimator angles were maintained at 30° and 330°, complementary to each other, whereas for the IMRT plans, a 0° collimator angle was used throughout. Heterogeneity corrections were made for all treatment plans utilizing a default dose calculation grid size of 2.5 mm. For all plans, there was a dose-volume constraint and a dose prescription, followed by the constraints outlined in TG-119. Tables 1,2,3, and 4 demonstrate the AAPM TG-119 plan targets for the prostate, head and neck, C-shape, and multi-target test cases, respectively.
| Parameters | TG-119(Gy) | IMRT(Gy) | RA(Gy) | IMRT/TG-119 | RA/TG-119 |
|---|---|---|---|---|---|
| PTV | |||||
| D95 | >75.60 | 75.65 | 77.04 | 1.00 | 1.02 |
| D5 | <83.00 | 82.82 | 82.78 | 0.99 | 0.99 |
| Rectum | |||||
| D30 | <70.00 | 69.83 | 60.28 | 0.99 | 0.86 |
| D10 | <75.00 | 73.10 | 74.90 | 0.97 | 0.99 |
| Bladder | |||||
| D30 | <70.00 | 46.12 | 35.48 | 0.66 | 0.50 |
| D10 | <75.00 | 62.49 | 52.50 | 0.83 | 0.70 |
- Abbreviations: AAPM TG-119, American Association of Physicists in Medicine Task Group 119; IMRT, intensity-modulated radiotherapy; RA, rapid arc.
| Parameters | TG-119(Gy) | IMRT(Gy) | RA(Gy) | IMRT/TG-119 | RA/TG-119 |
|---|---|---|---|---|---|
| PTV | |||||
| D90 | 50.00 | 50.51 | 50.37 | 1.01 | 1.01 |
| D99 | >46.50 | 47.24 | 47.10 | 1.02 | 1.01 |
| D20 | <55.00 | 54.58 | 53.75 | 0.99 | 0.98 |
| Cord | |||||
| Max | <40.00 | 37.64 | 34.70 | 0.94 | 0.87 |
| Parotid | |||||
| D50(LT) | <20.00 | 18.97 | 19.53 | 0.95 | 0.98 |
| D50(RT) | <20.00 | 19.67 | 19.75 | 0.98 | 0.99 |
- Abbreviations: AAPM TG-119, American Association of Physicists in Medicine Task Group 119; IMRT, intensity-modulated radiotherapy; RA, rapid arc.
| Parameters | TG-119(Gy) | IMRT(Gy) | RA(Gy) | IMRT/TG-119 | RA/TG-119 |
|---|---|---|---|---|---|
| PTV | |||||
| D95 | 50.00 | 50.00 | 47.92 | 1.00 | 0.96 |
| D10 | <55.00 | 55.00 | 54.21 | 1.00 | 0.99 |
| Core | |||||
| D5 | <10.00 | 20.83 | 17.56 | 2.04 | 1.76 |
- Abbreviations: AAPM TG 119, American Association of Physicists in Medicine Task Group 119; IMRT, intensity-modulated radiotherapy; RA, rapid arc.
| Parameters | TG-119(Gy) | IMRT(Gy) | RA(Gy) | IMRT/TG-119 | RA/TG-119 |
|---|---|---|---|---|---|
| Center | |||||
| D99 | >50.00 | 48.41 | 49.53 | 0.97 | 0.99 |
| D10 | <53.00 | 52.84 | 53.19 | 0.99 | 1.00 |
| Superior | |||||
| D99 | >25.00 | 24.64 | 25.04 | 0.99 | 1.00 |
| D10 | <35.00 | 34.47 | 34.91 | 0.98 | 0.99 |
| Inferior | |||||
| D99 | >12.50 | 12.29 | 12.89 | 0.98 | 1.03 |
| D10 | <25.00 | 24.65 | 22.31 | 0.99 | 0.89 |
- Abbreviations: AAPM TG-119, American Association of Physicists in Medicine Task Group 119; IMRT, intensity-modulated radiotherapy; RA, rapid arc.
The plan comparison parameters were D99, D95, D90, and D5 for targets and D50, D10, D5, and Dmax for OAR. To evaluate the plans, conformity and homogeneity indices were used as plan quality metrics.
Homogeneity Index (HI):
The total number of monitor units (MU) is an important parameter for assessing the low dose to normal tissue and treatment time. We compared the total number of MU for each plan and the ratio of the total number of planned MU between the static IMRT and RA plans. For quality assurance, point-dose measurements were performed for all plans using a PinPoint chamber (PTW; Freiburg, Germany). Planar dose verification was performed by an EPID-based portal dosimetry system (Varian Medical Systems, Palo Alto, CA, USA). Furthermore, the MLC positional errors for leaf banks A and B were analyzed using Pylinac Code (v3.7.2) available in the Python (v5.6) programming language. MLC averages the root mean square (RMS) error in mm, MLC positional error for leaf bank “A” in mm, and MLC positional error for leaf bank “B” in mm. Furthermore, the MLC considers the average gamma and gamma passing percentage for each field. These parameters are extracted from the trajectory log files generated during the delivery of the treatment plans.
Statistical analyses were performed on RA and IMRT using Student's t-test (P < 0.05) to determine the P value of the analyzed data. SPSS v16.0 (IBM, Armonk, NY, USA) generated box and whisker plots.
3 RESULTS
The study goals and achievements for the different test cases are presented. Table 1 presents the test prostate plan results for RA and IMRT. PTV D95 and D5 of the IMRT and RA plans were comparable to those of the TG-119 treatment plans. The D95 of the RA plan had 1.39 % improved coverage than the IMRT plan.
Table 2 presents the head and neck test case results for RA and IMRT based on the TG-119 goals. One objective of this test was to achieve 50 Gy for D90 in this test. Both IMRT and RA have achieved this goal. For the RA and IMRT plans, the PTV D20 was lower than the TG-119 mean dose (55 Gy). The maximum cord doses for IMRT and RA were 37.64 Gy and 34.70 Gy, respectively, below the tolerance of <40 Gy. The dose constraint for the parotid artery was to have a D50 lesser than 20 Gy. IMRT and RA D50 doses were 18.97 Gy and 19.53 Gy for the left parotid and 19.67 Gy and 19.75 Gy for the right parotid, respectively.
Table 3 presents the IMRT and RA results for the C-shaped-structure test cases. In this case, the PTV plan prescription was 50 Gy, the farthest target. The D95 coverages of the PTV by IMRT and RA were 50 Gy and 47.92 Gy, respectively. Both plans failed to satisfy the D5 hard constraint of the OAR core; however, the plan results were comparable to the TG-119 plan results from published studies.13, 14, 18 The dose to the core by IMRT and RA plans was 20.83 Gy and 17.56 Gy, respectively.
Table 4 presents the IMRT and RA results for the multi-target structure. For this test case, RA failed to achieve two goals, whereas IMRT (dMLC) failed to achieve three goals. The D99 coverage at the center was 48.41 Gy and 49.53 Gy for IMRT (dMLC) and RA, respectively, where the objective was 50 Gy. D10 to the center was 52.84 Gy and 53.19 Gy for IMRT and RA, respectively, where the objective was <53 Gy. Superior structure D99 coverage was 24.64 Gy and 25.04 Gy for IMRT (dMLC) and RA, respectively. D10 values for the superior structure were 34.47 Gy and 34.91 Gy for IMRT and RA, respectively, where the objective was <35 Gy. D99 coverage to the inferior structure was 12.29 Gy by IMRT (dMLC) and 12.89 Gy by RA. IMRT (dMLC) and RA achieved hotspot limits of 25 Gy for D10. However, RA achieved 22.31 Gy compared to 24.65 Gy with IMRT (dMLC).
Table 5 presents the plan evaluation results for the test cases: test prostate, test head-neck, C-shaped, and multi-target. It also presents the planned MU of all plans and the ratios of MUs for the IMRT and RA plans. The CI of the head and neck, prostate, and multi-target were comparable between RA and IMRT. For the C-shaped test case, the IMRT plan CI of 0.76 was higher than the RA plan's CI of 0.75. All plans had good HI. The head-neck, C-shape, and multi-target structures exhibited lower HIs for RA than IMRT. Only in the case of prostate, HI for RA was 0.01 % higher than the IMRT plan. Table 5 also describes the MU of all plans and the ratio of the IMRT and RA plans' MU. IMRT plans had a total planned MU of 472, 1090.9, 842.2, and 424.7 for prostate, head-neck, C-shaped, and multi-target cases, respectively. The total planned MU ratios of the IMRT versus RA plans were 0.87, 2.14, 1.16, and 1.15 for the prostate, head-neck, C-shaped structure, and multi-target structure, respectively. As the complexity of the plan increased, the total number of MU required for the IMRT and RA plans increased. However, in most cases, the increase in planned MU with complexity was less for RA plans than for IMRT plans. To produce a comparable distribution for complex cases such as test head-neck, IMRT required almost double the MU required by the RA plan. This was probably because of the greater degrees of freedom provided by the RA. However, this was not true in all circumstances; the prostate test case is an example of this.
| Prostate | Head Neck | C-Shape | Multitarget | |||||
|---|---|---|---|---|---|---|---|---|
| Parameters | IMRT | RA | IMRT | RA | IMRT | RA | IMRT | RA |
| CI | 0.91 | 0.93 | 0.88 | 0.91 | 0.76 | 0.75 | 0.86 | 0.86 |
| Homogeneity Index | 0.14 | 0.15 | 0.22 | 0.16 | 0.24 | 0.23 | 0.10 | 0.08 |
| MU | 472.0 | 544.0 | 1090.9 | 510.6 | 842.2 | 724.9 | 424.7 | 370.4 |
| MU Ratio | 0.87 | 1.00 | 2.14 | 1.00 | 1.16 | 1.00 | 1.15 | 1.00 |
- Abbreviations: AAPM TG-119, American Association of Physicists in Medicine Task Group 119;IMRT, intensity-modulated radiotherapy; RA, rapid arc; CI, conformity index; HI, homogeneity index; MU, monitor unit.
Table 6 shows IMRT and RA the gamma analyses and point dose results of the IMRT and RA plans measured using EPID QA software. All gamma evaluation results exhibited gamma less than one for more than 95% of data points with the criteria of 3% dose difference (DD) and 3 mm distance to agreement(DTA). The maximum deviation observed in point dose measurements of the C-shaped RA plan was 12.31% at the isocentric level. Off-center point-dose measurements were also performed. Larger errors in point-dose measurements were observed in the low-dose gradient area than in the high-dose gradient area. The gamma passing results obtained using EPID portal dosimetry showed no statistically significant difference between the RA and IMRT groups (P = 0.51). A paired-sample t-test was used for this assessment. Similarly, the results of the RA and IMRT difference-point dose measurements were not statistically significant (P = 0.33).
| Test Case | RA | IMRT (dMLC) | ||||||
|---|---|---|---|---|---|---|---|---|
| Point Dose (Gy) | Gamma (<1%) | Point Dose (Gy) | Gamma (<1%) | |||||
| Measured | Planned | Ratio | Measured | Planned | Ratio | |||
| Prostate | 191.68 | 184.60 | 1.04 | 98.40 | 192.42 | 189.80 | 1.01 | 97.30 |
| Head neck | 203.48 | 205.00 | 0.99 | 85.90 | 211.34 | 210.50 | 1.00 | 95.50 |
| C-Shape | 31.21 | 35.60 | 0.88 | 98.70 | 49.15 | 48.60 | 1.01 | 100.00 |
| Multi-target | 210.85 | 211.50 | 1.00 | 97.50 | 212.33 | 210.20 | 1.01 | 95.00 |
- Abbreviations: AAPM TG-119, American Association of Physicists in Medicine Task Group 119; IMRT, intensity-modulated radiotherapy; RA, rapid arc
Using trajectory log file analysis, we determined the MLC positional accuracy. For all the fields, the results ranged from 0.1–0.42 mm. Pylinac Code and Python software were used to analyze the log files. The details of the trajectory log file analysis results for all fields of the RA plan are listed in Table 7. Similar data for IMRT planning are listed in Table 8. Based on Tables 7 and 8, we performed a Pearson correlation test on the MLC positional error per field for leafbanks A and B and the average MLC positional error. The results showed a high correlation (minimum value of 0.094, with a significance level of 0.01). Percent gamma passing for treatment field gamma for IMRT was 94.97%, and the same for RA was 98.89% (under 3 %, 3 mm criteria). The average gamma value per field for RA was 0.116, and that of IMRT was 0.116.
| MLC RMS Average (mm) | MLC RMS Average A Bank (mm) | MLC RMS Average B Bank (mm) | Gamma Passing for Individual Field (%) | Average Gamma | |
|---|---|---|---|---|---|
| Prostate: RA: Field 1 | 0.14 | 0.14 | 0.13 | 97.16 | 0.21 |
| Prostate: RA: Field 2 | 0.11 | 0.11 | 0.11 | 97.03 | 0.33 |
| Multi-target: RA: Field 1 | 0.16 | 0.16 | 0.16 | 99.92 | 0.01 |
| Multi-target: RA: Field 2 | 0.17 | 0.17 | 0.17 | 99.90 | 0.02 |
| Head-Neck: RA: Field 1 | 0.22 | 0.23 | 0.21 | 97.89 | 0.23 |
| Head-Neck: RA: Field 2 | 0.09 | 0.09 | 0.10 | 99.27 | 0.11 |
| C-Shape: RA: Field 1 | 0.13 | 0.14 | 0.13 | 99.96 | 0.01 |
| C-Shape: RA: Field 2 | 0.13 | 0.14 | 0.12 | 99.95 | 0.01 |
- Abbreviations: AAPM TG-119, American Association of Physicists in Medicine Task Group 119; IMRT,intensity-modulated radiotherapy; RA,rapid arc;MLC, multi-leaf collimator; RMS, root mean square.
| MLC RMS Average (mm) | MLC RMS Average A Bank (mm) | MLC RMS Average B Bank (mm) | Gamma Passing for Individual Field (%) | Average Gamma | |
|---|---|---|---|---|---|
| Prostate: IM: Field 1 | 0.15 | 0.13 | 0.16 | 97.25 | 0.89 |
| Prostate: IM: Field 2 | 0.22 | 0.21 | 8.22 | 97.11 | 0.99 |
| Prostate: IM: Field 3 | 0.15 | 0.15 | 0.15 | 98.46 | 0.41 |
| Prostate: IM: Field 4 | 0.08 | 0.12 | 0.05 | 98.40 | 0.22 |
| Prostate: IM: Field 5 | 0.13 | 0.15 | 0.11 | 96.42 | 0.47 |
| Prostate: IM: Field 6 | 0.15 | 0.18 | 0.11 | 96.82 | 0.37 |
| Prostate: IM: Field 7 | 0.08 | 0.08 | 0.09 | 98.80 | 0.19 |
| Multi-target: IM: Field 1 | 0.16 | 0.20 | 0.13 | 97.16 | 0.62 |
| Multi-target: IM: Field 2 | 0.19 | 0.21 | 0.16 | 96.92 | 0.71 |
| Multi-target: IM: Field 3 | 0.18 | 0.22 | 0.13 | 98.34 | 0.30 |
| Multi-target: IM: Field 4 | 0.11 | 0.11 | 0.11 | 96.97 | 0.35 |
| Multi-target: IM: Field 5 | 0.11 | 0.12 | 0.11 | 96.43 | 0.33 |
| Multi-target: IM: Field 6 | 0.14 | 0.14 | 0.14 | 97.89 | 0.23 |
| Multi-target: IM: Field 7 | 0.09 | 0.09 | 0.10 | 99.27 | 0.11 |
| Head-Neck: IM: Field 1 | 0.18 | 0.21 | 0.14 | 95.63 | 0.75 |
| Head-Neck: IM: Field 2 | 0.30 | 0.32 | 0.28 | 93.16 | 2.78 |
| Head-Neck: IM: Field 3 | 0.19 | 0.24 | 0.01 | 91.06 | 2.28 |
| Head-Neck: IM: Field 4 | 0.15 | 0.19 | 0.11 | 91.40 | 1.75 |
| Head-Neck: IM: Field 5 | 0.11 | 0.11 | 0.12 | 92.21 | 0.82 |
| Head-Neck: IM: Field 6 | 0.11 | 0.10 | 0.13 | 95.29 | 0.68 |
| Head-Neck: IM: Field 7 | 0.15 | 0.13 | 0.17 | 94.46 | 0.95 |
| Head-Neck: IM: Field 8 | 0.10 | 0.09 | 0.11 | 95.28 | 0.68 |
| Head Neck: IM: Field 9 | 0.11 | 0.12 | 0.96 | 93.62 | 1.20 |
| C-Shape: IMRT: Field 1 | 0.15 | 0.02 | 0.12 | 90.02 | 2.00 |
| C-Shape: IMRT: Field 2 | 0.21 | 0.23 | 0.18 | 94.04 | 0.94 |
| C-Shape: IMRT: Field 3 | 0.16 | 0.19 | 0.12 | 89.59 | 2.24 |
| C-Shape: IMRT: Field 4 | 0.12 | 0.15 | 0.09 | 88.29 | 1.89 |
| C-Shape: IMRT: Field 5 | 0.11 | 0.11 | 0.10 | 91.07 | 0.91 |
| C-Shape: IMRT: Field 6 | 0.15 | 0.13 | 0.17 | 95.72 | 0.58 |
| C-Shape: IMRT: Field 7 | 0.15 | 0.13 | 0.16 | 98.95 | 0.09 |
| C-Shape: IMRT: Field 8 | 0.11 | 0.11 | 0.12 | 92.56 | 0.80 |
| C-Shape: IMRT: Field 9 | 0.09 | 0.09 | 0.08 | 90.51 | 1.45 |
- Abbreviations: AAPM TG119, American Association of Physicists in Medicine Task Group 119; IMRT, intensity-modulated radiotherapy; RA, rapid arc; MLC, multi-leaf collimator; RMS, root mean square.
4 DISCUSSION
Based on the AAPM TG-119 recommendations, RA and IMRT plans were developed and compared regarding planning and quality assurance results. IMRT, rapid arc planning, and dose distribution were evaluated using the AAPM TG-119 standard.
As previously demonstrated in the classic TG-119 test system with RA/IMRT planning and delivery efficacy in a true beam linear accelerator setup,13, 14 we observed some similarity in the results for our RA/IMRT planning and QA exercise; however, not for all aspects. Details of this process are discussed in the following sections.
Figure 2 shows the axial plane dose distributions of the IMRT and RA plans for the test prostate, head and neck, and C-shape. It also shows the frontal plane dose distribution of multi-target cases. Furthermore, Figure 2 shows that the low-dose spread was lower for RA than for IMRT.
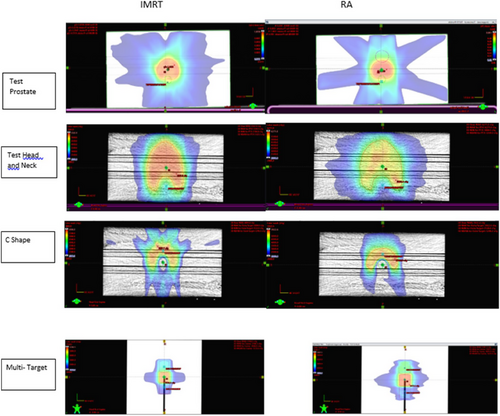
Dose distributions of IMRT and RA for test prostate, head-neck, C-shaped, and multi-target plans.
AAPM TG119, American Association of Physicists in Medicine Task Group 119.
DVH comparisons for the test prostate, head-neck, C-shaped, and multi-target plans are shown in Figures 3(a), (b), (c) and (d), respectively. The difference in the dose to the OARs in the case of the prostate was greater than the difference in the PTV coverage, as shown in Figure 3(a). Figure 3(b) shows that the dose objectives obtained from IMRT and RA are comparable. The only significant difference observed was a 2.7 Gy lower dose to the spinal cord in RA than IMRT in RA. Figure 3(d) depicts the DVHs of the IMRT and RA plans when comparing the multi-target plans. The dose-volume histograms of the superior, inferior, and central targets in IMRT and RA were comparable. Tables 1, 2, 3, and 4 contain information on Figures 3(a),(b),(c) and (d), respectively.
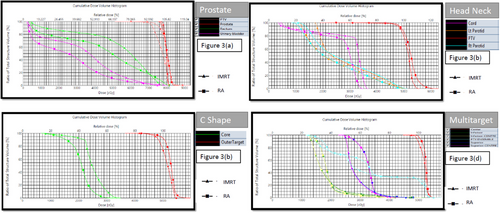
(a) Plan DVH comparison between prostate plans done by IMRT (dMLC) and RA, (b) Plan DVH comparison between plans done by IMRT (dMLC) and RA for head-neck cases, (c) Plan DVH comparison between IMRT (dMLC) and RA plans for C-shaped structure, and (d) Plan DVH comparison between plans done by IMRT (dMLC) and RA for multi-target structure.
IMRT, intensity-modulated radiotherapy; RA, rapid arc; DVH, dose volume histogram.
Figure 4 shows the results of the log file analysis of all the trajectory files. The maximum error allowed was 0.5 mm for any particular instance. MLCRAmm is the root mean square (RMS) error for both MLC banks for any specific field of RA in millimeters; MLCRAmmA is the RMS error for MLC bank A for any particular field of RA in millimeters; and MLCRAmmB is the RMS error for MLC bank B for any specific field of RA in millimeters. MLCIMmm is the RMS error for both MLC banks for any particular field of IMRT in millimeters; MLCIMmmA is the RMS error for MLC bank A for any specific field of IMRT in millimeters; and MLCIMmmB is the RMS error for MLC bank B for any particular field of IMRT in millimeters. Figures 5 and 6 show the variation in the percentage of pixels passing the 3% 3 mm gamma passing criteria and the average gamma of each field of the RA and IMRT plans in the box plot diagram. Figure 5 shows that the percentage of gamma passing for RA fields showed better results with more variation. In contrast, the IMRT plan fields exhibited a lower percentage of gamma passing values with a smaller span of variation among fields. The lower the gamma value in the range of 0–1, the better the result. Figure 6 shows that the average gamma for all RA fields was lower than that for all IMRT fields, and the variation among the fields was smaller for RA. Log-file analysis revealed that the positional accuracy of the RA field was superior to that of the IMRT fields. More parameters might have been examined by analyzing trajectory log files but were unavailable for examination. However, it will be possible in future studies to evaluate the effectiveness of RA and IMRT by considering other factors such as gantry angle.
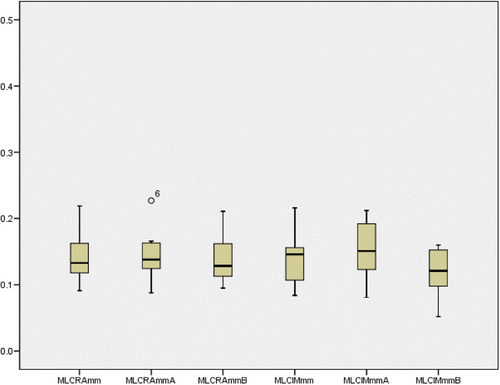
MLC positional error observed for all fields of the RA and IMRT plans.
IMRT, intensity-modulated radiotherapy; RA, rapid arc; MLC, multi-leaf collimator.
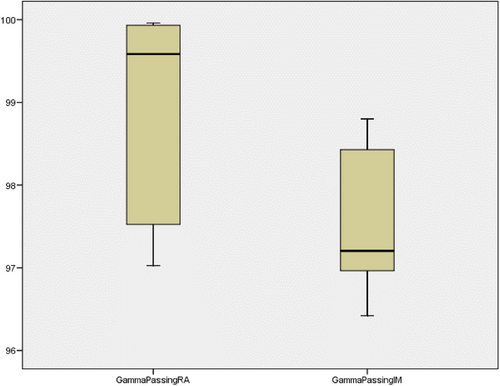
Percentage gamma passing result observed for all fields of the RA and IMRT plans.
IMRT, intensity-modulated radiotherapy; RA, rapid arc.
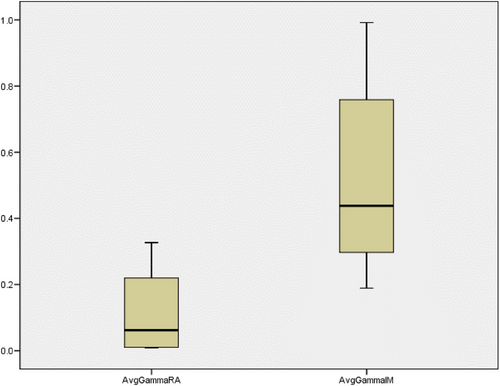
Average gamma passing result observed for all fields of the RA and IMRT plans.
IMRT, intensity-modulated radiotherapy; RA, rapid arc.
We found no literature in which TG-119 plans were assessed via trajectory log file analysis to compare the delivery efficacy of IMRT and RA. The present study used a PinPoint chamber instead of a 0.6-cc chamber for point-dose measurements. The small, sensitive volume of this chamber assisted in measuring the dose more accurately in the sharp dose gradient area. We observed that some studies used different plan evaluation indices from the baseline data.19 However, we maintained a plan evaluation criteria similar to the classic TG-119 guideline. The motivation behind this is twofold. We compared our data with the results of the previous tests. In addition, this was not a planned exercise. This was an assessment of the limitations and reliability of the treatment planning system, for which we found our test to be sufficient.
In the TG-119 test, measurements are based only on point dose and film dosimetry. In this study, we performed a log file analysis using Pylinac and Python software platforms and calculated the gamma passing for each field. There was no statistically significant difference between the IMRT and RA plan QA results using point-dose or EPID-based planar fluence measurements. However, inspection of the trajectory log file revealed improved gamma passing results. The superior dosimetric and QA results of RA are new findings that have not been reported in the available literature.
There may be several reasons RA exhibited better gamma passing results than IMRT in the trajectory log file analysis. One possible explanation is that RA delivers radiation more rapidly than IMRT, which could lead to less motion-related blurring of the radiation dose distribution. Another possibility is that the trajectory log file analysis could not capture all the factors that affect the actual dose distribution during treatment; therefore, there may be some other factors that contributed to the difference in the gamma passing results. A clear understanding of these results requires further investigation, which can be considered in the scope of future studies.
Using only 6 MV of energy for all planning can be considered a limitation of our study. We could not include any inhomogeneity within the structure set to account for the dose uncertainty caused by inhomogeneity. Incorporating more challenges and creating more plan comparisons would provide more information regarding the limitations of the system. In the present study, we refrained from making such structural sets and challenges. This is a limitation of this study. We confined our study to the classical challenges provided only by AAPM and compared our results with available literature. However, we intend to extend the challenges the AAPM poses in a separate study. A multi-institutional audit may be required to compare the current planning framework with new aims. In addition, future research should consider all the energy available and required for IMRT and RA.
5 CONCLUSIONS
Understanding the limitations of any system is important. At some point, there is always a trade-off between target coverage and OAR dosages. IMRT and RA have been widely used in clinical settings, and we have gained confidence in their application. However, it was necessary to set up a task for our TPS that could not be met fully. The user can understand the capabilities of TPS by completing this assignment. In addition, users can compare their results to those in the existing literature to determine if any errors remain in their treatment planning and patient-specific QA workflow. The findings of these measurements can be linked to the establishment of a foundation for assessing the accuracy of patient-specific QA. We analyzed the trajectory log file and found that all MLC positions were within the acceptable tolerance limit. In all our tests, RA performed better overall than IMRT in meeting the complex challenges created by the analogy of a clinical situation.
CONFLICT OF INTEREST STATEMENT
We confirm that this work is original and has not been published elsewhere nor is it currently under consideration for publication elsewhere. We have no conflicts of interest to disclose. All authors approved the manuscript and its submission to the journal.
FINANCIAL SUPPORT AND SPONSORSHIP
None.
ETHICS STATEMENT
Not applicable.


