Comprehensive diagnostic model of metastasis in prostate cancer: Individual and combined bioscore model of ADC value, Gleason score, and PSA
Abstract
Prostate cancer (PCa) metastasis significantly influences treatment decisions and prognosis. This study evaluated the individual and combined diagnostic ability of apparent diffusion coefficient (ADC), Gleason score and prostate-specific antigen (PSA) in detecting metastasis. The study included data from 120 biopsy-confirmed PCa patients treated from 2019 to 2023. Whole-body MRI images, incorporating high-resolution T2 and axial DWI sequences, were evaluated by experienced radiologists. Receiver operating characteristic (ROC) curves and logistic regression models were used to assess the diagnostic performance of ADC, Gleason score, and PSA in detecting metastasis. The prevalence of PCa metastasis was 25.0%, with pelvic lymph node metastasis (16.7%) and bony metastasis (12.5%) being most prevalent. Patients with PCa metastasis had significantly lower ADC values, higher Gleason scores, and higher PSA levels compared to those without metastasis. Individually, an ADC cut-off of ≤549.00 mm2/s was the best marker for detecting metastasis. The combined bioscore model including PSA, ADC values and Gleason score was the best independent predictor, correlating with a 159-fold increased likelihood of detecting PCa metastasis. This study demonstrated the prognostic ability of PCa markers in detecting metastasis. ADC was an independent, sensitive, specific, and accurate diagnostic marker. The combined bioscore model of ADC, PSA and Gleason score significantly enhanced the identification of patients with PCa metastasis.
1 INTRODUCTION
Prostate cancer (PCa) remains a significant oncological challenge worldwide. Metastatic progression is crucial in determining therapeutic strategies and patient prognosis. Effective diagnosis of metastasis in PCa is pivotal for tailoring treatment plans and improving outcomes.
Traditionally, the diagnosis of PCa has relied on prostate-specific antigen (PSA) test and digital rectal examination (DRE).1 The PSA test is widely used and relatively inexpensive, and research has established a strong correlation between PSA and PCa.2-4 However, PSA is not cancer-specific and can yield false positives.5 Elevated PSA levels can also be attributed to conditions like prostatitis, benign prostatic hypertrophy (BPH), and other nonmalignant prostatic diseases, which adds uncertainty to its utility as an effective PCa diagnostic marker.6, 7
This demonstrates the limitations of PSA in terms of its sensitivity and specificity, relying heavily on a “diagnostic” cut-off point, which frequently results in an excessive number of false-positive and false-negative results.5, 8 Consequently, there is now a growing need for more reliable and effective diagnostic markers that are useful along the PCa patient journey, and to mitigate the challenges of overdiagnosis and overtreatment.
Among emerging diagnostic tools, the apparent diffusion coefficient (ADC) value from diffusion-weighted MRI shows promise in offering more nuanced insights into tumor aggressiveness.9 ADC, which reflects the diffusion of water molecules within the tumor, has been associated with tumor cellularity and aggressiveness. Lower ADC values have been linked to more aggressive tumors with higher Gleason scores.10 Additionally, the Gleason score, determined from biopsy samples, is a well-established prognostic indicator of PCa aggressiveness and metastatic potential.11
While these individual markers may provide valuable information, their combined diagnostic ability in detecting PCa metastasis has not been investigated. This study aimed to evaluate the individual and combined diagnostic ability of ADC, Gleason score, and PSA in detecting metastasis in patients with PCa. By assessing the performance of these markers, both individually and in a combined model, the findings from this study could help improve the accuracy of metastasis detection and guide personalized treatment strategies for patients with PCa.
2 MATERIALS AND METHODS
2.1 Study design and population
This retrospective study included data from 120 biopsy-confirmed PCa patients treated at Spectra Health Imaging and Interventional Radiology from 2019 to 2023. Patients with histologically confirmed PCa who underwent whole-body MRI and had complete data on ADC, Gleason score, and PSA were included. Patients with incomplete data or other known malignancies were excluded.
2.2 Ethics statement
The study received ethical approval from the Committee on Human Research, Publication, and Ethics at Kwame Nkrumah University of Science and Technology (CHRPE/RC/028/20).
2.3 Clinical and laboratory data
Medical records were thoroughly examined and information on PCa history, sociodemographic and clinical characteristics such as age, PCa type, lesion type, lesion location, lesion length and breadth, and incidental findings were extracted. The Gleason score was obtained from the histopathological reports of the biopsy samples. The serum PSA levels were recorded from the patient's medical records.
2.4 MRI acquisition and analysis
Whole-body MRI images were acquired on a Siemens Magnetom Essenza 1.5 Tesla; 16 Channel TIM MRI scanner. The prostate examination had the following sequences, High-Resolution T2 images in axial, coronal, and sagittal planes and axial DWI (B50-1400) with ADC mapping. The axial DWI examination was performed using the Siemens proprietary high-resolution diffusion sequence RESOLVE. Fusion of the Axial T2 and Axial Diffusion images with color coding for improved visualization was employed.
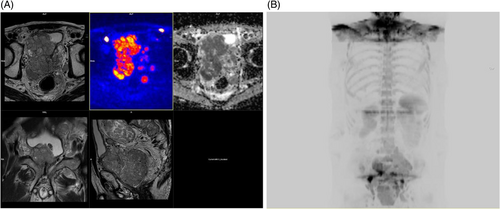
The large flex coil of the scanner was positioned posteriorly at the level of the pelvis, and the body coil was anteriorly at the level of the pelvis. Whole-body MRI, with an average time scan time of 50 min, consisted of axial DWI (B50–900) with ADC mapping from the base of the skull to the mid-thigh, T1 and STIR images of the whole spine in the sagittal plane, T2 axial images of the neck, thorax, abdomen, and pelvis and T2 spin-echo images of the brain. The area of interest was covered using the head and neck coil; which covered the head and neck; the body matrix coil; which covered the thorax and abdomen; and the large flex coil, which covered the pelvis to mid-thigh. High-Resolution 3D-maximum intensity projection (MIP) images were reconstructed from the transverse diffusion images into coronal and sagittal planes, after which they were inverted and stitched. The examinations were evaluated by two senior radiologists with not less than 18 years of experience interpreting MRI examinations (Figure 1A,B). The mean ADC value was calculated, and the inter-observer variability was assessed using the intraclass correlation coefficient (ICC). An ICC value >0.8 was considered to indicate excellent agreement between the two radiologists.
2.5 Data management and statistical analyses
Data collected were entered, cleaned, and coded using Microsoft Excel 2021. Statistical analyses were conducted using Statistical Package for Social Sciences (SPSS) Version 26.0 (Chicago, IL, USA), and various Bioconductor packages within the R environment (www.bioconductor.org; www.r-project.org); R for statistical computing version 4.2.3.12 Receiver operating characteristic (ROC) curves were used to determine the optimal cut-off values for ADC, Gleason score, and PSA in detecting metastasis. Logistic regression models were then employed to assess the individual and combined diagnostic performance of these variables. The results were presented as odds ratios (OR) with 95% confidence intervals (CIs), and a p-value <.05 was considered statistically significant.
3 RESULTS
3.1 Sociodemographic and clinical characteristics of study participants
The mean age of the study participants was 67.22 years with more than half of the participants within 60–69 years, 39.8% within 70–102 years and 12.7% within 35–59 years. About 46% of participants had multiple lesions (45.8%), while 36.7% had single lesions and 17.5% had double lesions. The mean length and breadth of lesions were 2.14 cm and 1.52 cm respectively. Half of participants had a total Gleason score of 7, 35.8% had a total score >7 and 14.2% had a total score <7. The median ADC value and PSA levels were 595.53 mm2/s and 22.90 ng/mL respectively. In addition, the most common incidental findings among patients with PCa were cervical degenerative diseases (81.7%) and lumbar degenerative diseases (81.7%) followed by renal cyst (13.3%), thoracic degenerative diseases (8.3%), cerebral microvascular diseases (7.5%) and seminal vasculitis (3.3%) (Table 1).
| Variable | Frequency (n = 120) | Percentage (%) |
|---|---|---|
| Age (years) (π ± SD) | 67.22 ± 8.78 | — |
| Age group (years) | ||
| 35–59 | 15 | 12.7 |
| 60–69 | 56 | 47.5 |
| 70–102 | 47 | 39.8 |
| Prostate cancer type | ||
| Primary | 116 | 96.7 |
| Secondary | 4 | 3.3 |
| Total Gleason score | ||
| <7 | 17 | 14.2 |
| 7 | 60 | 50.0 |
| >7 | 43 | 35.8 |
| PSA (ng/mL) (Median [IQR]) | 22.90 (13.04–65.23) | — |
| ADC Value (mm2/s) (Median [IQR]) | 595.53 (509.50–695.25) | — |
| Lesion length (cm) (π ± SD) | 2.14 ± 1.31 | — |
| Lesion breadth (cm) (π ± SD) | 1.52 ± 1.05 | — |
| Lesion type | ||
| Single | 44 | 36.7 |
| Double | 21 | 17.5 |
| Multiple | 55 | 45.8 |
| Location of lesion | ||
| Right peripheral zone | 67 | 55.8 |
| Left peripheral zone | 72 | 60.0 |
| Right transitional zone | 50 | 41.7 |
| Left transitional zone | 51 | 42.5 |
| Anterior fibromuscular stroma | 17 | 14.2 |
| Central gland | 10 | 8.3 |
| Diffuse | 6 | 5.0 |
| Incidental findings | ||
| Cervical degenerative disease | 98 | 81.7 |
| Lumbar degenerative disease | 98 | 81.7 |
| Thoracic degenerative disease | 10 | 8.3 |
| Renal cyst | 16 | 13.3 |
| Cerebral microvascular disease | 9 | 7.5 |
| Seminal vasculitis | 4 | 3.3 |
3.2 Prevalence of metastasis among PCa patients
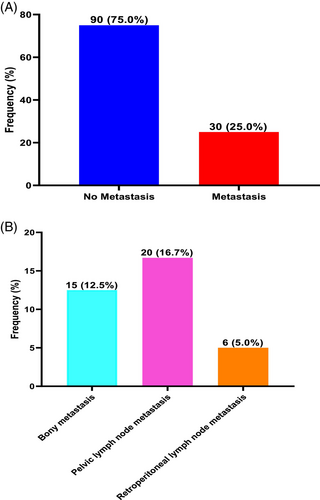
The prevalence of PCa metastasis was 25.0%. Types of metastases in decreasing order of prevalence was pelvic lymph node metastasis (16.7%) followed by bony metastasis (12.5%) and retroperitoneal lymph node metastasis (5.0%) (Figure 2).
3.3 Comparison of ADC values, Gleason score and PSA among metastasis and nonmetastasis PCa patients
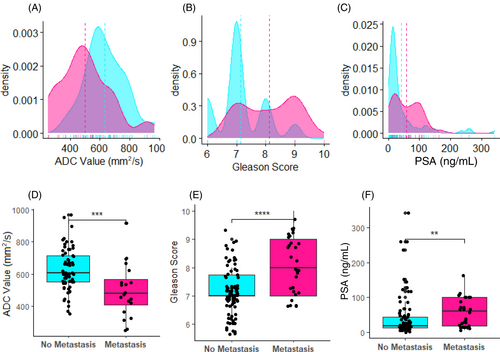
Patients with PCa metastasis had significantly lower ADC values, compared with patients without PCa metastasis (p < .001). However, patients with PCa metastasis had significantly higher Gleason scores (p < .0001) and PSA levels (p < .01) than patients without metastasis (Figure 3).
3.4 Diagnostic performance of ADC value, Gleason score and PSA in detecting metastasis among PCa patients
To evaluate the diagnostic performance of ADC value, Gleason score and PSA levels in detecting metastasis, ROC analysis was used. Decreasing ADC value was associated with metastasis among patients with PCa with an area under the curve (AUC) of 0.755 (p < .0001), indicating better discrimination between patients at high and low risk. Additionally, increasing Gleason score (AUC = 0.771, p < .0001) and increasing PSA levels (AUC = 0.670, p = .0020) were significantly associated with PCa metastasis. The AUC of 0.771 and 0.670 for Gleason score and PSA levels indicate better discrimination between patients at high and low risk (Figure 4).
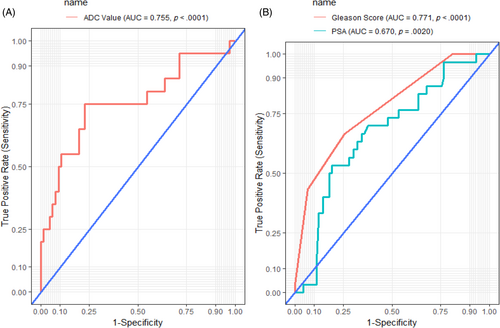
At a cut-off of ≤549.00 mm2/s, ADC was the best marker for detecting metastasis among patients with PCa with a sensitivity of 75.0%, specificity of 77.3%, a positive predictive value (PPV) of 50.0%, and a negative predictive value (NPV) of 91.1%, AUC of 75.5% and accuracy of 76.7%. At a cut-off of ≥8, Gleason score performed poorly as a marker of PCa metastasis (sensitivity, 66.67%; specificity, 74.4%; AUC, 77.1%; accuracy, 72.5%). Additionally, at a cut-off of 57.32 ng/mL, PSA performed poorly as a marker of PCa metastasis (sensitivity, 53.3%; specificity, 81.1%; AUC, 67.0%; accuracy, 74.2%) (Table 2).
| Biomarker | Cutoff | Sensitivity (95% CI) | Specificity (95% CI) | PPV | NPV | LR+ | LR− | Accuracy |
|---|---|---|---|---|---|---|---|---|
| ADC value | ≤549.00 mm2/s | 75.0 (52.6–89.0) | 77.3 (65.7–85.8) | 50 | 91.1 | 3.3 | 0.32 | 76.7 |
| Gleason score | ≥8 | 66.67 (48.6–80.8) | 74.4 (64.5–82.3) | 46.5 | 87 | 2.61 | 0.45 | 72.5 |
| PSA | ≥57.32 ng/mL | 53.3 (36.2–69.7) | 81.1 (71.7–87.9) | 48.5 | 83.9 | 2.82 | 0.58 | 74.2 |
- Note: At a cutoff of ≤549, ADC value was the best biomarker for detecting metastasis among patients with PCa with a sensitivity of 75.0%, specificity of 77.3%, a positive predictive value of 50.0%, and a negative predictive value of 91.1% as well as area under the curve and accuracy of 75.5% and 76.7% respectively.
- Abbreviations: CI, confidence interval, LR+, positive likelihood ratio; LR−, negative likelihood ratio; NPV, negative predictive value; PPV, positive predictive value.
3.5 Combined bioscore of ADC value, Gleason score, and PSA for detecting PCa metastasis
In a univariate logistics regression model, using either PSA, ADC or Gleason score alone was significantly associated with a 9-fold increased likelihood of detecting metastasis among patients with PCa (cOR: 9.21, 95% CI: [1.14–74.44]; p = .037). Using a combination of two factors among PSA, ADC values or Gleason score (cOR: 30.46, 95% CI: [3.59–258.54]; p = .002) was significantly associated with over 30-fold increased likelihood of detecting metastasis among patients with PCa. On the other hand, using the combination of PSA, ADC values and Gleason score (cOR: 165.00, 95% CI: [8.84–3080.95]; p = .001) together was significantly associated with a 165-fold increased chances of detecting metastasis among patients with PCa.
In a multivariate logistics regression prediction model, after adjusting for age and possible cofounders, combined bioscore of the three biomarkers; PSA, ADC and Gleason score (aOR: 158.89, 95% CI: [8.39–3008.26]; p = .001) remained the best independent predictor of 159-odds increased chances of detecting metastasis among patients with PCa (Table 3).
| Combined bioscore | Metastasis (n = 30) | cOR (95% CI) | p-Value | aOR (95% CI) | p-Value |
|---|---|---|---|---|---|
| 0 | 1 (3.3) | 1.00 | — | 1.00 | |
| 1 | 12 (40.0) | 9.21 (1.14–74.44) | .037 | 8.80 (1.08–71.55) | .042 |
| 2 | 12 (40.0) | 30.46 (3.59–258.54) | .002 | 29.61 (3.44–254.97) | .002 |
| 3 | 5 (16.7) | 165.00 (8.84–3080.95) | .001 | 158.89 (8.39–3008.26) | .001 |
- Note: 0: Normal PSA, ADC Value, and Gleason score levels, 1: Either abnormal PSA, ADC Value, and Gleason score levels, 2: Either two abnormal PSA, ADC Value, and Gleason score levels, 3: All abnormal PSA, ADC Value, and Gleason score levels, p-values computed by logistics regression model, p-values <.05 and bolded indicate statistically significant.
4 DISCUSSION
This study evaluated the individual and combined diagnostic ability of ADC, Gleason score, and PSA in detecting metastasis in patients with PCa. The key findings were: (1) Patients with PCa metastasis had significantly lower ADC values, higher Gleason scores, and higher PSA levels compared to those without metastasis; (2) Individually, an ADC cut-off of ≤549.00 mm2/s was the best marker for detecting metastasis; and (3) The combined bioscore model including PSA, ADC, and Gleason score was the best independent predictor, correlating with a 159-fold increased likelihood of detecting PCa metastasis.
The superior diagnostic performance of the combined bioscore model aligns with emerging evidence supporting the use of multiparametric approaches in PCa management.13, 14 Previous studies have reported the value of integrating different biomarkers to enhance the accuracy of PCa diagnosis and risk stratification.11, 15, 16 For instance, Manetta et al.10 in their study on correlation between ADC values and Gleason score in evaluation of PCa, demonstrated that the combination of ADC and Gleason score improved the detection of clinically significant PCa compared to using any single marker alone.
The findings on the individual diagnostic ability of ADC, Gleason score, and PSA are also consistent with existing literature. Lower ADC values have been associated with more aggressive tumors and increased metastatic potential in PCa.11 This is attributed to the inverse relationship between ADC and tumor cellularity, as more cellular tumors exhibit restricted water diffusion and lower ADC values. Similarly, higher Gleason scores are well-established indicators of PCa aggressiveness and prognosis.16 Regarding PSA, while its limitations as a standalone marker are recognized, our study reinforces its additive value when considered alongside other biomarkers.
The potential clinical implications of this study are significant. The combined bioscore model, incorporating ADC, Gleason score, and PSA, could aid in the accurate identification of patients with PCa metastasis. This information is crucial for optimizing treatment strategies and improving patient outcomes. Patients with high-risk features, as identified by the bioscore model, may benefit from more aggressive management approaches, such as extended lymph node dissection or the use of systemic therapies, to address the metastatic potential.
Furthermore, the robust diagnostic performance of the combined bioscore model could help mitigate the challenges associated with overdetection and overtreatment of PCa. By providing a more accurate assessment of metastatic risk, clinicians can tailor treatment plans, potentially avoiding unnecessary interventions in low-risk patients and directing resources towards those with a higher risk of disease progression.
This study has several limitations that should be acknowledged. First, the retrospective design and single-center nature of the study may limit the generalizability of the findings. Second, the study did not include information on the treatment protocols followed after the diagnosis of PCa metastasis. The choice of treatment, including systemic therapies, radiation, or surgical interventions, could impact the long-term outcomes of these patients and influence the diagnostic accuracy of the assessed markers.
5 CONCLUSION
This study demonstrated that the combined bioscore model, incorporating ADC, Gleason score, and PSA, was the most reliable and accurate predictor of metastatic disease in patients with PCa. The individual diagnostic performance of these markers was also significant, with ADC emerging as a particularly sensitive and specific biomarker for detecting metastasis. The superior diagnostic ability of the combined bioscore model highlights the importance of integrating multiple biomarkers to enhance the risk stratification and management of PCa patients. By accurately identifying individuals with a higher likelihood of metastatic disease, clinicians can optimize treatment strategies and improve patient outcomes. However, further validation in larger, prospective, multicentric studies is needed to confirm the generalizability of these findings. Additionally, the integration of other emerging biomarkers and the incorporation of treatment data could provide a more comprehensive understanding of the diagnostic and prognostic value of this combined bioscore approach.
AUTHOR CONTRIBUTIONS
George Asafu Adjaye Frimpong: Conception and design of the study, drafting the article and revising it critically for important intellectual content. Evans Aboagye: Drafting the article or revising it critically for important intellectual content, analysis and interpretation of data. Osei Owusu-Afriyie: Revising the article critically for important intellectual content, interpretation of data. Kofi Christian Gyasi-Sarpong: Revising the article critically for important intellectual content, interpretation of data. Adwoa Owusua Asare: Revising the article critically for important intellectual content, interpretation of data. Charles Kwame Adofo: Revising the article critically for important intellectual content, interpretation of data. Bernard Delali Akpaloo: Revising the article critically for important intellectual content, interpretation of data. Emmanuel Asante: Analysis and interpretation of data. Ernest Osei-Bonsu: Revising the article critically for important intellectual content, interpretation of data.
ACKNOWLEDGMENTS
Authors are grateful to all research assistants and management of Spectra Health Imaging and Interventional Radiology, Ghana.
CONFLICT OF INTEREST STATEMENT
Authors declare that that there are no competing interest.
Open Research
DATA AVAILABILITY STATEMENT
All data generated or analyzed during this study are included in the manuscript and can be requested from the corresponding author upon reasonable request.


