The impact of body weight trajectory from childhood on chronic inflammation in adulthood: The Bogalusa Heart Study
ABSTRACT
Importance
The impact of long-term burden of excessive body weight, beginning in childhood, on inflammatory status in adulthood has been poorly described.
Objective
To characterize the longitudinal body mass index (BMI) trajectory from childhood and examine its relationship with inflammatory status in adulthood.
Methods
We included 1285 adults who had 4–15 repeat measurements of BMI from childhood to adulthood. The area under the curve (AUC) of growth curves was calculated to characterize long-term burden (total AUC) and trends (incremental AUC) of BMI.
Results
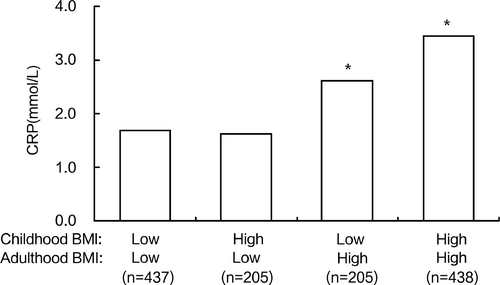
After adjusting for covariates, higher values of BMI in terms of childhood and adulthood, as well as total and incremental AUC, were strongly associated with elevated levels of adult C-reactive protein (CRP) in the four race-sex groups. There were significant differences in linear and nonlinear curve parameters between the normal and high CRP groups for all race-sex groups (P < 0.01). Compared with participants who had consistently low BMI in both childhood and adulthood, participants with high BMI in adulthood had higher CRP levels (P < 0.001), irrespective of their childhood BMI status; participants with high BMI in childhood but low BMI in adulthood had similar adult CRP levels.
Interpretation
The impact of excessive body weight on inflammation is cumulative and exacerbated over time. The influence of childhood overweight/obesity on inflammatory status in adulthood can be alleviated by reducing adiposity in adulthood.
1 INTRODUCTION
Low-grade inflammation is a mechanistic link between obesity and cardiometabolic disorders.1, 2 C-reactive protein (CRP) is a sensitive and dynamic physiological marker of systemic inflammation3 that has been associated with increased risks of diabetes4, 5 and cardiovascular disease,6, 7 independent of traditional cardiovascular risk factors. Obesity is a state of chronic inflammation that is characterized by elevated levels of inflammatory biomarkers.8-10 Several longitudinal studies, including ours, have demonstrated that childhood body mass index (BMI) is associated with levels of adult inflammatory biomarkers;11-13 however, the impact of longitudinal burden of excessive body weight from childhood to adulthood on inflammatory status has been poorly described.
Despite extensive evidence that long-term BMI trajectories during particular life periods are associated with biomarkers of inflammation,14 there has been limited information on detailed trajectory parameters of BMI across lifespan and their associations with inflammatory status in adulthood among races and sexes. Longitudinal studies followed from early life have indicated that the influence of childhood obesity on cardiometabolic risk in adulthood can be reversed by requiring normal weight by adulthood.15 However, it has been largely unclear whether a favorable change in body weight from childhood has a beneficial effect on inflammatory status in adulthood. In this study, we utilized longitudinal data from the Bogalusa Heart Study to examine the associations of cumulative burden and trajectory measures of body weight with systemic chronic inflammation in adulthood, as measured by CRP levels.
2 METHODS
2.1 Ethical approval
Study protocols were approved by the Institutional Review Board of the Tulane University Health Sciences Center. Written informed consent was obtained from each study participant or from a parent/guardian when appropriate at each examination.
2.2 Study participants
The Bogalusa Heart Study is a series of long-term epidemiologic studies in a semirural biracial community in Bogalusa, Louisiana.16 The study has conducted multiple cross-sectional surveys every 2 to 3 years from childhood. There were 9 cross-sectional surveys of children aged 4 to 19 years and 11 cross-sectional surveys of adults aged 20 to 51 years who were previously examined as children were conducted between 1973 and 2010. As a result, there were serial observations from childhood to adulthood in the same individuals. The present longitudinal study cohort consisted of 1285 adult subjects (893 whites and 392 blacks; 43.6% males; mean age is 40.8 years in the last survey). These participants had 4–15 measurements of BMI from childhood to adulthood (7.0 times on average, at least 2 times in childhood and at least 2 times in adulthood). The mean follow-up period was 31.1 years (range: 14.2–41.9 years) from the first children survey to the last adult survey.
2.3 Examinations
All measurements were obtained by trained staff members according to a standard protocol.16 In each survey, height and weight were measured in duplicate, and the mean values were used for analysis. BMI was calculated as weight in kilograms divided by height in meters squared to evaluate overall adiposity. Information on smoking and alcohol use was obtained by a standardized questionnaire. Current smoking and alcohol drinking were defined as smoking at least 1 cigarette per day and consuming alcohol every day, respectively, during the prior 12 months.
Venous blood samples were collected after fasting for at least 12 hours. CRP was measured in the last two adult surveys (i.e., 2004–2007 and 2008–2010). We used the last CRP measure in adulthood to make the follow period as long as possible. High-sensitive CRP was measured by latex particle-enhanced immunoturbidimetric assay on Hitachi 902 Automatic Analyzer.
2.4 Statistical methods
Random-effects mixed models were used to establish growth curves of BMI for each individual using multiple BMI measurements from childhood to adulthood.17-19 The area under the curve (AUC) was used as a measure of long-term burden and trends of BMI. For each participant, the AUC was calculated as the integral of the curve parameters during the follow-up period, and then the AUC values were divided by the number of follow-up years because of different follow-up periods among participants (Figure S1). Total AUC (a + b) was used to evaluate long-term cumulative burden of BMI and incremental AUC (a), determined by within-subject variability, were used to represent a combination of linear and nonlinear longitudinal trends.
Adult CRP was log-transformed before subsequent analyses due to its skewed distribution. Generalized linear model was performed to investigate the difference in mean levels of study variables and curve parameters between race and sex groups. We used multivariable linear regression models to examine the association of CRP with BMI in terms of childhood values (the first survey), adulthood values (the last survey), and total and incremental AUC values by race and sex, adjusted for adult age, smoking and alcohol drinking. Childhood, adulthood and AUC values of BMI were adjusted for childhood age, adulthood age and average age, respectively, by regression residual analyses in race-sex groups and then standardized by Z-transformation (mean = 0, SD = 1) before regression analysis. To assess the association of BMI status in childhood and adulthood with adult CRP, the participants were divided into four groups of low-low, high-low, low-high and high-high of childhood BMI-adulthood BMI using race-sex specific BMI medians as cut-offs.
3 RESULTS
In childhood, there were no significant racial and sex-related differences in obesity prevalence (Table 1). In adulthood, men had higher obesity prevalence among white participants, but lower obesity prevalence among black participants (44.8% for white men, 38.9% for white women, P < 0.05; 44.9% for black men, 59.4% for black women, P < 0.01). Moreover, race difference in obesity prevalence (white < black) was observed only among women. Race differences (white < black) in total AUC and incremental AUC of BMI were observed only in women. White men had higher total AUC and incremental AUC of BMI, compared with white women; however, black men had lower higher total AUC and incremental AUC of BMI, compared with black women. CRP levels showed sex-related differences (men < women) for both races and race differences (white < black) for both sexes.
| Characteristics | White | Black | P for race difference | |||
|---|---|---|---|---|---|---|
| Male (n = 402) | Female (n = 491) | Male (n = 158) | Female (n = 234) | Male | Female | |
| Childhood | ||||||
| Age (year) | 9.9 ± 3.3 | 9.8 ± 3.4 | 9.8 ± 3.0 | 9.5 ± 2.9 | 0.710 | 0.161 |
| BMI (kg/m2) | 17.9 ± 3.6 | 17.8 ± 3.7 | 17.4 ± 3.4 | 17.5 ± 3.7 | 0.185 | 0.285 |
| Obesity, n (%) | 23 (5.7) | 27 (5.5) | 12 (7.6) | 14 (6.0) | 0.410 | 0.792 |
| Adulthood | ||||||
| Age (year) | 41.0 ± 5.7 | 40.9 ± 5.7 | 40.9 ± 6.0 | 40.3 ± 5.9 | 0.859 | 0.209 |
| BMI (kg/m2) | 30.3 ± 6.1* | 29.4 ± 7.7 | 30.6 ± 7.9* | 32.7 ± 9.0 | 0.710 | <0.001 |
| Obesity, n (%) | 180 (44.8)* | 191 (38.9) | 71 (44.9)** | 139 (59.4) | 0.973 | <0.001 |
| Smoker, n (%) | 114 (28.4) | 148 (30.1) | 64 (40.5)** | 65 (27.8) | 0.006 | 0.513 |
| Drinker, n (%) | 140 (34.8)* | 207 (42.2) | 33 (20.9)** | 79 (33.8) | 0.001 | 0.031 |
| CRP (mmol/L) | 0.97 (0.43–2.34)** | 1.64 (0.60–3.73) | 1.30 (0.53–3.08)** | 2.61 (0.87–5.44) | 0.020 | <0.001 |
| Long-term measures | ||||||
| Average Age (year) | 23.6 ± 5.0 | 23.7 ± 4.9 | 23.0 ± 4.8 | 22.9 ± 4.3 | 0.189 | 0.029 |
| BMI AUCt (kg/m2) | 25.5 ± 4.6** | 24.5 ± 5.3 | 25.3 ± 5.3* | 26.8 ± 6.1 | 0.596 | <0.001 |
| BMI AUCi (kg/m2) | 7.7 ± 3.0** | 6.9 ± 3.9 | 7.8 ± 3.6** | 9.1 ± 4.5 | 0.646 | <0.001 |
- Data are presented as mean ± standard deviation or median (interquartile range) or n (%). Sex difference within racial groups: *P < 0.05; **P < 0.01. BMI, body mass index; CRP, C-reactive protein; AUCt, total area under the curve; AUCi, incremental area under the curve.
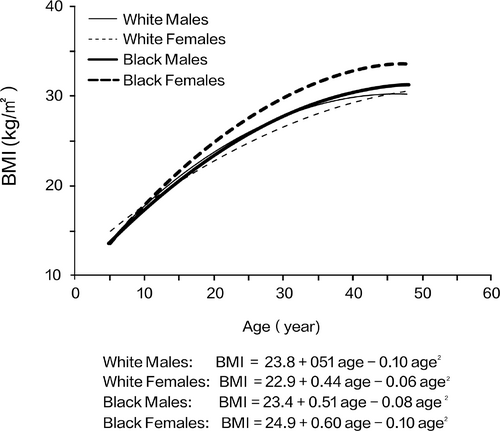
White men and black men had similar trajectories of BMI growth curves. However, black women had a more rapid increase than did other race-sex groups; this difference was discernible around the age of 15 years (Figure 1). White women tended to have a lower BMI than the remaining race-sex groups after the age of 20 years. Curve parameters (β0 + b0, β1 + b1 and β2 + b2) for BMI all differed from 0 (P < 0.001).

Race- and sex-specific linear regression analyses of the relationship between adult log-CRP level and BMI in terms of childhood, adulthood, and AUC values in four separate regression models are shown in Table 2. After adjusting for adult age, smoking status, and alcohol drinking status, all BMI measures were associated with adult CRP levels in all four race-sex groups. No sex differences in the effect size of BMI measures on CRP were observed except for adult BMI in whites (P = 0.013). No race differences in the effect size of BMI measures on CRP levels were observed, except for childhood BMI in women (P = 0.043) and adult BMI in men (P = 0.007). After additional adjustment for adult BMI, no significant associations between childhood BMI and adult CRP levels were found, except for the negative association in white women (β = −0.140, P < 0.01).
| BMI | White | Black | P for race difference | |||||
|---|---|---|---|---|---|---|---|---|
| Male | Female | P ‡ | Male | Female | P ‡ | Male | Female | |
| Childhood | 0.172 ± 0.049** | 0.137 ± 0.045* | 0.562 | 0.272 ± 0.078** | 0.242 ± 0.065** | 0.745 | 0.090 | 0.043 |
| Childhood† | −0.053 ± 0.059 | −0.140 ± 0.046* | 0.916 | −0.053 ± 0.090 | 0.045 ± 0.071 | 0.958 | 1.000 | 0.001 |
| Adulthood | 0.354 ± 0.048** | 0.473 ± 0.040** | 0.013 | 0.506 ± 0.072** | 0.404 ± 0.061** | 0.334 | 0.007 | 0.147 |
| AUCt | 0.314 ± 0.048** | 0.343 ± 0.043** | 0.472 | 0.401 ± 0.076** | 0.375 ± 0.061** | 0.841 | 0.127 | 0.517 |
| AUCi | 0.292 ± 0.050** | 0.342 ± 0.043** | 0.163 | 0.298 ± 0.082** | 0.252 ± 0.065** | 0.728 | 0.913 | 0.076 |
- Adult age, smoking, and alcohol drinking were included in the models for adjustment. †adjusted for adult BMI; ‡P-values for comparison of regression coefficients between sexes. *P < 0.01; **P < 0.001. BMI, body mass index; CRP, C-reactive protein; AUCt, total area under the curve; AUCi, incremental area under the curve.
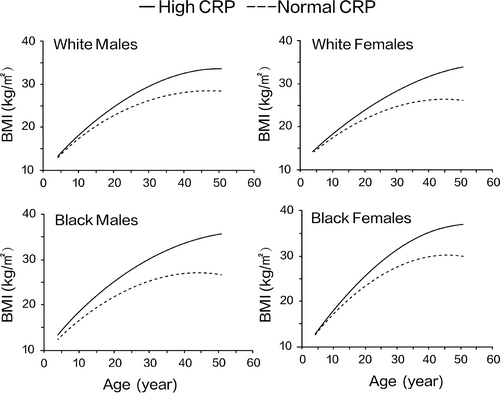
Growth curves of BMI from childhood to adulthood in normal and high adult CRP groups according to race and sex are shown in Figure 2. Normal and high CRP levels were defined by the median values. The high CRP group showed consistently higher BMI from childhood to adulthood in all four race-sex groups; the differences in BMI between the two CRP groups became greater with age.

Table 3 presents detailed information concerning the curve parameters in normal and high adult CRP groups according to race and sex. No race and sex differences in values of any curve parameters were found in the normal and high CRP groups. All curve parameters (β0 + b0, β1 + b1, and β2 + b2) of BMI all differed from 0 (P < 0.001). Adults with high CRP levels, compared with those with normal CRP levels, had greater values of all curve parameters (β0 + b0, β1 + b1, and β2 + b2) of BMI in each race-sex group, except for smaller β2 + b2 in the high CRP group in white men.
| Variables | White | Black | P for race difference | |||
|---|---|---|---|---|---|---|
| Male | Female | Male | Female | Male | Female | |
| High/Normal CRP, n | 201/201 | 245/246 | 79/79 | 117/117 | – | – |
| β0+b0 (kg/m2) | ||||||
| High | 24.8 ± 4.9 | 23.8 ± 5.6 | 24.9 ± 5.7 | 26.2 ± 6.1 | 0.983 | 0.682 |
| Normal | 22.7 ± 3.8 | 21.9 ± 4.1 | 21.8 ± 3.4 | 23.6 ± 4.6 | 0.804 | 0.703 |
| P † | <0.001 | <0.001 | <0.001 | <0.001 | – | – |
| β1+b1 (kg·m−2·yr−1) | ||||||
| High | 0.55 ± 0.19 | 0.51 ± 0.27 | 0.59 ± 0.23 | 0.68 ± 0.32 | 0.843 | 0.554 |
| Normal | 0.46 ± 0.15 | 0.37 ± 0.19 | 0.44 ± 0.17 | 0.52 ± 0.23 | 0.897 | 0.459 |
| P † | 0.008 | <0.001 | 0.009 | 0.010 | – | – |
| β2+b2 (kg·m−2·yr−2) | ||||||
| High | −0.103 ± 0.082 | −0.063 ± 0.101 | −0.077 ± 0.097 | −0.097 ± 0.106 | 0.816 | 0.698 |
| Normal | −0.090 ± 0.059 | −0.067 ± 0.069 | −0.091 ± 0.058 | −0.098 ± 0.095 | 1.000 | 0.708 |
| P † | 0.006 | <0.001 | <0.001 | 0.003 | – | – |
- Data are shown as mean ± standard deviation. High and normal CRP was defined by its median. Curve parameters were all different from 0 (P < 0.001). Sex differences were not found for all comparisons. †P-values for difference in βs between high and normal CRP groups were adjusted for average age, with additional adjustment for β0+b0 for β1+b1 and β2+b2. BMI, body mass index; CRP, C-reactive protein; –, not applicable.
Figure 3 presents covariates adjusted adult CRP levels, according to childhood and adult BMI statuses in all participants. Compared with participants who ha d consistently low BMI in both childhood and adulthood, participants with high BMI in adulthood had higher CRP levels (P < 0.001), irrespective of their BMI status in childhood. In contrast, there were no differences in adult CRP levels between participants who had high childhood BMI but low adult BMI and participants who had consistently low BMI. Finally, all analyses were repeated after excluding 59 participants with CRP levels > 10 µg/dL; the results were similar to those of the original analysis (data was not shown).

4 DISCUSSION
This longitudinal analysis demonstrated that BMI values measured in childhood and adulthood, as well as lifelong burden and trends (AUCs), were positively and significantly associated with adult CRP levels in multiple race-sex groups. Adults with high CRP levels had distinct long-term BMI trajectories from childhood, compared with adults who exhibited normal CRP levels. In addition, compared with participants with low BMI in both childhood and adulthood, participants with high BMI in adulthood had higher CRP levels, regardless of their childhood BMI status. However, participants with high BMI in childhood but low BMI in adulthood had adult CRP levels similar to those of participants with consistently low BMI. These findings suggest that the high chronic inflammation state among overweight/obese children may be improved by reducing adiposity status.
Adipose tissue, particularly intra-abdominal adipose tissue, is a highly active metabolic and endocrine organ. It secretes various inflammatory mediators, including cytokines, acute phase reactants, and growth factors.20, 21 These inflammatory mediators (e.g., tumor necrosis factor-α and interleukin-6) can reach the liver through the portal vein and thus regulate the hepatic production of CRP.22 Many previous studies have demonstrated a strong cross-sectional association between obesity and inflammatory markers.8-10 Several lifelong studies, including the Bogalusa Heart Study, have investigated associations between excessive adiposity in childhood and biomarkers of chronic inflammation in adulthood.11-13, 23 A birth cohort study in India showed that weight gain between the ages of 2 and 11 years was positively associated with adult CRP levels, as well as the levels of two other inflammatory biomarkers (fibrinogen and plasminogen activator inhibitor-1).12 Data from the Childhood Determinants of Adult Health study in Australia showed that higher childhood BMI was associated with elevated levels of CRP and fibrinogen 20 years later.13 The Young Finns Study found that childhood BMI was predictive of adult CRP levels, independent of obesity, blood pressure, lipid levels, smoking status, and insulin level.23
These prior studies were limited to single BMI measurements in childhood and thus could not investigate the long-term burden of excessive adiposity from childhood. In the present study with repeated measurements of BMI revealed that childhood BMI, as well as its long-term cumulative burden and trends from childhood, were predictive of elevated CRP levels in middle adulthood. These observations suggest that excessive adiposity in early life and its lifelong burden play a vital role in the process of chronic inflammation. It needs to be pointed out that CRP levels were within normal limits in most adults in our general population cohort. Although childhood BMI and its long-term measures (i.e., cumulative burden and trends) exhibited significant associations with adult inflammatory status, the biological significance and underlying mechanisms must be addressed in further studies. Some previous studies have demonstrated significant associations between DNA methylation and BMI in children.24, 25 High BMI in childhood may affect inflammation in adulthood through the induction of DNA hyper- or hypo-methylation.
Consistent with several previous studies,26-28 our results showed sex and race differences in CRP levels, with women and blacks having higher CRP levels than their respective counterparts (i.e., men and whites). We also observed that white women had a stronger association between BMI and CRP level, compared with white men; black men had a stronger association between BMI and CRP level, compared with white men. These findings were supported by a recent large meta-analysis involving 51 cross-sectional studies, which showed that the magnitude of the association between BMI and CRP level was greater in women than in men.8 The race and sex differences in CRP levels and their associations with BMI may be partially explained by the disparate prevalence of traditional cardiovascular risk factors between sexes and races. Furthermore, women and blacks have more body fat mass (compared with men and whites, respectively), which secretes adipokines such as interleukin-6 and leptin.29
Several lifelong studies have reported that distinct trajectories of BMI from childhood are associated with cardiometabolic risk.30, 31 The Young Finns study identified six discrete long-term BMI trajectories from childhood to adulthood; it demonstrated that individuals who had consistently high BMI had an increased cumulative cardiovascular risk load in mid-adulthood.30 However, limited information is available regarding the trajectory parameters of longitudinal BMI profile from childhood and their relationships with inflammatory status in adulthood. In the current study, we found that lifelong BMI trajectories differed among adults according to their CRP levels, such that the high CRP group had higher BMI values and greater rates of increase over time. The difference in BMI between the two CRP groups became greater with age. These observations indicate that the impact of excessive body weight on inflammation is cumulative and exacerbated throughout life.
In the current study, we found that childhood BMI was not associated with adult CRP after adjusting for current adult BMI in the linear regression models. Stratified analyses of childhood and adult BMI values demonstrated that adult CRP levels depended on adult BMI, instead of childhood BMI. These results suggest that the influence of excessive body weight in childhood on inflammatory status is mainly mediated through adult body weight. This mediation effect of adult BMI was also noted in the four large-scale longitudinal cohorts followed since childhood in the International Childhood Cardiovascular Cohort Consortium for childhood BMI in relation to type 2 diabetes, hypertension, dyslipidemia, and carotid-artery atherosclerosis.15
The main strength of our study is its repeated longitudinal measurements of BMI from childhood to adulthood, which allowed for characterizing BMI trajectory parameters and evaluating long-term burden of excessive adiposity from childhood. However, this study had several limitations. First, BMI was used to evaluate overall obesity in this study, but it could not distinguish between fat mass and lean mass. Second, we used only CRP levels to measure chronic inflammatory status among the participants; more inflammatory biomarkers (e.g., fibrinogen, interleukin-6, and tumor necrosis factor-α) should be measured in future studies. Third, CRP levels in childhood were not measured in our study cohort; thus, we could not examine the influence of childhood BMI on the progression of CRP levels from childhood to adulthood. Fourth, children at baseline had much lower obesity prevalence than today’s children; therefore, caution is needed when generalizing the results in the current study to today’s childhood population.
In summary, BMI values in childhood and adulthood, as well as lifelong burden and trends, were positively associated with adult chronic inflammatory status, as measured by CRP levels. The impact of excessive adiposity in childhood on inflammation in adulthood was mainly mediated through adult body weight, suggesting that the adverse effect of childhood overweight/obesity can be reversed by reducing weight before adulthood. The findings underscore the importance of lifelong weight control in improving chronic inflammatory status and thus reducing future cardiovascular risk.
5 Funding source
The National Heart, Lung and Blood Institute (R01HL121230); the National Institute of Aging (R03AG060619); the National Institute of General Medical Sciences of the National Institutes of Health (P20GM109036); the National Natural Science Foundation of China (81803254)
CONFLICT OF INTEREST
None declared.


