Comprehensive behavioral analysis of heterozygous Syngap1 knockout mice
[Correction added on 25 July 2019, after first online publication: ORCID information was added for Keizo Takao, Noboru H. Komiyama, Seth G. N. Grant, and Tsuyoshi Miyakawa.]
Abstract
Aims
Synaptic Ras GTPase-activating protein 1 (SYNGAP1) regulates synaptic plasticity through AMPA receptor trafficking. SYNGAP1 mutations have been found in human patients with intellectual disability (ID) and autism spectrum disorder (ASD). Almost every individual with SYNGAP1-related ID develops epilepsy, and approximately 50% have ASD. SYNGAP1-related ID is estimated to account for at least 1% of ID cases. In mouse models with Syngap1 mutations, strong cognitive and affective dysfunctions have been reported, yet some findings are inconsistent across studies. To further understand the behavioral significance of the SYNGAP1 gene, we assessed various domains of behavior in Syngap1 heterozygous mutant mice using a behavioral test battery.
Methods
Male mice with a heterozygous mutation in the Syngap1 gene (Syngap1−/+ mice) created by Seth Grant's group were subjected to a battery of comprehensive behavioral tests, which examined general health, and neurological screens, rotarod, hot plate, open field, light/dark transition, elevated plus maze, social interaction, prepulse inhibition, Porsolt forced swim, tail suspension, gait analysis, T-maze, Y-maze, Barnes maze, contextual and cued fear conditioning, and home cage locomotor activity. To control for type I errors due to multiple-hypothesis testing, P-values below the false discovery rate calculated by the Benjamini-Hochberg method were considered as study-wide statistically significant.
Results
Syngap1−/+ mice showed increased locomotor activity, decreased prepulse inhibition, and impaired working and reference spatial memory, consistent with preceding studies. Impairment of context fear memory and increased startle reflex in Syngap1 mutant mice could not be reproduced. Significant decreases in sensitivity to painful stimuli and impaired motor function were observed in Syngap1−/+ mice. Decreased anxiety-like behavior and depression-like behavior were noted, although increased locomotor activity is a potential confounding factor of these phenotypes. Increased home cage locomotor activity indicated hyperlocomotor activity not only in specific behavioral test conditions but also in familiar environments.
Conclusion
In Syngap1−/+ mice, we could reproduce most of the previously reported cognitive and emotional deficits. The decreased sensitivity to painful stimuli and impaired motor function that we found in Syngap1−/+ mice are consistent with the common characteristics of patients with SYNGAP-related ID. We further confirmed that the Syngap1 heterozygote mouse recapitulates the symptoms of ID and ASD patients.
1 INTRODUCTION
SYNGAP is a GTPase highly enriched at excitatory synapses in the brain 1, 2. Several members of the Ras superfamily of GTPases, including Rap1/2, Ras, and Rab5 3-6, are inhibited by SYNGAP. SYNGAP levels in the dendritic spine are reduced by neuronal activation 7. The reduction in SYNGAP leads to Ras activation and AMPA receptor incorporation into the membrane, both of which are required for long-term potentiation 6, 8, dendritic spine formation 9, and neuronal development 10.
De novo SYNGAP1 mutations have been found in patients with ID, epilepsy, or ASD 11-20. In a large-scale developmental disorders study, seven SYNGAP1 mutations were identified in 940 patients with ID; therefore, the frequency of SYNGAP1 mutations is suggested to be ∼0.74% in patients with ID 19. Currently, 0.7%-1% of ID patients are estimated to have SYNGAP1-related ID 18. A study, which recruited 57 male patients with SYNGAP1 mutations or microdeletions, reported 55 cases of ID 21. These patients also showed epilepsy (98%) and developmental delays (96%), and 53% of the participants were diagnosed with ASD 21. These symptoms were accompanied by severe language impairments (21%); high pain threshold (72%); eating problems including oral aversion (68%); hypotonia (67%); sleeping problems (62%); ataxia or gait abnormalities (51%); and behavioral problems (73%) including aggression, self-injury, and tantrums 21.
To study the effects of SYNGAP1 mutations, Syngap1 knockout mice have been generated by several groups 9, 10, 22-24. Homozygous Syngap1 knockout mice die within a week of birth 10, 22. In heterozygous Syngap1 knockout (Syngap1−/+) mice, robust changes in behavioral phenotypes have been reported by several groups (see Table S4). Syngap1−/+ mice show increased locomotor activity 23, 25-29, decreased anxiety-like behavior 6, 23, 25, 26, 28, 29, impaired reference spatial memory 22, 26, 27, and impaired working spatial memory 23, 26, 28, 29. In addition, increased stereotypic behavior 25, decreases in motor functions in females 26, elevated startle response and a decrease in prepulse inhibition 25, reduced social novelty preference 25, and impaired cued fear memory 25 have been reported by preceding studies. However, some observations are inconsistent across the different studies. In Syngap1−/+ mice, impairment of contextual fear memory has been reported by two groups 23, 28, while another report failed to detect this behavioral change 25. One study observed decreased anxiety-like behavior in the number of open-arm entries in the elevated plus maze 26, whereas another report did not observe similar findings 25. While human patients with Syngap1 mutations have a high pain threshold, eating problems, ataxia or gait abnormalities, hypotonia, and sleeping problems 21, there have been no reports of such behavioral phenotypes in Syngap1−/+ mice.
Compared to previous reports 6, 23, 25-30, only a few studies have assessed the behavioral phenotypes of the Syngap1−/+ mouse line generated by Komiyama et al22, 29. In the present report, we evaluated the behavioral phenotypes of Syngap1−/+ mice generated by Komiyama et al22 on a C57BL/6J genetic background, which have been backcrossed at least 10 generations from the original F2 MF1 genetic background. To study the behavioral phenotypes of genetically modified mice, it is valuable to generate them with a common genetic background of a well-understood wild-type phenotype. The C57BL/6J genetic background is widely adopted by knockout and transgenic researches 31. This is also a major background of the Syngap1−/+ mouse lines used in preceding behavioral studies 25, 28, 30.
In this report, we utilized a comprehensive set of well-defined behavioral tests 31-38 and investigated behavioral phenotypes including the sensorimotor functions and the cognitive functions of the Syngap1−/+ mice generated by Komiyama et al on a C57BL/6J genetic background.
2 METHODS
2.1 Animals and experimental design
Syngap1−/+ mice were generated as previously described 22. The mice were backcrossed to the C57BL/6J mice (Charles river, MA, USA), for at least ten generations, which is also expected to minimize genetic drift. Wild-type (WT) and Syngap1−/+ mice were generated by crossing male Syngap1−/+ mice and WT female mice. The same population of male mice older than 53 weeks were sequentially subjected to different behavioral tests (for the age of the mice and order of the tests, see Table S1). Mice were housed two to four per cage (one to three for each genotype) in a room with a 12-hour light/dark cycle (lights on at 7:00 am), with access to food and water ad libitum. Room temperature was kept at 23 ± 2°C. Behavioral tests were performed between 9:00 am and 6:00 pm. Before the tests, mice were left in the testing room for at least 30 minutes to allow acclimation, unless otherwise noted. After each test, the testing apparatus was cleaned with super hypochlorous water to prevent a bias due to olfactory cues, unless otherwise noted.
2.2 Behavioral tests
Unless otherwise noted, most of the behavioral tests were performed as previously described 39-41.
2.3 Neurological screen and neuromuscular strength test
The righting, whisker twitch, and ear twitch reflexes were evaluated. Physical features, including the presence of whiskers or bald hair patches, were also recorded. A grip strength meter (O'HARA & Co.) was used to assess forelimb grip strength. The peak force applied by the forelimbs of the mouse was recorded in Newtons (N). Each mouse was tested three times, and the greatest value measured was used for data analysis. In the wire hang test, the mouse was placed on a wire mesh that was then slowly inverted, so that the mouse gripped the wire in order not to fall off. Latency to fall was recorded, with a 60 seconds cutoff time.
2.4 Rotarod test
Motor coordination and balance were tested using the rotarod test. This test, which uses an accelerating rotarod (UGO Basile), was performed by placing mice on rotating drums (3 cm diameter), made of polyvinyl chloride (PVC), and measuring the time each animal was able to maintain its balance on the rod. The speed of the rotarod was accelerated from 4 to 40 rpm over a 5-minute period. All the mice were subjected to the test without any pretest training.
2.5 Hot plate test
The hot plate test was used to evaluate sensitivity to a painful stimulus. Mice were placed on a 55.0°C hot plate with black anodized aluminum floor (Columbus Instruments), and latency to the first fore- or hind paw response was recorded with a 15 seconds cutoff time. The paw response was defined as either a paw lick or a foot shake.
2.6 Open field test
Each mouse was placed in the corner of the open field apparatus (40 × 40 × 30 cm; Accuscan Instruments) which consists of white plastic floor and transparent Plexiglas wall. The apparatus was illuminated at 100l×. Total distance traveled (cm), vertical activity, time spent in the center area (20 × 20 cm), and beam-break counts for stereotyped behaviors were recorded. Immediately after the mice were placed in the arena, their behavior was recorded for 120 minutes.
2.7 Light/dark transition test
A light/dark transition test was conducted as previously described 42. The apparatus consisted of a cage with a white floor made of PVC (21 × 42 × 25 cm) divided into two sections of equal size by a partition with a door (O'HARA & Co., Tokyo, Japan). One chamber was brightly illuminated (390 lux), whereas the other chamber was dark (two lux). Mice were placed into the dark chamber and allowed to move freely between the two chambers with the door open for 10 minutes. The total number of transitions, latency to first enter the lit chamber, distance traveled, and time spent in each chamber were recorded by Image LD software (see Section, “Data Analysis2.17”). In cases with the mice did not enter the light compartment during the entire 10-minutes session, the latency to light was considered as 600 seconds, and the data were included in the statistical analysis.
2.8 Elevated plus maze test
An elevated plus maze test was conducted as previously described 43. The elevated plus maze consisted of two open arms (25 × 5 cm) and two enclosed arms of the same size with 15 cm high transparent walls, and the arms were connected by a central square (5 × 5 cm) (O'HARA & Co., Tokyo, Japan). The open arms were surrounded by a raised ledge (3 mm thick and 3 mm high) to avoid mice falling off the arms. The arms were elevated 55 cm above the floor. Arms of the same type were located opposite from each other. Each mouse was placed in the central square of the maze, facing one of the enclosed arms. All the arms and walls were made of PVC. The number of entries into the open and enclosed arms and the time spent in the open or enclosed arms were recorded during a 10-minute test period. Percentage of entries into open arms, time spent in open arms(s), number of total entries, and total distance traveled (cm) were calculated. When a mouse falls from the maze, the data were excluded from the statistical analysis for distance traveled, entries into open arms, time on open arms, and number of entries. Data acquisition and analysis were performed automatically, using Image EP software (see Section, “Data analysis2.17”).
2.9 Social interaction test in a novel environment
In the social interaction test, two mice of identical genotypes that were previously housed in different cages were placed in a white PVC plastic box together (40 × 40 × 30 cm) (O'HARA & Co.) and allowed to explore freely for 10 minutes. Behavior was recorded and analyzed automatically using Image SI program (see Section, “Data analysis2.17”). The total number of contacts, total duration of active contacts, total contact duration, mean duration per contact, and total distance traveled were measured. If the two mice contacted each other and the distance traveled by either mouse was longer than 10 cm, the behavior was classified as an “active contact.”
2.10 Crawley's sociability and social novelty preference test
This test is a well-designed method to investigate the effect of complex genetics on sociability and preference for social novelty 44, 45. The testing apparatus consisted of a rectangular, three-chambered PVC plastic box and a lid with an infrared video camera (O'HARA & Co.). Each chamber was 20 × 40 × 47 cm, and the dividing walls were made from clear PVC plastic, with small square openings (5 × 3 cm) allowing access into each chamber. We modified the method described by ref. 45 as follows: A habituation session was performed in the apparatus for 10 minutes the day before the sociability test, and the wire cages in the lateral compartments were located in the corners of each compartment. In the sociability test, an unfamiliar C57BL/6J male mouse (stranger) that had no prior contact with the subject mice was placed in one of the side chambers. The location of the stranger mouse (stranger side) in the left vs right side chamber was systematically alternated between trials. The cage was 11 cm in height, with a bottom diameter of 9 cm, and vertical bars 0.5 cm apart. The subject mouse was first placed in the middle chamber and allowed to explore the entire test box for a 10-minute session. The amount of time spent in each chamber and distance traveled were measured with a camera fitted on top of the box. In the social novelty preference test, each mouse was tested in a 10-minute session to quantify social preference for a new stranger. After the first 10-minute session, a second unfamiliar mouse was placed in the chamber that had been empty during the first 10-minute session. This second stranger was also enclosed in an identical small wire cage. The amount of time spent in each chamber and distance traveled during the second 10-minute session were measured as described above. Data acquisition and analysis were performed automatically using Image CSI (see Section, “Data analysis2.17”).
2.11 Startle response/prepulse inhibition (PPI) test
A startle reflex measurement system (O'HARA & Co.) was used to measure acoustic startle response and PPI. Before this test, mice were kept in a soundproof room separate from the testing room. A test session began by placing a mouse in a transparent PVC plastic cylinder where it was left undisturbed for 10 minutes. White noise (40 ms) was used as the startle stimulus for all trial types. The startle response was recorded for 400 ms starting with the onset of the startle stimulus. The background noise level in each chamber was 70 dB. A test session consisted of six trial types (ie, two types for startle stimulus-only trials, and four types for PPI trials). The intensity of the startle stimulus was 110 or 120 dB. The prepulse sound was presented 100 ms before the startle stimulus, and its intensity was 74 or 78 dB. Four combinations of prepulse and startle stimuli were used (74-110, 78-110, 74-120, and 78-120 dB). Six blocks of the six trial types were presented in a pseudo-random order, such that each trial type was presented once within a block. The average inter-trial interval was 15 seconds (range 10-20 seconds).
2.12 Porsolt forced swim test
A Plexiglas cylinder (20 cm height × 10 cm diameter) filled with water (21-23°C) up to a height of 7.5 cm was put in a white plastic chamber (31 × 41 × 41 cm) (O'HARA & Co.). Mice were placed into the cylinder, and both immobility and the distance traveled were recorded over a 10-minute test period. Images were captured at 2-frame per second. For each pair of successive frames, the amount of area (pixels) with in which the mouse moved was measured. When the amount of area was below a certain threshold, mouse behavior was classified as “immobile.” Immobility lasting for <2 seconds was not included in the analysis. Data acquisition and analysis were performed automatically, using Image TS software (see Section, “Data analysis2.17”).
2.13 Gait analysis
We analyzed gait of the mice during walk/trot locomotion by ventral plane videography as described 46, 47 using DigiGait Imaging System (Mouse Specifics Inc). This system enables mice to walk on a motorized transparent treadmill belt, and the software automatically identifies the stance and swing components of stride and calculates stance width, stride length, step angle, and paw angle. Briefly, we placed the mice on a treadmill belt that moves at a speed of 24.7 cm/s. We collected digital video images of the underside of mice at 150 frames per second.
2.14 Tail suspension test
The tail suspension test was performed for a 10-minute test session. Mice were suspended 30 cm above the floor of a white plastic chamber (31 × 41 × 41 cm) (O'HARA & Co.), and the behavior was recorded over a 10-minute test period. As similar to the Porsolt forced swim test, immobility (%) was judged by the application program. Data acquisition and analysis were performed automatically using ImageTS software (see Section “Data analysis2.17”).
2.15 T-maze test
The spontaneous alternation task was conducted using an automatic T-maze apparatus (O'HARA & Co.) as previously described 48. It was constructed of white PVC plastic runways with 25-cm high walls. The maze was partitioned off into six areas by sliding doors that can be opened downward. The stem of the T was composed of area S2 (13 × 24 cm), and the arms of T were composed of areas A1 and A2 (11.5 × 20.5 cm). Areas P1 and P2 were the connecting passageways from the respective arm (area A1 or A2) to the start compartment (area S1). Mice were subjected to a spontaneous alternation protocol for five sessions, with at least 1 day (2 days maximum) of session-to-session intervals. One session consists of 10 trials with a 50-minute cutoff time. Each trial had first and second runs. On the first run, the mouse was forced to choose one of the arms of the T (area A1 or A2). After the mouse stayed more than 10 seconds, the door that separated the arm (area A1 or A2) and the connecting passageway (area P1 or P2) would be opened, and the mouse could return to the starting compartment (area S1) via the connecting passageway. The mouse was then given a 3-second delay in area S1, followed by a free choice between both T arms. The percentage of trials in which mice entered the arm opposite to their forced-choice run during the free choice run was calculated. The location of the sample arm (left or right) varied pseudo-randomly across trials using the Gellermann schedule so that mice received equal numbers of left and right presentations. Data acquisition, control of sliding doors, and data analysis were performed by ImageTM software (see Section, “Data Analysis2.17”).
2.16 Y-maze test
Y-maze test was performed as previously described 49. Exploratory activity was measured using a Y-maze apparatus (arm length: 40 cm, arm bottom width: 3 cm, arm upper width: 10 cm, height of wall: 12 cm). The floor of the maze is made of white PVC plastic, and the wall is made of transparent PVC plastic. Each subject was placed in the center of the Y-maze field. The number of entries and alterations was recorded using a modified version of the ImageYM software. Data were collected for a period of 10 minutes.
2.17 Barnes maze test
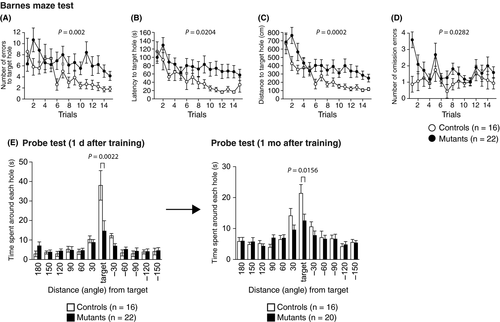
The Barnes maze task was conducted on “dryland,” 1.0 m in diameter, with 12 holes equally spaced around the perimeter (O'HARA & Co.). The maze is made of PVC plastic. A black Plexiglas escape box (17 × 13 × 7 cm), which had paper cage bedding on its bottom, was located under one of the holes. The hole above the escape box represented the target. The location of the escape box (target) was consistent for a given mouse but randomized across mice. The maze was rotated daily, with the spatial location of the target unchanged with respect to the distal visual room cues, to prevent a bias based on olfactory or proximal cues within the maze. One trial per day was conducted for the first five trials. From the sixth trial, two trials were performed per day. Each trial ended when the mouse entered the escape box or after 5 minutes had elapsed. The number of errors (defined by the animal placing its nose in a hole that did not lead to the escape box), the amount of time that the mice took to enter the box, total distance traveled to target hole, and the number of omission errors (defined by the visit to the target hole without subsequent entry into the target hole) were recorded by ImageBM software. On day 7, a probe test was conducted without the escape box, to assess memory based on distal environmental room cues. Another probe trial was conducted 1 month after the last training session to evaluate memory retention. The time spent around the target hole was recorded in these probe tests by the software.
2.18 Contextual and cued fear conditioning test
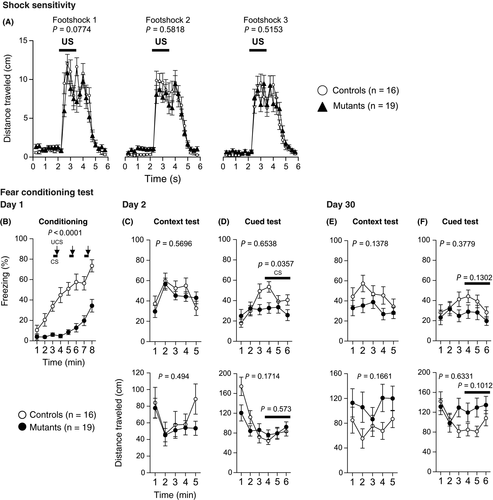
Contextual and cued fear conditioning test was performed as previously described 50-52. Before this test, mice were kept in a soundproof room separate from the testing room. To assess fear-related learning and memory, each mouse was placed in an acrylic chamber consisting of white (side) and transparent (front, rear, and top) PVC plastic walls (33 × 25 × 28 cm) with a stainless-steel grid floor (0.2 cm diameter, spaced 0.5 cm apart; O'HARA & CO.), and was allowed to explore freely for 2 minutes 52. Subsequently, a conditioned stimulus (CS; 55 dB white noise) was presented for 30 seconds, followed by a mild foot shock (2 seconds, 0.3 mA), which served as the unconditioned stimulus (US). Two more CS-US pairings were presented with 2-minute interval. Context test was conducted 1 day after conditioning in the same chamber for 300 seconds on each mouse. A cued test with an altered context was conducted in a triangular chamber at least 100 minutes after the context test on the same day (33 × 29 × 32 cm; made of white acrylic plastic walls and floor, which was located in a different room). After a 3-minute free-moving period in the triangular chamber, tone stimulus for the cued test (55 dB white noise) was applied for 180 seconds. In each test, freezing percentage and distance traveled (cm) were calculated automatically using ImageFZ software (see Section, “Data analysis2.17”). After each trial in the conditioning test, the walls and grids of the chamber were wiped with super hypochlorous water and 65% ethanol, respectively. In the cued test, the walls and floor were cleaned with super hypochlorous water.
2.19 Social interaction in home cage
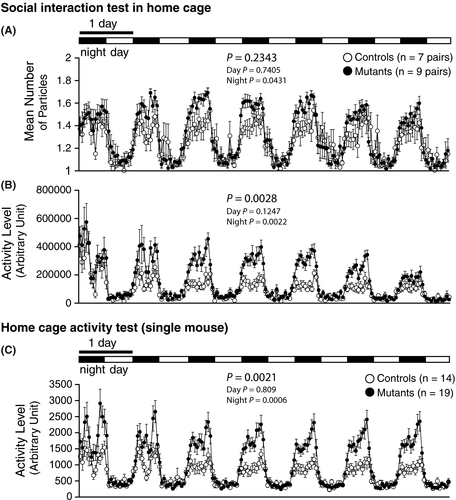
To monitor social behavior between two mice in a familiar environment, a system that automatically analyzes social behavior in home cages of mice was used as previously described 53. Two genetically identical mice that had been housed separately were placed together in a home cage (see Section, “locomotor activity monitoring in home cage2.16”). Their social behavior was then monitored for 7 days. Outputs from the video cameras were fed into a computer. Images from each cage were captured at a rate of one frame per second. Social interaction was measured by counting the number of particles in each frame: Two particles indicated the mice were not in contact with each other; and one particle demonstrated contact between the two mice. We also measured locomotor activity during these experiments by quantifying the number of pixels changed between each pair of successive frames.
2.20 Locomotor activity monitoring in home cage
Locomotor activity monitoring in home cage was performed with a system that automatically analyzes the locomotor activity of mice in their home cage 53. The system contains a home cage (29 × 18 × 12 cm), a filtered cage top, and an infrared video camera which is attached to the top of a stand. Each mouse was individually housed in each home cage, and their locomotor activity was monitored for a week. Outputs from the video cameras were fed into a computer. Images from each cage were captured at a rate of one frame per second, and distance traveled was measured automatically using Image HA software (see Section, “Data analysis2.17”).
2.21 Data analysis
Behavioral data were obtained automatically through applications based on the ImageJ program, and they were modified for each test by Tsuyoshi Miyakawa (available through O'HARA & Co.). The ImageJ plugins, and the precompiled plugins for light/dark transition test (Image LD), elevated plus maze (Image EP), open field test (Image OF), fear conditioning test (Image FZ), and T-maze (Image TM) are freely available on the website of “Mouse Phenotype Database” (http://www.mouse-phenotype.org/software.html) 54. Statistical analysis was conducted using StatView (SAS Institute). Data were analyzed using two-tailed t test, one-way ANOVA, two-way repeated measures ANOVA, and chi-squared test. Values in graphs are expressed as mean ± SEM. To control for type I errors due to multiple-hypothesis testing, we calculated the false discovery rate (FDR) by the Benjamini-Hochberg method 55. We defined “study-wide significance” as the statistical significance that survived FDR correction. “Nominal significance” was defined as the one that achieved a statistical significance in an index (P < .05) but did not survive this correction.
3 RESULTS
Statistical data for these results are presented in Tables S2 and S3. In the results section, P-values with a study-wide significance are labeled with asterisks (*P < .05, **P < .01, and ***P < .001). P-values with “#”indicate a nominal significance.
3.1 General characterization of Syngap1−/+ mice
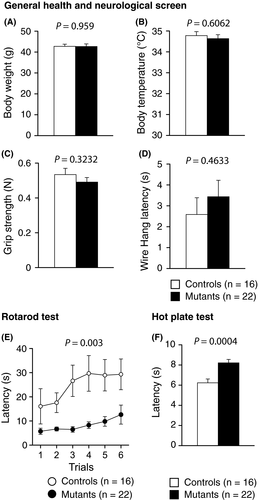
There were no significant differences between the Syngap1−/+ and WT mice in terms of body weight (Figure 1A, P = .959), body temperature (Figure 1B, P = .6062), grip strength (Figure 1C, P = .3232), or latency to fall off the wire grid (Figure 1D, P = .4633). As shown in Figure 1E, the mutant mice showed an impaired motor function (P = .003**), as assessed by the rotarod test. The interaction between genotype and trial in the rotarod test was not significant (P = .064). Gait analysis test did not reveal any difference between SYNGAP1−/+ and control mice (data are available in the Mouse Phenotype Database described in the data analysis2.17 section). In the hot plate test, Syngap1−/+ mice exhibited decreased pain sensitivity. (Figure 1F, P = .0004**).
3.2 Increased locomotor activity of Syngap1 −/+ mice in the open field test
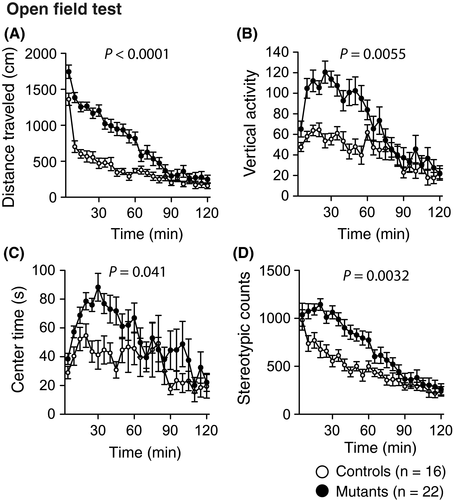
In the open field test, Syngap1−/+ mice exhibited significant increases in the total distance traveled (Figure 2A, P < .0001***), number of vertical activities (Figure 2B, P = .0055*), center time (Figure 2C, P = .041#), and stereotypic counts (Figure 2D, P = .0032**) compared with those in the control mice.
3.3 Normal light/dark transition of Syngap1−/+ mice
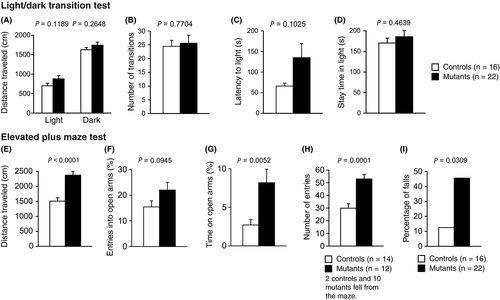
The light/dark transition test detected no significant differences between the mutant mice and WT mice in the distances traveled between the light/dark compartments (Figure 3A, light, P = .1189; dark, P = .2648), number of transitions between light/dark compartments (Figure 3B, P = .7704), latency to enter the light compartment (Figure 3C, P = .1025), or time spent in the light compartment (Figure 3D, P = .4639). There were two Syngap1−/+ mice which did not enter the light compartment during the entire 10-minute session.
3.4 Increases in locomotor activity and open-arm time of Syngap1−/+ mice in the elevated plus maze
In the elevated plus maze test, Syngap1−/+ mice showed a significant increase in the total distance traveled in arms (Figure 3E, P < .0001***). There was no significant difference in percentage of entries into the open arms (Figure 3F, P = .0945) between genotypes. Percentage of time spent in open arms and the total number of entries were significantly increased in the mutant mice (Figure 3G, P = .0052*; Figure 3H, P = .0001***). There were 10 Syngap1−/+ mice and two control mice which fell from the maze of which data were excluded from the statistical analysis (Figure 3E-H). The mutant mice showed a significantly higher incidence of a fall from the maze than the control mice (Figure 3I, P = .0309#).
3.5 Social behavior in Syngap1−/+ mice
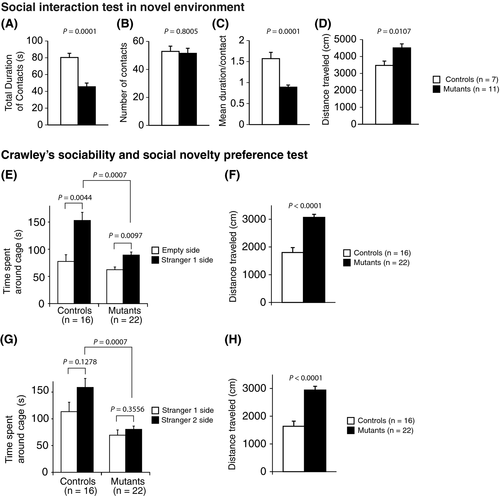
In the social interaction test, Syngap1−/+ mice exhibited a significant decrease in total duration of contacts (Figure 4A, P = .0001**). There was no difference between Syngap1−/+ mice and WT mice in the total number of contacts (Figure 4B, P = .8005). Mean duration per contact was significantly decreased in the mutant mice (Figure 4C, P = .0001**). The mutant mice traveled a longer distance than the control mice (Figure 4D, P = .0107*). The mice were also subjected to a Crawley's sociability and social novelty preference test which is composed of a sociability test and a social novelty preference test. In the sociability test, social behavior can be assessed based on the time spent around a wire cage with an unfamiliar mouse (stranger side) vs the time spent around an empty cage (empty side). Both the mutant and WT mice spent more time around the stranger-side cage than the empty-side cage (Figure 4E, WT: P = .0044*, mutant: P = .0097*). Compared to mutants, WT mice stayed longer around the stranger side (Figure 4E, P = .0007**). The mutant mice showed a significant increase in the total distance (Figure 4F, P < .0001***). In the social novelty preference test, both WT and Syngap1−/+ mice tended to spend longer time around the stranger 2-sided cage; however, they were not statistically significant (Figure 4G, WT: P = .1278, Syngap1−/+: P = .3556). WT mice stayed longer around the stranger side of the cage (Figure 4G, P < .0007**) than did the mutants. The mutant mice showed a significant increase in total distance (Figure 4H, P = .0007**).
3.6 Decreased prepulse inhibition of the acoustic startle response in Syngap1−/+ mice
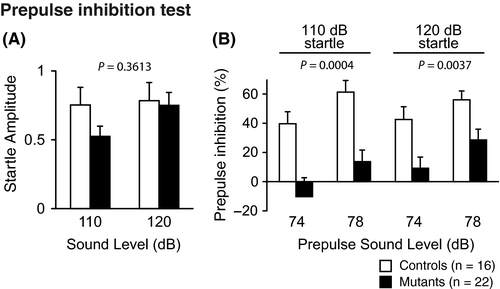
In the prepulse inhibition test, there was no significant difference between the Syngap1−/+ and WT mice in the startle amplitude (Figure 5A, P = .3613). Syngap1−/+ mice showed a significantly decreased prepulse inhibition of the startle response compared with WT mice (Figure 5B, 110 dB, P = .0004**; 120 dB, P = .0037**).
3.7 Decreased immobility of Syngap1−/+ mice in the tests for depression-like behavior
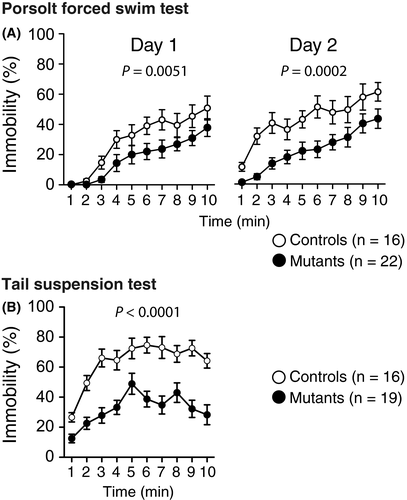
In the Porsolt forced swim test, Syngap1−/+ mice exhibited a significantly decreased immobility time on day 1 and day 2 (Figure 6A, P = .0051* and P = .0002**, respectively). Likewise, in the tail suspension test, Syngap1−/+ mice showed a significantly decreased immobility time (Figure 6B, P < .00001***).
3.8 Increased locomotor activity and impaired working memory of Syngap1−/+ mice in the T-maze
A T-maze spontaneous alternation task was performed to compare the working memory between the WT and Syngap1−/+ mice 48. The percentage of correct responses of Syngap1−/+ mice was lower than that of the WT mice (Figure 7A, P = .0031**). Syngap1−/+ mice and WT mice showed no obvious differences in latency to complete a session (Figure 7B, P = .0785). Syngap1−/+ mice traveled a longer distance to complete a session (Figure 7C, P = .0003**) than the WT mice.
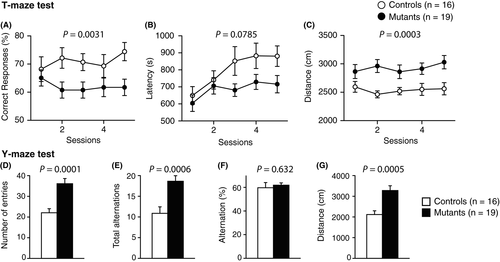
In the Y-maze, Syngap1−/+ mice demonstrated an increased number of entries (Figure 7D, P = .0001**) and total alternations (Figure 7E, P = .0006**). Percentage of alternations in the total number of entries was not different between the genotypes (Figure 7F, P = .632). Total distance was significantly increased in Syngap1−/+ mice (Figure 7G, P = .0005**).
3.9 Impaired spatial reference memory in Syngap1−/+ mice
In the Barnes maze test, Syngap1−/+ mice showed an increase in the following indices: number of errors before reaching the target hole (Figure 8A, P = .002**), latency to reach the target hole (Figure 8B, P = .0204*), distance to reach the target hole (Figure 8C, P = .0002**), and number of omission errors before reaching the target hole (Figure 8D, P = .0282#). Probe trials wherein the escape box was removed were performed 1 day after training and a month after the last day of training. Syngap1−/+ mice spent less time around the target during these probe tests (Figure 8E; 1 day, P = .0022**; 1 month, P = .0156*) than the WT mice.
3.10 Decreased freezing of Syngap1−/+ mice during conditioning in contextual and cued fear conditioning test
There was no significant difference between Syngap1−/+ and WT mice in the distance traveled before, during, or after each foot shock during the conditioning period (Figure 9A, foot shock 1, P = .0774; foot shock 2, P = .5818; and foot shock 3, P = .5153). Syngap1−/+ mice exhibited a significant decrease in the percentage of freezing during conditioning (Figure 9B, P = .0001***). During 2nd day of testing, there were no differences between genotypes in the percentage of freezing (Figure 9C top, P = .5696) or in the distance traveled (Figure 9C bottom, P = .494). In the cued test on day 2, Syngap1−/+ mice showed decreased freezing during the sound representation (Figure 9D top, P = .0357#). There was no difference in distance traveled (Figure 9D bottom, P = .573) between the genotypes. In the context testing 30 days after the fear conditioning, there were no significant differences in freezing (Figure 9E top, P = .1378) or in distance traveled (Figure 9E bottom, P = .1661) between the genotypes. In the cued testing after 30 days, freezing (Figure 9F top, P = .1302) and distance traveled (Figure 9F bottom, P = .1012) during the tone representation were not significantly different between the genotypes.
3.11 Home cage activities of Syngap1−/+ mice
In the social interaction test in home cage, an increased mean number of particles of Syngap1−/+ mice were observed during night (Figure 10A; whole period, P = .2343; day, P = .7405; night, P = .0431#), though this did not survive FDR correction. Syngap1−/+ mice exhibited more locomotor activity during the night (Figure 10B; whole period, P = .0028; day, P = .1247; night, P = .0022**) than the WT mice. In the home cage activity test with single mouse in a cage, Syngap1−/+ mice showed increased activity level during the night (Figure 10C; whole period, P = .0021; day, P = .809; night, P = .0006**).
4 DISCUSSION
In this study, we subjected male Syngap1−/+ mice on a C57BL/6J genetic background to a comprehensive behavioral test battery. In agreement with previous behavioral studies which are using different Syngap1−/+ mouse lines, we have reproduced most of the previously reported behavioral phenotypes: increased locomotor activity 23, 25-29; decreased prepulse inhibition 25; impaired working 23, 26, 28, 29; and reference spatial memory 22, 26, 27. Similar to a preceding report 25, heterozygous Syngap1 knockout mice showed a decrease in cued fear memory in our study, even though this failed to reach a study-wide significance. While weakened contextual fear memory 23, 28 and increased startle reflex 25 of the mutant mice have been previously reported, we failed to reproduce these phenotypes. In addition, we found that these mice showed a decreased sensitivity to painful stimuli and impaired motor function (see Table S4).
The decreased sensitivity to painful stimuli of Syngap1−/+ mice is consistent with a previous study which reported a high pain threshold in 72% of SYNGAP-related ID patients 21. On the other hand, two preceding studies failed to detect altered thermal nociception in Syngap1−/+ mice 26, 30. Duarte et al30 showed that capsaicin-induced thermal hypernociception occurred at lower doses of capsaicin in Syngap1−/+ mice than in WT mice. However, this study did not detect altered nociception in these mice without the injection of capsaicin. Differences in the time course of heat application may have led to the inconsistencies in paw-withdrawal latency in Syngap1−/+ mice between other studies and ours 26, 30, 56. Duarte et al30 and Muhia et al26 used instruments which apply gradually increasing heat stimuli 56-58. On the other hand, our hot plate provides immediate heat at 55 ℃. We also found that male Syngap1−/+ mice have impaired motor function as assessed by the accelerating rotarod test. Learning effects in the mutant mice were not detected in the same test. The loss of motor function and the difficulty in motor learning of these mutant mice may correspond to ataxia or gait abnormalities similar to human SYNGAP1-related ID patients 13, 16, 18, 21, 59, 60, although the possible confounding effect of hyperlocomotor activity cannot be excluded in this apparent performance deficit of the mutants in the rotarod test. On the other hand, Muhia et al26 did not find such motor dysfunctions in male mutant mice assessed by the accelerating rotarod test. Such inconsistencies across studies may be due to variations in the deletion site of the Syngap gene, genetic background, and/or age of the mice. Duarte et al used a Syngap mutant mice on a C57BL/6J background 10, 30, of which exon cassette containing the first common methionine present in Syngap-c gene was chosen for deletion 10. Muhia et al employed a mutant mouse line on a C57BL/6 background (substrain not specified) 9, 26, wherein exons 4 to 9 within the Syngap gene were completely deleted. In our study, we used mutants with a C57BL/6J background, lacking the codon for arginine 312 (or 470) of the Syngap gene 1, 2, 22. In addition to the variations in the mutation site, there is a difference in the age of the animals studied. Muhia et al26 started the behavioral tests when the mice were 10-12 weeks old. On the other hand, our mice were 53-56 weeks old at the beginning of the test battery. Based on a report demonstrating the effects of age on various behavioral domains in C57BL/6J mice 32, possible age-dependency of the phenotypes in the mutant mice should be taken into consideration. In this study, female Syngap1−/+ mice were not tested. Several previous studies have reported that many behavioral phenotypes were shared between male and female Syngap1−/+ mice 6, 22, 23, 25-27, while Muhia et al26 reported a decreased latency to fall in the rotarod test only in females. Further studies are necessary to clarify the effect of sex on the phenotypes of the Syngap1−/+ mouse line that we used in the present study.
In the elevated plus maze, Syngap1−/+ mice stayed on the open arm for a significantly longer time than WT mice, which is normally interpreted as a decreased anxiety-like behavior 61. Several groups have also reported increased open-arm stay time for Syngap1−/+ mice in the elevated plus maze 6, 23, 25, 26, 28, 29. Muhia et al and Guo et al25, 26 investigated the confounding effect of elevated locomotor activity on the increased open-arm time in the elevated plus maze and claimed that mutant mice have abnormal anxiety levels . Muhia et al26 analyzed the first 2 minutes of the elevated plus maze test, in which activity levels did not differ between the two genotypes, and speculated that the observed increase in entries and time spent in the open arms by the mutant mice were not confounded by enhanced locomotor activity. Guo et al25 also argued that mutant mice did not properly perceive danger, and the increased open-arm time was not related to a generalized or novelty-induced hyperactivity, because there were no differences between genotypes in the number of open or total arm entries. On the other hand, Kilinc et al6 claimed that it was unclear if the increased time in the open arms of the mutant mice reflects reduced anxiety or an increased exploratory drive, or both. Overall, it is still unclear whether Syngap1−/+ mice have a decreased anxiety. However, a study reported anxious behavior in patients with Syngap1 mutations 62. Some researchers have speculated that the increased exploration of the open arms may reflect an increased panic-like escape response to stress and/or a higher level of anxiety 32, 53, 63-65. For example, Schunurri-2 knockout mice, which lack a major histocompatibility complex binding protein, show increased open-arm exploration in addition to higher plasma corticosterone levels 32, 64. Further investigations are therefore necessary to clarify the link between Syngap1 gene mutations and anxiety.
While many studies have shown elevated locomotor activities of Syngap1−/+ mice in novel environments in various behavioral tests 23, 25-29, activity in familiar environment has not yet been tested 6. In the present study, we observed the home cage locomotor activity of these mice and found that they have a significantly increased locomotor activity at night, which indicates that these mice show hyperlocomotor activity not only in novel, but also in familiar environments.
Collectively, we confirmed that the Syngap1−/+ mouse recapitulates the symptoms of ID and ASD in patients with SYNGAP1 mutations. A reduction in Syngap1 levels dramatically affected locomotor activity, cognitive functions, emotion, pain sensation, and motor function. However, the association between SYNGAP and anxiety needs to be reconsidered. These findings also provide clues to physiological roles of SYNGAP-regulated pathways. Our analysis of Syngap1−/+ mice can prove to be an invaluable model for further investigations of ID and ASD patients with SYNGAP1 mutations.
ACKNOWLEDGMENTS
We thank Keiko Toyama, Mika Tanaka, Yoshihiro Takamiya, and Nao Hirata for their technical support in this study. This work was supported by the following grants: MEXT KAKENHI Grant Numbers JP221S0003, JP16H06462, JP16H06276; JSPS KAKENHI Grant Number JP16680015; AMED under Grant Number JP18dm0107101; and Simons Initiative for the Developing Brain grant R83776.
CONFLICT OF INTEREST
The authors have no conflicts of interest to declare.
DATA REPOSITORY
The raw data of the behavioral tests and the information about each mouse are accessible on the public database “Mouse Phenotype Database” (http://www.mouse-phenotype.org/).
ANIMAL STUDIES
All the behavioral tests were carried out in the Section of Behavior Patterns, Center for Genetic Analysis of Behavior, National Institute for Physiological Sciences. All the experimental protocols were approved by the Animal Care and Use Committee of the National Institute for Physiological Sciences.


