Metabolite-cycled echo-planar spectroscopic imaging of the human heart
[Correction added on 7 July 2022, after first online publication: CSAL funding statement has been added.]
Click here for author-reader discussions
Abstract
Purpose
Spectroscopic imaging could provide insights into regional cardiac triglyceride variations, but is hampered by relatively long scan times. It is proposed to synergistically combine echo-planar spectroscopic imaging (EPSI) with motion-adapted gating, weighted acquisition and metabolite cycling to reduce scan times to less than 10 min while preserving spatial-spectral quality. The method is compared to single-voxel measurements and to metabolite-cycled EPSI with conventional acquisition for assessing triglyceride-to-water (TG/W) ratios in the human heart.
Methods
Measurements were performed on 10 healthy volunteers using a clinical 1.5T system. EPSI data was acquired both without and with motion-adapted gating in combination with weighted acquisition to assess TG/W ratios and relative Cramér-Rao lower bounds (CRLB) of TG. For comparison, single-voxel (PRESS) spectra were acquired in the interventricular septum.
Results
Bland–Altman analyses did not show a significant bias in TG/W when comparing both metabolite-cycled EPSI methods to PRESS for any of the cardiac segments. Scan time was 8.05 ± 2.06 min and 17.91 ± 3.93 min for metabolite-cycled EPSI with and without motion-adapted gating and weighted acquisition, respectively, while relative CRLB of TG did not differ significantly between the two methods for any of the cardiac segments.
Conclusions
Metabolite-cycled EPSI with motion-adapted gating and weighted acquisition allows detecting TG/W ratios in different regions of the in vivo human heart. Scan time is reduced by more than 2-fold to less than 10 min as compared to conventional acquisition, while keeping the quality of TG fitting constant.
1 INTRODUCTION
Proton MRS has been shown to be a valuable tool to study cardiac triglyceride (TG) levels,1 which have appeared to change in heart failure, diabetes mellitus, metabolic syndrome, and aortic stenosis.2-5 While single-voxel spectroscopy only provides information from a single volume in the interventricular septum and is therefore primarily relevant when global alterations are studied, spectroscopic imaging could provide insights into regional TG variations, as is required in, for example, myocardial ischemia, infarction, and other cardiac diseases.6, 7
Although proton spectroscopic imaging has been performed in the heart before,8 relatively long scan times, even when using fast spectroscopic imaging techniques,9 hamper clinical applications. Part of the cause of long scan times is associated with respiratory motion sensitivity and therefore the need for respiratory gating or triggering10, 11 using, for example, respiratory navigators.12-14 Conventionally, profiles in k-space are acquired in a predefined order, and the gating window is the same for all profiles. As an alternative, motion-adapted gating15 may be used. Here, the order of the k-space profiles is no longer predefined but is dependent on the respiratory motion state. Profiles in the center of k-space are acquired close to end-expiration, while a larger navigator window is allowed for outer profiles. While this already lowers scan times, additional scan time reductions can be achieved using weighted acquisition.16 Conventionally, an equal amount of signal averages is acquired per profile in k-space, while filtering is performed during postprocessing to reduce side lobes of the point spread function and therefore partial volume effects. This step in postprocessing can be translated to acquisition by acquiring more signal averages for central k-space profiles than for outer k-space according to a predefined filter function.
A further reduction in exam time can be achieved by applying metabolite cycling,17 which, as opposed to water-suppressed spectroscopic imaging, does not require the acquisition of a separate water-unsuppressed reference scan. In metabolite cycling, the metabolite signals are inverted for half of the signal averages by exploiting a frequency-selective inversion pulse.18-20 The metabolite spectrum is subsequently obtained by subtraction of averages obtained with and without metabolite inversion, while the water signal is obtained by addition. Other advantages of metabolite cycling are the ability to perform phase correction on the high-SNR water signal, which can be especially beneficial in small voxels, and the possibility to perform B0 correction for every voxel and every average individually. While cycling methods have already been applied to single-voxel spectroscopy in the human heart21-23 and to spectroscopic imaging in the brain24-26 and in human calf muscle,27 metabolite cycling in combination with cardiac spectroscopic imaging has not yet been demonstrated.
The objective of the present work was to implement metabolite-cycled echo-planar spectroscopic imaging (EPSI28) both with motion-adapted gating and weighted acquisition and with conventional acquisition and compare both methods to single-voxel measurements and to each other for assessing triglyceride-to-water ratios in the human heart.
2 METHODS
2.1 In vivo measurements
Measurements were performed on 10 healthy volunteers (age = 28.37 ± 4.66 years, body mass index [BMI] = 23.0 ± 2.9 kg/m2, 5 male) following written informed consent and according to ethics and institutional guidelines. Data was acquired using a 1.5T Achieva scanner (Philips Healthcare, Best, the Netherlands) using a five-channel cardiac receiver array. An anatomical survey was acquired using standard navigator-gated short-axis and four-chamber cine balanced SSFP images with following parameters: TR = 3.3 ms, TE = 1.65 ms, flip angle = 60°, in-plane resolution = 1.5 mm, slice thickness = 8 mm, and 50 cardiac phases.
Metabolite-cycled EPSI was implemented by adding an optimized Hwang pulse19, 21, 22, 29 with a length of 50 ms and a maximum RF amplitude of 9 μT before a local-look EPSI sequence13 (Figure 1). Frequency modulation and offset of the Hwang pulse were inverted for half of the total number of averages acquired per scan.
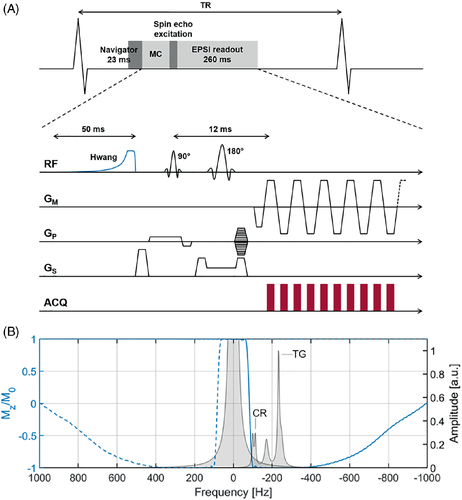
For motion-adapted gating,15 the actual displacement of the diaphragm was monitored using a respiratory navigator positioned on the lung–liver interface, and a cubic weighting function was used to control which line in k-space had to be measured accordingly. Motion-adapted gating was combined with weighted acquisition, in which a Hamming function determined the number of signal averages acquired per line in k-space.16
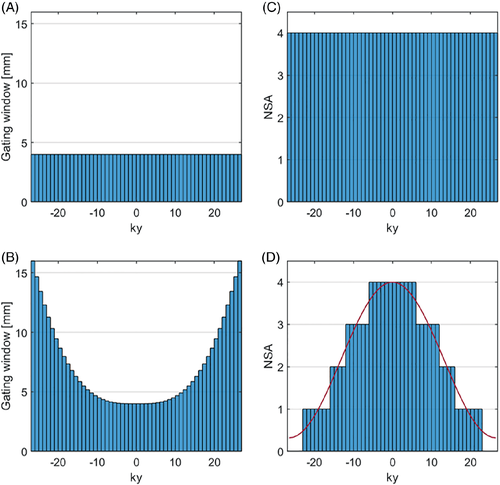
Metabolite-cycled EPSI data was acquired both without and with motion-adapted gating in combination with weighted acquisition in an equatorial slice in short-axis view. Conventional navigator gating with a gating window of 4 mm was used in the first case (Figure 2A), whereas diaphragm displacements with a maximum gating window of 16 mm (outer k-space) and a minimum gating window of 4 mm (central k-space) were considered for motion-adapted gating (Figure 2B). Of the total number of acquired averages, half were inverted upfield and half were inverted downfield of the water resonance.18 The number of acquired averages was the same for all k-space profiles for conventional acquisition (Figure 2C), while it was reduced for specific lines in k-space for weighted acquisition (Figure 2D).
EPSI data was acquired in an equatorial slice in short-axis view (Figure 3). The FOV was 300 × 150 mm2 with a slice thickness of 15 mm and a field of excitation of 300 × 75 mm2 to avoid signal contamination from tissue outside the region of interest. The voxel size was 3 × 3 × 15 mm3 (0.135 ml), TR was one heartbeat, TE was 12 ms, spectral bandwidth was 1064 Hz, and spectral resolution was 4.2 Hz. Prior to EPSI data acquisition, first-order iterative localized shimming (number of iterations = 2) was performed in a breath hold. The in-plane size of the shim volume was adjusted to the size of the systolic left ventricle in short-axis view, ranging from 56 × 58 mm2 to 72 × 72 mm2. The thickness of the shim volume was 35 mm for all subjects.

For comparison, single-voxel spectra were acquired in the interventricular septum (Figure 3) using a PRESS sequence30 with reduced spoiler areas31 to reduce cardiac motion sensitivity. Scan parameters were as follows: voxel size = 10 × 20 × 40 mm3 (8 ml), minimum TR = 2000 ms, TE = 22 ms, spectral bandwidth = 2000 Hz, spectral resolution = 1.95 Hz. Chemical-shift selective water suppression32 (excitation bandwidth = 100 Hz) was performed, and a total number of 96 water-suppressed and 16 water-unsuppressed averages was acquired. The navigator was used for respiratory gating (window = 4 mm).12 First-order pencil-beam volume shimming was performed during preparation using a 15 × 25 × 45 mm3 volume. Regional saturation slabs were positioned on the anterior and posterior chest wall to suppress spurious fat signals. Both EPSI and PRESS measurements were electrocardiogram-triggered to end-systole.
2.2 Reconstruction
Both EPSI and PRESS data were reconstructed in MATLAB using customized reconstruction pipelines implemented in MRecon (GyroTools, Winterthur, Switzerland).
For EPSI, complex coil maps were calculated for coil combination, and spectral ghosts caused by delays between even and odd readout gradients were minimized.33 B0 correction was performed for every voxel in every single average individually; the position of the water peak was detected and accordingly shifted in the frequency domain. A Hamming filter was applied to the k-space data in both spatial dimensions (EPSI without weighted acquisition) and in x-direction (EPSI with weighted acquisition) to reduce side lobes of the point spread function. As the Hamming weighting function is only approximated by the discrete number of averages in case of weighted acquisition (Figure 2D), profiles in y-direction were multiplied with a correction factor with denoting the total number of averages for each profile 16 This resulted in an effective spatial resolution of 4.4 × 4.4 mm234 for EPSI both with and without weighted acquisition. Phase correction was applied using the water signal of every voxel in every single average; upfield-cycled and downfield-cycled averages were averaged separately subsequently. Water spectra were calculated by addition of the mean upfield-cycled and downfield-cycled spectra; subtraction was performed to obtain metabolites.
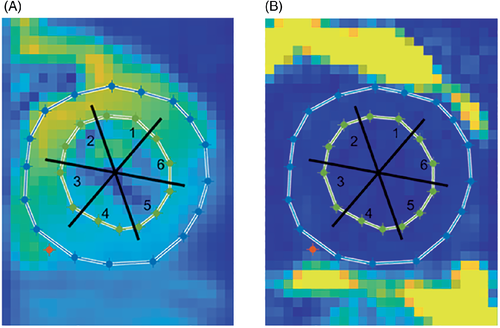
For analysis, the heart was divided into six segments. The first points of the FIDs (mean over all acquired averages) were used to create a spatial reference image (Figure 4A). As a second spatial reference, a fat image was constructed using the intensities of the metabolite spectra at −217 Hz (Figure 4B). Care was taken not to include epicardial fat when drawing the epicardial contours. Finally, all spectra within each of the segments were averaged.
For the PRESS data, noise decorrelation was performed and the water-unsuppressed averages were used to calculate coil channel weights to perform coil combination using a singular value decomposition approach.35 Phasing was performed on the individual water peaks for the water-unsuppressed averages and on the main TG resonance at 1.28 ppm for the water-suppressed averages36 before averaging. Water-unsuppressed spectra were frequency-corrected based on their individual water peaks; a global frequency correction based on the average water frequency shift was performed for the water-suppressed spectra.
2.3 Data analysis
The EPSI spectra were zero-filled to a total number of 512 points and apodized with a Lorentzian function of 1.5 Hz for display purposes only.
Both EPSI and PRESS spectra were fitted in the time domain using AMARES37 (jMRUI38 version 5.2). Residual water peaks were removed from all metabolite spectra using Hankel Lanczos singular value decomposition,39 and spectra were fitted using five resonances: triglycerides at 0.88, 1.28 and 2.1 ppm, creatine (CR) at 3.03 ppm and trimethylammonium (TMA) at 3.2 ppm. All triglyceride peaks were fitted using Gaussian line shapes, whereas CR and TMA were fitted with Lorentzian shapes. Relative chemical shifts were fixed, and relative phases were set to zero for all metabolites. The linewidth of the TG peak at 1.28 ppm was set equal to the linewidth of the TG peak at 0.88 ppm to avoid potential overestimation of TG/W due to erroneous broad peaks; beyond these settings there were no restrictions on linewidths and amplitudes. Water spectra were fitted using Lorentzian line shapes and linewidth was assessed.
TG was defined as the sum of the fitted resonances at 0.88 and 1.28 ppm. A correction for T1 and T2 relaxation was applied using values of T1 = 970 ms40 and T2 = 40 ms41 for myocardial water and T1 = 280 ms42 and T2 = 80 ms43 for TG. The TG/W ratios were calculated as metabolite amplitudes divided by the fitted water signal. TG/W comparisons were performed for all segments of both metabolite-cycled EPSI methods versus PRESS using Bland–Altman analyses. Coefficients of variation (CV) were calculated as the SD of the differences divided by the mean.
Relative Cramér-Rao lower bounds (CRLB) were calculated for the TG signal at 1.28 ppm for all segments of both conventional metabolite-cycled EPSI and metabolite-cycled EPSI with motion-adapted gating and weighted acquisition, and were defined as the Cramér-Rao lower bounds divided by the fitted TG amplitudes.
One-sample t-tests were used to test whether the mean differences in the Bland–Altman analyses were statistically significant from zero. Paired t-tests were used for the statistical analysis regarding relative CRLBs and linewidth of the water peak. A p-value < 0.05 was considered significant. Variables are presented as mean ± SD.
3 RESULTS
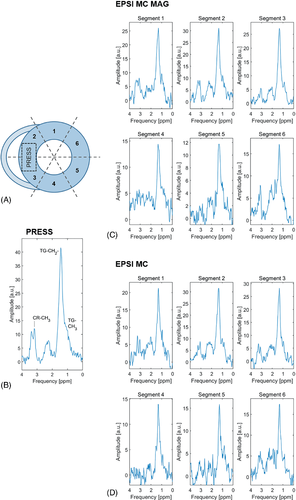
Exemplary spectra of all six EPSI segments for both EPSI methods together with the PRESS spectrum of the same subject are shown in Figure 5 for comparison. Although spectral quality of EPSI is worse compared with PRESS, myocardial TG can be detected in all EPSI regions. Assignment of creatine is not possible in all segments. Data quality is similar for EPSI with and without motion-adapted gating, and weighted acquisition and is best in segments 2 and 3, given the proximity of these sectors to the surface coil array.
Bland–Altman analyses of TG/W ratios are shown in Figure 6. Data acquired using metabolite-cycled EPSI both with conventional acquisition (EPSI MC) and with motion-adapted gating and weighted acquisition (EPSI MC MAG) is compared to PRESS data for individual cardiac segments. The opacity of the different data points indicates the BMI values of the subjects. The CVs were found to be smallest for segment 3 (CV = 19.6% [EPSI MC MAG]/CV = 18.5% [EPSI MC]) and largest for segments 1 (CV = 35.2% [EPSI MC MAG]/CV = 28.6% [EPSI MC]), 4 (CV = 34.2% [EPSI MC MAG]/CV = 36.7% [EPSI MC]), and 6 (CV = 34.5% [EPSI MC MAG]/CV = 32.5% [EPSI MC]). The mean difference of TG/W between EPSI and PRESS was not significantly different from zero for any of the segments for any of the EPSI methods.
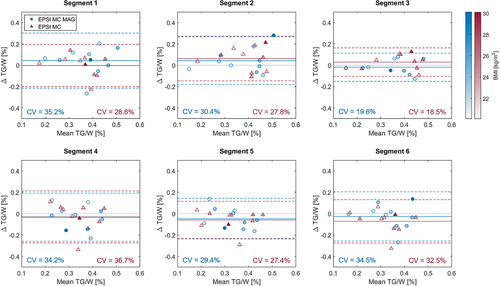
Scan time was 8.05 ± 2.06 min for metabolite-cycled EPSI with and 17.91 ± 3.93 min for metabolite-cycled EPSI without motion-adapted gating and weighted acquisition. Navigator efficiency was 47.6 ± 8.1% when both motion-adapted gating and weighted acquisition were applied, while it was 40.5 ± 7.0% for metabolite-cycled EPSI with conventional acquisition.
Figure 7 shows the distribution of the TG/W ratios acquired using EPSI with motion-adapted gating and weighted acquisition over the cardiac segments for all subjects, together with the ratios acquired using PRESS. No specific trend regarding TG/W distribution over the different segments is observed.
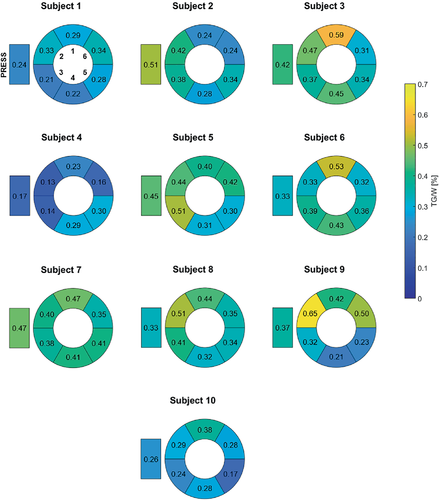
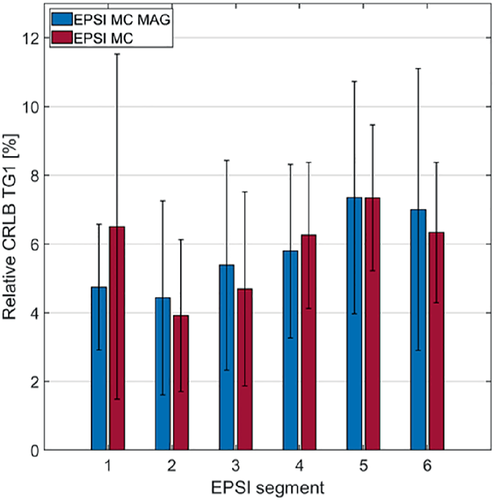
Figure 8 compares the relative CRLBs of the main TG peak at 1.28 ppm (TG1) between metabolite-cycled EPSI with (EPSI MC MAG) and without motion-adapted gating and weighted acquisition (EPSI MC) for all six cardiac segments. No significant differences were found between the two EPSI methods. Relative CRLBs of TG1 for PRESS were 0.83 ± 0.45%.
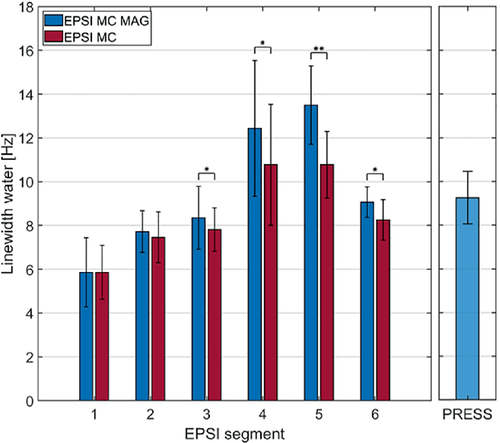
Mean and SD of the linewidth of the water peak are shown in Figure 9 for all segments of both EPSI methods and PRESS. Linewidths are largest in segments 4 and 5; these segments suffer from increased field inhomogeneity due to the presence of the posterior vein next to the left ventricle.44 Linewidths of the other EPSI segments are smaller compared to PRESS associated with the smaller voxel sizes in EPSI. Linewidths are significantly larger for segments 3 (p < 0.05), 4 (p < 0.05), 5 (p < 0.01), and 6 (p < 0.05) for EPSI with motion-adapted gating and weighted acquisition as compared to conventional metabolite-cycled EPSI.
To conclude, exemplary water and metabolite spectra from 1 subject acquired using metabolite-cycled EPSI with motion-adapted gating and weighted acquisition before averaging into cardiac segments can be found in Supporting Information Figure S1.
4 DISCUSSION
In this work, both metabolite-cycled EPSI with motion-adapted gating and weighted acquisition and metabolite-cycled EPSI with conventional acquisition were implemented. The performance of both methods was examined against water-suppressed single-voxel spectroscopy, and the two methods were compared to each other subsequently. Both metabolite-cycled EPSI methods showed similar results regarding TG/W ratios in comparison to PRESS. It has been shown that scan time can be reduced by more than 2-fold when motion-adapted gating in combination with weighted acquisition is applied, without a decrease in fit quality of the main TG resonance.
Metabolite-cycled EPSI has a number of advantages over water-suppressed EPSI. First, the total exam time is shorter, as no additional reference scan is required. In water-suppressed EPSI, a B0 map is calculated based on the reference water scan, and a B0 correction based on this map is applied to all water-suppressed averages. Using metabolite-cycled EPSI, the B0 shift can be calculated for every single average individually, which leads to improved B0 correction. Finally, phasing in metabolite-cycled EPSI can be performed on the high-SNR water signal as opposed to the low-SNR TG signal in water-suppressed EPSI.
A limitation of cardiac EPSI in general is the potential contamination of target segments with adjacent epicardial fat. Accordingly, segments were chosen carefully using both anatomical and fat maps to avoid tissue interfaces and partial volume voxels. Hamming filtering reduced the side lobes of the point spread function significantly, reducing chances of contamination with epicardial fat. Bland–Altman analyses did not show a significant overestimation of TG/W for any of the cardiac segments for both EPSI methods, and no apparent relation between underestimation or overestimation of TG/W and BMI was observed. The BMI values of the subjects measured were, however, relatively low; the risk of contamination with epicardial fat might be higher in subjects with higher BMI values.
The SNR efficiency is proportional to the nominal voxel size and the gating efficiency according to . As the gating efficiency was higher for EPSI with motion-adapted gating acd weighted acquisition (EPSI MC MAG) compared to EPSI with conventional acquisition (EPSI MC), SNR efficiency should theoretically be increased by 8.4% on average. The CRLBs can be assumed to be inversely proportional to SNR and did not show a significant difference between EPSI MC MAG and EPSI MC despite the more than 2-fold reduction in scan time. Given that the ratio of the total number of signal averages for EPSI MC to EPSI MC MAG was 1.89, and the fact that nominal k-space weighting and hence theoretical point spread functions were close to identical for both methods, it is argued that similar CRLBs between the methods can be associated with respiratory motion-related averaging in combination with respiratory state–dependent gating window adjustment and k-space ordering of EPSI MC MAG. It is perceivable that the larger gating window for higher spatial frequencies along ky with EPSI MC MAG resulted in motion-related phase scrambling, and hence in a reduction of signal amplitudes at higher ky, which in turn broadened the effective point spread function in y-direction with a resultant relative increase in SNR per voxel.
A disadvantage of the use of CRLBs of the main TG resonance at 1.28 ppm is the partial overlap with the TG peak at 0.88 ppm, complicating independent fitting. Together with the fact that inter-subject TG values vary, this can explain the relatively large SDs of the relative CRLBs as presented in this work.
Relative CRLBs were larger for both EPSI methods compared to PRESS. Care should, however, be taken when comparing these values directly, as voxel sizes and sequence parameters differ between EPSI and PRESS.
The larger CV as found for lateral segments can be explained by different factors. First, coil sensitivity is reduced in these areas and SNR is therefore lower compared to segments closer to the coil, leading to difficulties in fitting of the peaks. Apart from this, the presence of the posterior vein of the left ventricle containing deoxygenated blood causes the B0 field to be less homogeneous close to these segments. This is also reflected in the linewidths of the water peaks. Despite challenges acquiring appropriate spectra in these segments, the Bland–Altman analyses did not show a significant bias in TG/W compared to PRESS.
Linewidths of the water peak were significantly larger for the inferoseptal, inferior, inferolateral, and anterolateral segments when motion-adapted gating and weighted acquisition were applied as compared to conventional acquisition. This might imply that a larger navigator window for the outer regions of k-space has a larger effect on regions where B0 homogeneity is deteriorated, as no significant differences in linewidth were observed for the other cardiac segments.
One method that could potentially remedy the increased linewidths for EPSI with motion-adapted gating and weighted acquisition is volume tracking.45 In volume tracking, the measured displacement of the navigator is used to shift the volume of interest accordingly. Schär et al11 have shown that linewidths can decrease when a combination of tracking and navigator gating is applied as compared to navigator gating only. Future work on metabolite-cycled EPSI with motion-adapted gating and weighted acquisition could therefore benefit from the implementation of volume tracking.
Creatine could not be assigned in all cardiac segments. One of the reasons for this is the abovementioned line broadening in several segments, which can cause CR and TMA to overlap and be indistinguishable. Broad lines also hamper correct metabolite cycling, especially in combination with larger B0 shifts.21 In addition, the general low SNR in EPSI makes reliable fitting of creatine challenging.
Correct addition and subtraction in metabolite cycling depend on data consistency between upfield-cycled and downfield-cycled averages. The low number of averages acquired in EPSI as compared to metabolite-cycled cardiac PRESS emphasizes this, as corrupted signal averages can have a relatively large influence on the final spectra and cannot be excluded as easily compared to single-voxel spectroscopy.21
The TG/W ratios acquired using both EPSI and PRESS were in agreement with literature values for young subjects.46 To make a next step toward clinical translation, metabolite-cycled EPSI with motion-adapted gating and weighted acquisition should also be examined in older subjects.
Methods to improve metabolite SNR and therefore enable more reliable peak fitting in EPSI could be explored in future work. An option would be to perform denoising of the spectra based on tensor decomposition rank reduction,47, 48 which has already shown to be a promising technique to enhance spectral quality.
5 CONCLUSIONS
Metabolite-cycled EPSI with motion-adapted gating and weighted acquisition allows detecting TG/W ratios in different regions of the in vivo human heart. The synergistic implementation of motion-adapted gating in combination with weighted acquisition reduces scan time by more than 2-fold to less than 10 min as compared to conventional acquisition, while keeping the quality of TG fitting constant.
ACKNOWLEDGMENT
Open access funding provided by Eidgenossische Technische Hochschule Zurich.


