Modeling the Effect of Hyperoxia on the Spin–Lattice Relaxation Rate R1 of Tissues
Funding information: Clarendon Scholarship fund, Grant/Award Numbers: EP/S021507/1; EP/L024012/1; Medical Research Council, Grant/Award Number: EP/L016052/1; Engineering and Physical Sciences Research Council
Click here for author-reader discussions
Abstract
Purpose
Inducing hyperoxia in tissues is common practice in several areas of research, including oxygen-enhanced MRI (OE-MRI), which attempts to use the resulting signal changes to detect regions of tumor hypoxia or pulmonary disease. The linear relationship between PO2 and R1 has been reproduced in phantom solutions and body fluids such as vitreous fluid; however, in tissue and blood experiments, factors such as changes in deoxyhemoglobin levels can also affect the ΔR1.
Theory and Methods
This manuscript proposes a three-compartment model for estimating the hyperoxia-induced changes in R1 of tissues depending on B0, SO2, blood volume, hematocrit, oxygen extraction fraction, and changes in blood and tissue PO2. The model contains two blood compartments (arterial and venous) and a tissue compartment. This model has been designed to be easy for researchers to tailor to their tissue of interest by substituting their preferred model for tissue oxygen diffusion and consumption. A specific application of the model is demonstrated by calculating the resulting ΔR1 expected in healthy, hypoxic and necrotic tumor tissues. In addition, the effect of sex-based hematocrit differences on ΔR1 is assessed.
Results
The ΔR1 values predicted by the model are consistent with reported literature OE-MRI results: with larger positive changes in the vascular periphery than hypoxic and necrotic regions. The observed sex-based differences in ΔR1 agree with findings by Kindvall et al. suggesting that differences in hematocrit levels may sometimes be a confounding factor in ΔR1.
Conclusion
This model can be used to estimate the expected tissue ΔR1 in oxygen-enhanced MRI experiments.
1 INTRODUCTION
Many researchers have investigated using the paramagnetic relaxivity effect of oxygen on longitudinal relaxation rate R1 (1/T1) as a means of inferring oxygenation levels. For example, measurements of R1 have been used to infer oxygen levels in vitreous fluid as a noninvasive alternative to the highly invasive oxygen electrodes used to measure retinal hypoxia,1-3 bladder urine,4 and urine in the renal pelvis to create a non-invasive detection of renal dysfunction,5 and cerebrospinal fluid.4, 6 Additionally, measuring changes in R1 following the inspiration of increased fractions of oxygen is the basis for oxygen-enhanced MRI techniques,7-9 which are used to study a range of conditions from tumor hypoxia8, 10, 11 to lung disease.12, 13
The linear relationship between the partial pressure of oxygen (PO2) in a material and the resulting longitudinal relaxation rate (R1) has been measured in phantoms2-4, 6, 14 and bodily fluids such as vitreous fluid.2 The relationship between R1 and PO2 has been modeled as for a paramagnetic contrast agent, R1Ox = R10 + r1Ox*C, where R1Ox is the relaxation rate in the solution with oxygen added, R10 is the relaxation rate in the solution without oxygen, C is the concentration of oxygen added, and r1Ox is the relaxivity of oxygen in that solution, which is dependent on the magnetic field and temperature.15 Although this linear relationship has been demonstrated in phantoms and bodily fluids, studies on blood and tissues have sometimes reported so-called ”contradictory” R1 changes, where either no change or a negative change in R1 is observed.16, 17 It has been hypothesized that the source of this contradictory R1 change is paramagnetic deoxyhemoglobin since there is a positive linear relationship between R1 and deoxyhemoglobin concentration, i.e., an inverse correlation with blood oxygen saturation.18 The blood oxygen saturation, denoted by ‘SO2’, is a measure of how much hemoglobin is currently bound to oxygen compared to how much hemoglobin remains unbound. In contrast, the partial pressure of oxygen (PO2) in blood is a measure of the dissolved oxygen in the plasma.
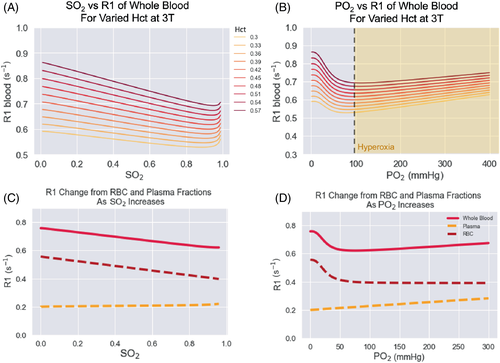
To estimate changes in blood R1 following hyperoxia, Bluemke et al.19 created a general model to estimate the R1 of blood, accounting for hematocrit, oxygen saturation (SO2), the partial pressure of oxygen (PO2), and magnetic field strength under both normal physiological and hyperoxic conditions. That model showed that there are two competing effects on blood R1 that arise from increasing oxygen levels (paramagnetic oxygen and paramagnetic deoxyhemoglobin) and that the effect on R1 due to deoxyhemoglobin dominates at SO2 levels below 99%, thus inducing a negative ΔR1 in venous blood after breathing 100% oxygen. While this model does explain the negative ΔR1 measured by Vatnehol et al. in venous blood during oxygen delivery experiment,16 it is not directly applicable to applications such as placental and tumor OE-MRI research where image voxels contain non-vascular tissue. In a tissue voxel, changing deoxyhemoglobin levels will only affect the portion of the voxel that is occupied by blood, and the R1 change of the tissue will dominate the remaining voxel volume. Therefore, in order to estimate the expected change in R1 of a tissue voxel, the blood model19 must be extended to contain a tissue compartment.
In this paper, we present a three-compartment model for estimating the changes in R1 that could be expected in healthy, hypoxic, and necrotic tissues depending on field strength, blood oxygen saturation, blood volume, hematocrit, oxygen extraction fraction, and change in partial pressure of oxygen. Since modeling tissue oxygen diffusion and consumption is a broad, active research area with many different approaches, this model has been designed to make it possible for a researcher to easily substitute their preferred model for tissue oxygen diffusion and consumption and tailor this model to their tissue of interest. For this paper, the model incorporates the classic Krogh tissue cylinder model for oxygen diffusion and the commonly used Michaelis–Menten equation for oxygen consumption. Last, we demonstrate the use of this model for estimating the expected R1 changes in tissues from breathing increased levels of oxygen and compare the R1 estimations with literature empirical measurements from oxygen-enhanced MRI research.8, 10, 11, 20, 21
2 THEORY
2.1 Model background and overview
Last, some substantial limitations to both of these approaches are: (A) the equations used to calculate the blood ΔR1 were of unknown accuracy and were not compared with literature values, (B) they did not take into account the blood hematocrit levels, and (C) the equations were not adjustable for magnetic field strength, which has a considerable effect on the relaxivity of oxygen.15
Therefore, we propose a new three-compartment model that calculates the expected ΔR1 of the arterial blood (ΔR1B,A), venous blood (ΔR1B,V), and tissue ΔR1T as separate compartments, and, following Holliday, uses a Krogh tissue cylinder model to estimate the corresponding tissue ΔPO2 (ΔPO2T). The model takes into account the magnetic field strength (B0), blood SO2, blood volume fraction (BV), hematocrit (Hct), oxygen extraction fraction of the tissue (OEF), and changes in PO2 in both the blood and tissue. Last, the model uses the blood volume fraction to calculate the resulting ΔR1 of the voxel (ΔR1voxel).
- Step 1. Calculate PO2 along the capillary. The ΔR1B,V and ΔR1T and ΔR1B,A are all related by a calculation of the SO2 or PO2 along the capillary length, which is determined by the arterial PO2 (PaO2) and the OEF of the tissue.
- Step 2. Calculate ΔPO2 of each compartment. Knowing the PO2 along the capillary allows the ΔPO2 from oxygen administration to be calculated in the blood and tissue compartments, using the Krogh tissue cylinder to model the oxygen diffusion into the tissue, and the set OEF is related to the tissue oxygen consumption rate. The Krogh tissue cylinder radius is calculated from the set blood volume.
- Step 3. Calculate ΔR1 of each compartment. Knowing the ΔPO2 in each compartment allows: (A) the ΔR1T to be calculated using the relaxivity of oxygen (r1Ox) as a function of the magnetic field, using the equation for r1Ox by Bluemke et al.15; and (B) the ΔR1 of each blood compartment to be calculated using the Blood R1 model published by Bluemke et al.19
- Step 4. Calculate ΔR1 of the voxel. Once the ΔR1 in each compartment is calculated, the set blood volume fraction (BV) is used to calculate the resulting ΔR1 of the voxel (ΔR1voxel).
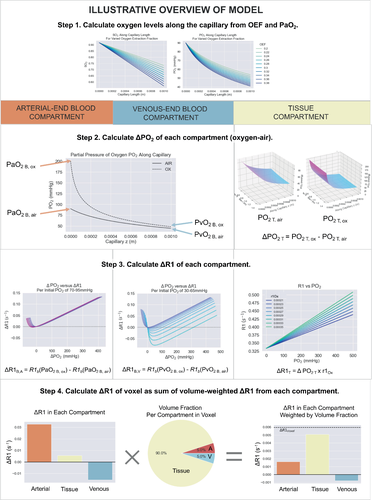
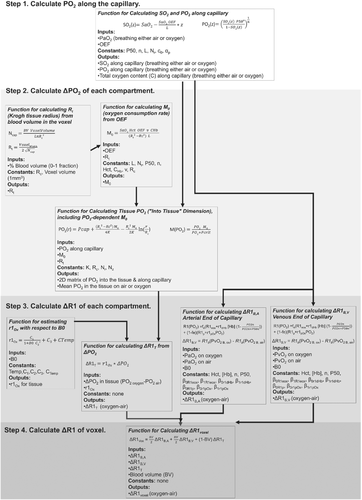
The theory and reasoning behind each part of this model are provided in the following sections. The model has been provided as a public code repository, and a graphical overview of the inputs and outputs of each function created to implement this model is provided in Figure 1. This model was created as a set of Python functions, the overview of which is provided in Figure 2.
2.2 Step 1: calculating PO2 along capillary length
In this step, the PO2 along the capillary is calculated using arterial oxygen content and oxygen extraction fraction inputs. The output of this step is the known SO2 and PO2 along the capillary, which can be calculated before and after the oxygen delivery or hyperoxic gas challenge.
2.3 Step 2: Estimating ΔPO2 in the three compartments
2.3.1 Blood compartments
In this model, the arterial PO2 levels are chosen by the user. The arterial PO2 following a hyperoxic gas challenge such as is used in OE-MRI, is estimated to increase from 90 mmHg to 600 mmHg based on empirical measurements,31 and therefore this is used for the duration of this paper. The corresponding change in venous PO2 will depend on the OEF, and is therefore calculated by the PO2 values at the venous end of the capillary at baseline or with supplemental oxygen.
2.3.2 Tissue compartment
Model for tissue oxygen diffusion
A wide variety of models for tissue oxygen diffusion and metabolism have been established, accounting for differing capillary networks, geometry, and other special features. For the purpose of this paper, we use the classic Krogh tissue cylinder model and common Michaelis–Menten equation for oxygen consumption rate, however any preferred tissue model can be substituted to calculate the resulting change in tissue oxygen levels (ΔPO2T) from hyperoxia to use in Step 3. The Krogh-Erlang solution has the following assumptions, paraphrased from Goldman et al.30: (A) tissue oxygen consumption is constant and uniform; (B) tissue oxygen at the capillary wall equals average capillary PO2; (C) tissue oxygen solubility and diffusivity are uniform (D) axial (or longitudinal) diffusion of oxygen is not significant; (E) all important microvascular oxygen transport phenomena are steady-state; (F) all capillaries are parallel, unbranched, and equally spaced; (G) all capillaries receive equal convective oxygen supply; (H) capillaries are the only microvessels that play a role in oxygen transport to tissue.
Model for tissue oxygen consumption
Estimating Rt from blood volume
Estimating Oxygen Consumption Rate M0 from OEF and Rt
2.4 Step 3. Calculating ΔR1 in the three compartments
2.4.1 Blood compartments
2.4.2 Tissue compartment

2.5 Step 4. Calculating weighted voxel ΔR1
3 METHODS
3.1 Applying model to simulate ΔR1 from OE-MRI
3.1.1 Model variables and constants
To demonstrate the application of this model, the five independent variables that vary between different types of tumor tissues, patients and experiments were: the magnetic field B0, hematocrit, oxygen extraction fraction, blood volume in the voxel, and Pcrit — the ranges of these values used to produce the R1 estimates are listed in Table 1. Next, there are four dependent variables that are calculated from the independent variables: the fraction of erythrocytes in whole blood fe is calculated from hematocrit; the r1Ox is calculated from B0; the Krogh tissue radius Rt is calculated from OEF and blood volume, and the tissue oxygen consumption rate is calculated from OEF, Rt, and Pcrit (shown in Table 2). Last, the constants used for the remaining parameters were sourced from the literature and listed in Table 3.25, 30, 33, 34
| Variable Meaning | Variable Name | Healthy Brain Tissue | Tumor Vascular Periphery No Tissue Compartment | Tumor Tissue with High Metabolism i.e., Hypoxic 2 types: Low BV and High BV | Tumor Tissue with Normal Metabolism | Tumor Necrotic Tissue No Blood Compartments | Units |
|---|---|---|---|---|---|---|---|
| Main magnetic field of MRI | B0 | 1.5, 3, 4.7, 7 | T | ||||
| Hematocrit | Hct | Total range: 0.36–0.50 | 0–1 | ||||
| Female range: 0.36–0.48 | Volume fraction | ||||||
| Male range: 0.41–0.50 | |||||||
| Oxygen extraction fraction | OEF | 0.31–0.37 | 0.24–0.44 | 0.02–0.2 | 0.02–0.05 | 0–1 Fraction | |
| Blood volume in voxel | BV | 0.02–0.07 | 1.0 (100% blood volume, no tissue compartment) | Low BV range = 0.047–0.059 | 0.047–0.059 | 0.001 (0.1% blood volume, i.e., no blood compartment) | 0–1 Volume fraction |
| High BV range = 0.09–0.17 | |||||||
| The PO2 value above which the tissue oxygen consumption rate is relatively constant | Pcrit | 1–4 | N/A | 0.5–2 | mmHg | ||
- Note: The chosen ranges of these values used to produce the simulated results in this paper are listed.
| Parameter meaning | Parameter name | Value or range used | Units |
|---|---|---|---|
| Fraction of erythrocytes in whole blood | fe | Calculated by Equation (19) as a function of Hct, WRBC and Wplasma | 0–1 Volume fraction |
| Relaxivity of oxygen | r1Ox | Calculated by Equation (25) as a function of B0 and temperature (set to 37 °C for tissue model) | s−1 mmHg−1 |
| Krogh tissue radius | Rt | Determined by the blood volume | m |
| Tissue oxygen consumption | M0 | Determined by the OEF and the Rt | mlO2 ml−1 s−1 |
| Constant meaning | Name | Value used (units) | Source |
|---|---|---|---|
| Oxygen tension when hemoglobin is 50% saturated with oxygen | P50 | 37 (mmHg) | Goldman 2008 |
| Hill coefficient | n | 2.7 (unitless) | Goldman 2008 |
| Plasma O2 solubility | ap | 3.1 × 10⁻⁵ (mlO2 ml−1 mmHg−1) | Welter 2016 |
| *assuming 22.4 L/mol under normal conditions | |||
| Hemoglobin binding capacity (Hüffner factor) | CHb | 1.36 (mlO2 g−1) | Welter 2016 |
| Concentration of oxygen per unit volume of RBCs at maximal saturation: calculated as the product of the hemoglobin binding capacity CHb and the mean corpuscular hemoglobin concentration [Hb] | c0 | Calculated from | Welter 2016 |
|
c0 = CHb × [Hb] |
|||
| =1.36 mlO2/g × 0.43 g/mL | |||
| =0.5 (mlO2 ml−1) | |||
| Tissue O2 solubility | aT | 2.8 × 10⁻⁵ (mlO2 ml−1 mmHg−1) | Welter 2016 |
| Tissue O2 diffusivity | DT | 2.41 × 10⁻⁹ (m2s−1) | Welter 2016 |
| Capillary length | L | 0.001 (m) | Less 1991 |
| Capillary radius | Rc | 3.5 × 10⁻⁶ (m) | Less 1991 |
| Capillary velocity | v | 0.00079 (m s−1) | Ivanov 1981 |
The chosen “tissue types” to simulate were: healthy brain tissue, and tumor regions of “vascular periphery,” “necrotic tissue,” “tissue with high metabolism” to simulate hypoxic regions (split into “more hypoxic” and “less hypoxic” by higher and lower blood volume ranges), and “tissue with normal metabolism” to simulate the regions of the tumor which are not hypoxic. To select ranges for OEF, Pcrit, and blood volume that have already been approved in peer-review were used, such as the values published in a computational model for tumor oxygenation by Welter et al. were used,25 or published values that were measured experimentally. For OEF: Welter et al. report an OEF in healthy breast tissue of 0.11 ± 0.09, and breast tumor tissue of 0.34 ± 0.1; Cho et al.35 report an OEF in healthy brain tissue of 34.2 ± 2.6%; and necrotic tissue was assumed to be very low, between 0.02 and 0.05. For blood volume: Leenders et al. measured the blood volume in healthy brain tissue to be 5.2% ± 1.4% and 2.7 ± 0.6% for gray and white matter, respectively36; Welter et al. report that using MRI and a brain tumor animal model, BV of tumor tissue was 5.3% ± 0.6% which is used as the “low blood volume range,” and Qi et al.37 measured 13% ± 4.1% blood volume in VX2 squamous cell tumors, which is used as the “high blood volume” range; for necrotic tissue, a 0.01% blood volume is used, i.e., almost no blood compartment is present. Last, Welter et al. report that literature values of Pcrit range from 1-4 mmHg, and Welter et al. lowered Pcrit for tumor tissue by ½ due to resistance to hypoxia; this corresponds with reports from Honig and Gayeski, who report tumor Pcrit as 0.5 mmHg.
For the dependent variables, the resulting range of Rt calculated from the range of BV values chosen in Table 1 is 1.07–4.43 × 10⁻⁵ m, which is similar to ranges reported such as 4 × 10⁻⁵ m38 and 2.5 × 10⁻⁵ m.39 Likewise, the resulting range of M0 calculated from the range of OEF chosen in Table 2 is 1.2 × 10⁻⁵–3.5 × 10⁻⁴, which is consistent with the reported M0 values of 6 × 10⁻⁵ and 2.4 × 10⁻⁴ mlO2/mL/s for normal tissue and tumor tissue, respectively, used by Welter et al.25
3.1.2 Comparison with empirical OE-MRI results
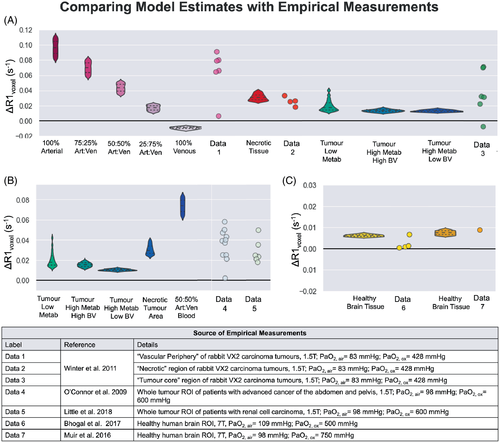
Empirical OE-MRI measurements by Winter et al.,10 Bhogal et al.,20 O'Connor et al.,11 Little et al.,8 and Muir et al.21 were used for comparison because they either estimated or measured the PaO2 change induced by their hyperoxic gas challenge. Altogether, these studies provided measurements in “healthy brain tissue,”20 “vascular periphery,” “tumor core,” “necrotic tissue,”10 and whole tumor region of interest (ROI) measurements from clinical patient data by O'Connor et al.,11 and Little et al.8 As it is not possible to know the composition of the whole tumor ROIs reported, the simulated ΔR1 for each possible tumor tissue type is calculated for comparison, and it is assumed that the empirical whole tumor ROI should fall within that range of ΔR1.
In the measurements from Winter et al., the exact definition of the “necrotic” versus “central tumor” regions is defined as follows10: the necrotic core was characterized as exhibiting hypo-intensity on post-contrast gadolinium-enhanced T1-weighted imaging, suggesting it was avascular, and the necrotic nature of this region was confirmed by histology. In contrast, the “central tumor” was defined as tumor tissue excluding the enhancing vascular rim and excluding necrotic tissue, if any.
4 RESULTS
To visualize the relationship between the independent variables, dependent variables, and ΔR1, the following plots were produced. The effect of all combinations of blood volume and OEF on the baseline tissue PO2 (mean and minimum) and maximum oxygen consumption rate is shown in Supporting Information Figure S6. The effect of OEF on the ΔR1 of the venous, arterial, and tissue compartments individually, for varied PaO2 changes induced from oxygen, is shown in Figure 5A–C, and the resulting ΔR1 for the voxel is shown in Figure 5D,E (all simulated at 1.5T). In this model, there is an inverse mathematical relationship between blood volume and the Krogh Radius Rt (shown in Supporting Information Figure S3), and therefore blood volume has an effect on the M0 (see Supporting Information Figure S6C), where M0 increases with blood volume fraction. In our model, blood volume is considered to be the independent variable while M0 is dependent, however in biological reality, this is a highly intertwined feedback relationship where tissues with high metabolism recruit more blood vessels.40 Blood volume also has an effect on the final ΔR1voxel (see Figure 5D,E), which is due to the increased contributions from the arterial and venous components in Step 4 of the model. Interestingly, when there has been a smaller change in PaO2 (i.e., less oxygen administered), the increase in the blood volume fraction allows the negative ΔR1 from the venous component to decrease the ΔR1 of the voxel, whereas this becomes dominated by the high increase in ΔR1 from the arterial component as more oxygen is administered.
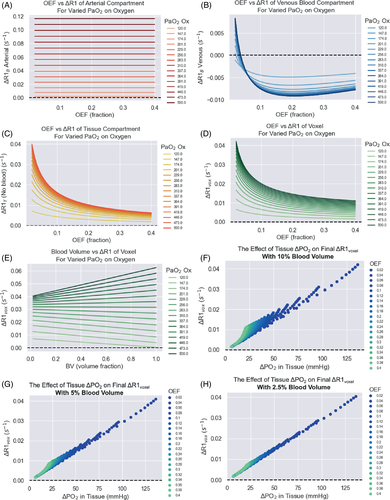
In this model, the OEF chosen has a large effect on ΔR1voxel, which can be seen clearly in Figure 5D,E. Figure 5A,E shows that as OEF increases – in other words, as a higher fraction of oxygen is extracted from the tissue between the arterial and venous ends – there will be a lower change in PO2 in the tissue (and hence smaller ΔR1T), which is the largest contributor to the overall ΔR1 of the voxel. Last, the relationship between ΔPO2 in the tissue compartment and ΔR1voxel is shown in Figure 5F-H.
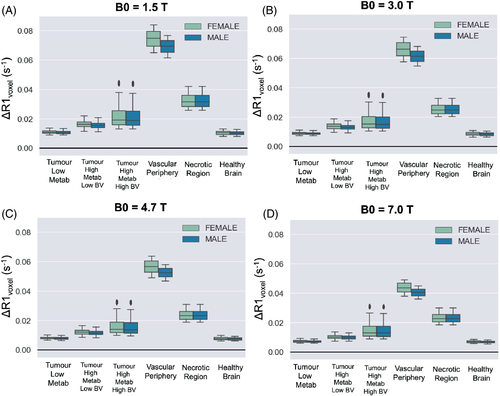
The resulting ΔR1 calculated from this model is plotted in Figure 6, calculated using different field strengths, and using all combinations of the chosen range of Hct, OEF, BV, Pcrit listed in Table 1 for each respective tumor tissue type. Since hematocrit levels can vary between sexes, the results from using the female and male ranges for hematocrit have been shown separately to examine the expected difference in ΔR1. In this simulation, the largest difference in ΔR1 between the sexes was 0.0045 s−1, which occurred in the vascular periphery due to containing the highest percentage of blood component and therefore most affected by differences in hematocrit. The difference in ΔR1 between the sexes was negligible in the other simulated tissue types.
For a rough quantitative comparison, empirical ΔR1 measurements from six tissue types, alongside the respective simulated ΔR1 according to the B0, PaO2 and tissue type, are shown in Figure 7. It is not possible to know the composition of the whole tumors ROIs reported by O'Connor et al.11 and Little et al.,8 or the “tumor core” reported by Winter et al.,10 however, each data point for empirical tumor ΔR1 falls within the range of ΔR1 simulated for each possible tumor tissue type; therefore, these whole tumor ROIs could reasonably be the sum of a composition of these different tumor tissue types. One notable exception to this is one “tumor core” data point reported by Winter et al.,10 which reaches a negative ΔR1 close to that of pure venous blood.
5 DISCUSSION
In this paper, we propose a three-compartment model for estimating the changes in R1 that could be expected in tumor tissues depending on field strength, blood SO2, blood volume, hematocrit, oxygen extraction fraction, and changes in PO2 in both the blood and tissue. This model has been developed with the aim of estimating the expected ΔR1 induced by the oxygen delivery in a voxel containing tumor tissue, however, it is generally applicable to OE-MRI research as well and has been designed to make it possible for a researcher to easily substitute their preferred model for tissue oxygen diffusion and consumption and make this model tailored to their tissue of interest, for example, placenta or liver.
Interestingly, the relationship between ΔPO2 in the tissue compartment and ΔR1voxel (Figure 5F-H) shows that the linear relationship between ΔPO2 and ΔR1voxel seen in phantoms almost holds true in tissue voxels containing lower blood volume; however, in voxels containing higher blood volume, the ΔR1 contribution from the blood compartment interrupts the linear relationship. This suggests that despite the influence of deoxyhemoglobin changes, measuring ΔR1 does provide an indication of the final change in PO2 in the tissue. In practice, the efficiency of the oxygen delivery to the tissue via inhalation of increased oxygen fraction can be affected by by many factors, and therefore for convenience, Figure 5D simulated a large range of PaO2 changes (120-500 mmHg) where the resulting change in the R1 (at 1.5T) of the voxel can be seen for each respective PaO2. In addition, Figures 5F-H display the estimated corresponding ΔR1 for a large range of levels of changes in tissue PO2 at 1.5T, allowing for a convenient estimate of the corresponding ΔR1 by quickly viewing the data points in Figure 5F-H.
It is known that the values estimated by the r1Ox model and R1 Blood models by Bluemke et al.15, 19 both agree well with empirical measurements (R2 = 0.93 and 0.93); however, since the tissue compartment of this model contains variables that were not measured at the time of OE-MRI data collection (i.e., hematocrit, changes in arterial PO2, tumor blood volume), it is not possible to quantitatively compare the model ΔR1 predictions to the measured ΔR1 with metrics such as R2 and MSE. Instead, we used a variety of reported ΔR1 from OE-MRI literature to gain a rough estimation of the accuracy of this model: qualitative ΔR1 responses, categorized by different tumor tissue types by the authors of the OE-MRI literature, are listed in Supporting Information Table S1. Overall, the simulated ΔR1 for each tissue type shown in Figure 6 does correspond with observations from OE-MRI literature: as seen in experiments by Winter et al.,10 the “vascular periphery” shows greater +ΔR1 than the “tumor core” and “necrotic” regions, and the “necrotic” regions show a greater +ΔR1 than the “tumor core” but less than “vascular periphery.” This is consistent with the distinctions between these three regions defined by Winter et al. — (1) necrotic region is avascular and filled with fluid, (2) the central tumor is cell-dense and has much lower vascularity than vascular periphery. As observed in experiments by Burrell et al.,41 the “less hypoxic” tumor type shows greater +ΔR1 than the “more hypoxic” tumor type. Last, in these simulations, the healthy brain tissue is predicted to show a very small ΔR1 that might end up ‘not detectable’, as observed by Bhogal et al.20
For a select few OE-MRI studies that did report either measured or estimated PaO2 changes, the simulated ΔR1 from the model did result in ΔR1 values that were in good agreement with the empirical data (Figure 7). The values for brain tissue and necrotic tissue were particularly accurate, and although it Is not possible to know the composition of the whole tumors ROIs, “vascular periphery,” or “tumor core,” each data point for empirical tumor ΔR1 fell within the range of ΔR1 simulated for each possible tumor tissue type. Therefore, the empirical ΔR1 could reasonably be the sum of a composition of these different tumor tissue types.
This model may be useful for OE-MRI researchers looking to predict the effect of certain factors, such as hematocrit. It is interesting that hematocrit differences in the male and female populations did have a slight effect on ΔR1 when the voxel contained larger blood volumes. In fact, this predicted difference has been empirically observed in lung tissue — where blood volume is approximately 33%–36%42 — Kindvall et al.12 reported that age and sex were all predictors of ΔR1 in lung tissue, likely due to the hematocrit differences.
5.1 Limitations
It is currently difficult to quantify the agreement of this model with the empirical data, and the model still includes some constants and variables that cannot be measured in individual patients, although it has been designed so that the independent variables are either known (such as B0) or can be measured via a non-imaging method (i.e., arterial PO2, hematocrit), or through another imaging method (i.e., measuring blood volume or OEF). Testing whether it would be possible to use OEF or blood volume measurements from another imaging modality is beyond the scope of this paper, however, in the future, as methods for measuring blood volume or OEF continue to advance, this connection could prove useful in future work. In the future, it is possible that combining R1 measurements with other MRI techniques such as R2* or oxygen-17 gas43 could improve the accuracy and robustness for monitoring oxygenation.
In addition, there may be unpublished raw datasets from former OE-MRI studies held by other research groups where arterial PO2 was measured but perhaps not reported. We welcome other researchers to test the predictions of this model against a larger sample size of data — this would greatly improve confidence in this model before it is applied in oxygen-enhanced MRI studies.
Another limitation is that, in this current model, the arterial blood volume has been set to be equal to the venous blood volume — this will not be true for all voxels. Since we have provided the open-source code for the model, future researchers are welcome to adjust this parameter if they have more information about the ratio of arterial and venous blood in their voxels of interest.
The the parameters for the r1Ox model by Bluemke et al.15 were created by compiling empirical measurements of the relaxivity of oxygen over 50 y of MRI research in phantoms, saline and water solutions, vitreous fluid, and plasma, and fitting these data to a Lorentzian equation that fit R2 = 0.93. Of course, the r1Ox in these solutions may be slightly different than the r1Ox in tissues. Indeed, the r1Ox may vary between tissues as well. However, we believe the r1Ox derived from this empirically driven model will better represent the r1Ox in tissue than using any single r1Ox datapoint measured in saline or water, as has been common practice in previously published work using r1Ox values for various calculations.3, 5, 14, 22, 23, 44, 45
This model contains fewer independent variables than the model by Holliday et al.,22 but considerably more variables than the simple equation proposed by Kindvall et al.23 Ideally, the outputs of these three models could be compared; however, since they are so different and contain such different parameters, it is difficult to choose the variable ”settings” at which to compare them. For example, this new model adjusts all field-dependent parameters according to field strength, while both of the previous models are only applicable at one field strength. Similarly, neither of the previous models account for hematocrit differences, which do affect the resulting ΔR1, as we have now demonstrated in this manuscript and as was actually measured in human lung tissue by Kindvall et al.23 Therefore, although it is not possible to provide a robust comparison of this model to the previous two models, we are confident that this model brings significant improvements for two main reasons: first, the utility of this model surpasses the previous models simply by the fact that the previous models only apply to a single field strength.22, 23 OE-MRI research occurs at a variety of field strengths, and therefore the model must account for the effect of B0 on each of the relevant variables. This field-strength consideration is an extremely useful feature that will allow data acquired at different field strengths to be compared. Second, one previous model incorrectly combines values from different field strengths into one single model (using r1dHb from Silvennoinnen et al.24 at 4.7T alongside r1Ox from Pilkinton et al.46 at 1.5T), which suggests it will be produce slightly incorrect results at any field strength.22 In summary, we present a new model that is more accurate and considers important factors such as field strength and hematocrit. Most of all, however, our work extends the previous modeling work in significant ways, in particular by incorporating the concept of OEF and introducing an alternative approach to incorporating metabolic rate.
Last, a number of assumptions are necessarily made in the generation of this model, however one may be particularly problematic for some research applications: the assumption from the Krogh tissue model that all capillaries are parallel, unbranched, and equally spaced. While this may be a reasonable assumption in the brain and certain other organs, in others it is a very poor assumption. i.e. the placenta, where OE-MRI has been used successfully.47 Importantly, this is also a very poor assumption in tumors, which often have severely deranged vasculature, including tortuous and elongated capillaries.48 This is a major limitation of using the Krogh model to estimate the tissue PO2 changes, as deviations from the simplistic geometry assumed may cause misinterpretations. For example, complex geometry will affect the ability to estimate Rt, which will then cause errors in the modeled metabolic rate. Fortunately, the modular nature of this model and the supplied code allows researchers to easily substitute more modern tissue oxygen diffusion and consumption models that do account for abnormal vasculature, or any other particular qualities that their tissue of interest may require.
6 CONCLUSIONS
In conclusion, we have proposed a three-compartment model for estimating the changes in R1 that could be expected in various tissues depending on field strength B0, SO2, BV, hematocrit, oxygen extraction fraction (OEF), and changes in blood and tissue PO2. In a demonstration of the model, the resulting ΔR1 are consistent with reported literature OE-MRI results in a variety of tissues. This model has been designed to be easy for researchers to tailor to their tissue of interest by substituting their preferred model for tissue oxygen diffusion and consumption.
ACKNOWLEDGMENTS
E.B. is supported by funding from the Engineering and Physical Sciences Research Council (EPSRC) and Medical Research Council (MRC) [grant number EP/L016052/1] and the Clarendon Scholarship fund. DB and ES also gratefully acknowledge funding from the EPSRC [grant numbers EP/S021507/1 and EP/L024012/1]. E.B. thanks Richard Sove for helpful discussions about Krogh modelling.
Open Research
DATA AVAILABILITY STATEMENT
The model has been hosted open-source at [github.com/BulteGroup/TissueR1Model] for other researchers to adopt, adapt and improve.


