Multicenter Repeatability and Reproducibility of MR Fingerprinting in Phantoms and in Prostatic Tissue
Funding information: National Center for Research Resources, Grant/Award Number: 1C06RR12463-01; National Institute of Biomedical Imaging and Bioengineering, Grant/Award Number: P41 EB 015898; National Institutes of Health, Grant/Award Numbers: 1R01CA208236; 1R01EB016728; R01DK098503; R01EB020667; R01HL094557; Siemens Healthineers
Click here for author-reader discussions
Abstract
Purpose
To evaluate multicenter repeatability and reproducibility of T1 and T2 maps generated using MR fingerprinting (MRF) in the International Society for Magnetic Resonance in Medicine/National Institute of Standards and Technology MRI system phantom and in prostatic tissues.
Methods
MRF experiments were performed on 5 different 3 Tesla MRI scanners at 3 different institutions: University Hospitals Cleveland Medical Center (Cleveland, OH), Brigham and Women's Hospital (Boston, MA) in the United States, and Diagnosticos da America (Rio de Janeiro, RJ) in Brazil. Raw MRF data were reconstructed using a Gadgetron-based MRF online reconstruction pipeline to yield quantitative T1 and T2 maps. The repeatability of T1 and T2 values over 6 measurements in the International Society for Magnetic Resonance in Medicine/National Institute of Standards and Technology MRI system phantom was assessed to demonstrate intrascanner variation. The reproducibility between the 4 clinical scanners was assessed to demonstrate interscanner variation. The same-day test–retest normal prostate mean T1 and T2 values from peripheral zone and transitional zone were also compared using the intraclass correlation coefficient and Bland–Altman analysis.
Results
The intrascanner variation of values measured using MRF was less than 2% for T1 and 4.7% for T2 for relaxation values, within the range of 307.7 to 2360 ms for T1 and 19.1 to 248.5 ms for T2. Interscanner measurements showed that the T1 variation was less than 4.9%, and T2 variation was less than 8.1% between multicenter scanners. Both T1 and T2 values in in vivo prostatic tissue demonstrated high test–retest reliability (intraclass correlation coefficient > 0.92) and strong linear correlation (R2 > 0.840).
Conclusion
Prostate MRF measurements of T1 and T2 are repeatable and reproducible between MRI scanners at different centers on different continents for the above measurement ranges.
Abbreviations
-
- MRF
-
- MR Fingerprinting
-
- PZ
-
- Peripheral Zone
-
- TZ
-
- Transition Zone
-
- ISMRM/NIST
-
- International Society for Magnetic Resonance in Medicine/National Institute of Standards and Technology
-
- UHCMC
-
- University Hospitals Cleveland Medical Center
-
- BWH
-
- Brigham and Women's Hospital
-
- DASA
-
- Diagnosticos da America
-
- SVD
-
- Singular Value Decomposition
-
- CV
-
- Coefficient of Variation
-
- CI
-
- Confidence Interval
-
- PI-RADS
-
- Prostate Imaging Reporting And Data System
1 INTRODUCTION
MR fingerprinting (MRF)1 is a quantitative tissue property mapping technique that can be used to efficiently generate multiple tissue property maps simultaneously,2-6 and it has been applied to measure quantitative T1 and T2 measurements in the prostate.2, 7, 8 MRF has the potential to enable objective diagnosis and follow up of disease in the prostate. Previous research has shown that MRF-derived T1 and T2 values can be used to differentiate between normal peripheral zone (PZ) and prostate cancer,2, 9, 10 and in combination with apparent diffusion coefficient mapping can differentiate between low and intermediate/high grade cancers.7, 11 MRF-based relaxometry combined with apparent diffusion coefficient mapping also improves transition zone (TZ) lesion characterization.8, 12
In order to translate and use MRF meaningfully in clinical practice, the quantitative tissue properties measured with MRF must be repeatable and reproducible.13 If these features can be demonstrated, observed relaxation time differences within a tissue can be assumed to be due to differences in physiology rather than measurement variability and/or scanner instability as long as the measured differences are greater than the measurement error. MRF has been shown to provide highly reproducible quantitative maps in both 2D14 and 3D15 acquisitions. MRF-derived T1 and T2 measurements are also repeatable over time,16 with excellent reproducibility in vivo across different scanner types.17, 18 Several in vivo multicenter studies demonstrated high levels of repeatability and reproducibility of MRF in the brain.17, 19 However, repeatability and reproducibility of the prostate MRF acquisition in phantom and prostatic tissues across different centers have not yet been demonstrated.
The purpose of this study was to evaluate multicenter repeatability and reproducibility of T1 and T2 estimates based on the MRF technique using the International Society for Magnetic Resonance in Medicine/National Institute of Standards and Technology (ISMRM/NIST) MRI system phantom20 and prostatic tissues in patients.
2 METHODS
2.1 MRF data acquisition
This Health Insurance Portability and Accountability Act–compliant study was approved by the local institutional review board, and written informed consent was obtained for all in vivo scans. Experiments were performed on 5 different 3 Tesla MRI scanners (1 Skyra and 4 Verio scanners, Siemens Healthcare, Erlangen, Germany) with different software versions (VE11C, VB19, and VB17) in 3 different institutions: University Hospitals Cleveland Medical Center (UHCMC) and Brigham and Women's Hospital (BWH) in the United States, and Diagnosticos da America (DASA) in Brazil. An MRF–fast imaging with steady-state precession acquisition designed for use in the prostate21 was employed with the following parameters: FOV 400 × 400 mm2; matrix 400 × 400; flip angles 3.38–50°; TR 11.2–14.2 ms; slice thickness 5 mm; 3000 TRs, acquisition time 39 s/slice. A delay time of 5 s was inserted between measurements to ensure sufficient magnetization recovery before beginning the next experiment for both phantom and in vivo studies.
2.2 MRF dictionary simulation
In order to efficiently match each measured signal timecourse to the appropriate combination of tissue property values, a precalculated MRF dictionary, which can be used as a look-up table, was generated using Bloch equation simulations in MatLab (MathWorks 2015b, Natick, MA). In the prostate region, the T1 is expected to range between 1000 and 2500 ms, and the T2 between 20 and 300 ms for 3 Tesla systems.8, 22, 23 Dictionary resolutions of T1 values of [10:5:90, 100:10:1000, 1020:20:1500, 1550:50:2050, 2150:100:2950] and T2 values of [2:2:10, 15:5:150, 160:10:200, 250:50:500], denoted by min:step:max (ms), were used to balance between matching accuracy and MRF dictionary size. The dictionary had a total of 5970 entries.
2.3 MRF map reconstruction
All map reconstruction was performed using a Gadgetron MRF implementation,24 which was exported from UHCMC to BWH and DASA for online reconstruction at each of the institutions. The computers used to perform the reconstructions had an 8GB Nvidia GeForce GTX 1080 graphics card; a 10 core, 2.2GHz Intel Xeon E5-2630 v4 processor; and 64GB of 2400 MHz DDR4 RAM. The raw data was passed to the Gadgetron MRF reconstruction pipeline and processed using principal component analysis-based coil compression to reduce the number of coils from 8–12 to 8, as suggested in Ref. 25. To further reduce the computational load and memory requirements without reducing the performance, singular value decomposition basis compression26 was applied to the MRF data to compress the number of time points from 3000 to 43, which preserved 99.9% of collected information. The GPU-enabled non-uniform fast Fourier transform27 was then used to grid the data. Multi-coil images were combined with adaptive coil combination.28 Finally, cross-correlation pattern matching was applied to the data using the precalculated dictionary to extract quantitative T1 and T2 values for each voxel. The Gadgetron reconstruction took 17.8 s for each slice.
2.4 Phantom study
The accuracy of the T1 and T2 values measured using MRF was validated using the T2 layer of ISMRM/NIST MRI system phantom with T1 values between 307.7 and 2360 ms and T2 values between 19.1 and 248.5 ms. The phantom was placed in the magnet for at least 20 min before the acquisition to reduce any errors due to motion of the water making up the phantom. Six single-slice MRF measurements were then collected, with a delay of 5 s between measurements, on all 5 scanners. Following this acquisition, data for the same-day test–retest study were collected on the UHCMC Verio 1, UHCMC Verio 2, UHCMC Skyra, and DASA Verio. The phantom was moved out of the magnet and placed again in the magnet, again allowed to settle for at least 20 min, and another set of 6 single-slice MRF acquisitions was collected. Neither B0 nor B1 maps were collected in this study. The results from the MRF measurements were compared to the reference values measured and reported by NIST.16
2.5 In vivo prostate study
In addition to the phantom study, in vivo experiments were performed in 24 patients with suspected prostate cancer (7 patients on the UHCMC Verio 1, mean age 68.4 years, age range 67–71 years; 6 patients on the BWH Verio, mean age 67.3 years, age range 59–76 years; and 11 patients on the DASA Verio, mean age 60.7 years, age range 37–71 years). The protocol used was the same as that described for the phantom study, with the following exceptions: No settling time was required for the in vivo prostate measurements. Also, instead of single-slice measurements, 2 sets of 2-slice MRF measurements with no slice gaps were acquired to assess same-day test–retest reliability. The patients were removed from the scanner and then repositioned between the 2 MRF acquisitions.
2.6 Statistical analysis
For the in vivo subjects, regions of interest in the PZ and TZ were drawn by a radiologist (l.k.b., with 13 years of radiology experience) in maps from both scans for all patients. Note that the ROIs from patients (10 pixels in size) were drawn in normal appearing regions (PI-RADS 1 or PI-RADS 2) with no specific findings. Mean T1 and T2 values were calculated for each region of interest. The intraclass correlation coefficient1, 3 and Bland–Altman analysis were used to evaluate the test–retest reliability in the in vivo prostate study.
3 RESULTS
The means of the 6 measurements obtained from the ISMRM/NIST MRI system phantom on 5 scanners at the 3 different medical institutions are presented in Figure 1. The x-axis labels are the reference values for each of the spheres as measured and reported by NIST. The results show a strong linear correlation (R2 > 0.998 for T1, R2 > 0.994 for T2) with the reference values. The bias for each vial (calculated as the difference between the measured T1 and T2 values and the reference values, divided by the reference values) for each of the 5 scanners, is shown in Supporting Figure S1.
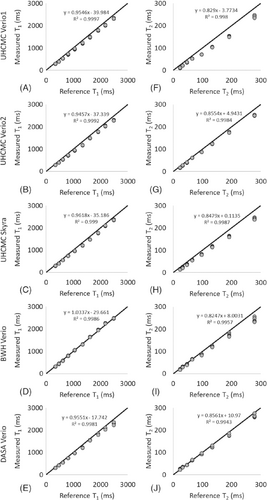
BWH, Brigham and Women's Hospital; DASA, Diagnosticos da America; FISP, fast imaging with steady-state precession; ISMRM/NIST, International Society for Magnetic Resonance in Medicine/National Institute of Standards and Technology; MRF, MR fingerprinting; UHCMC, University Hospitals Cleveland Medical Center
Figure 2 shows the CV for each of the spheres with T1 values between 307.7 and 2360.0 ms and T2 values between 19.1 and 248.5 ms, as calculated by dividing the SD of the 6 repeat measurements by the mean of the 6 measurements (expressed as a percentage). Figure 2A, 2B show the intrascanner CVs for T1 and T2. The T1 estimates had a variation of 0.2% to 2.0%, and T2 estimates had a variation of 0.0% to 4.7%, with the exception of the vial with a T2 value of 19.1 ms, which showed a variation of 8.9%. The interscanner CVs over all 6 measurements are shown in orange in Figure 2C, 2D, and the CVs for a single measurement (no. 5 of the 6 measurements) are shown in blue. These interscanner measurements exhibited a T1 variation of 2.3% to 4.9% for T1 values between 307.7 and 2360.0 ms and T2 variation of 2.3% to 8.1% for T2 values between 40.5 and 248.5 ms. The variation increased in spheres with T2 values of lower than 28.8 ms. The difference between interscanner variations of multiple measurements and the variation in a single measurement is less than 2%.
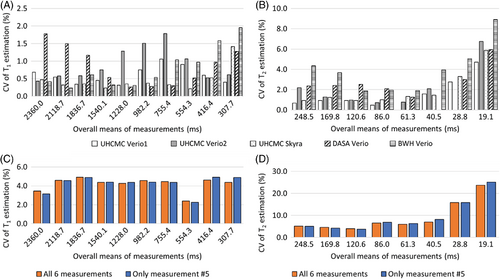
CV, coefficients of variation
The linear correlations for both T1 and T2 values in the ISMRM/NIST MRI system phantom were above 0.99 between repeated measurements made on the UHCMC Verio 1, UHCMC Verio 2, UHCMC Skyra, and DASA Verio (Figure 3) (Supporting Figure S2).
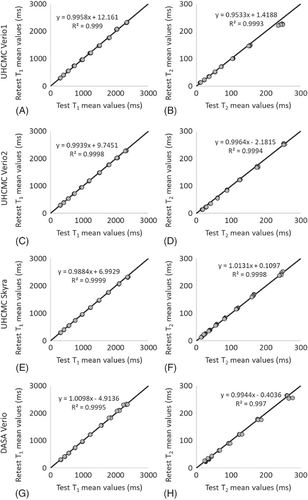
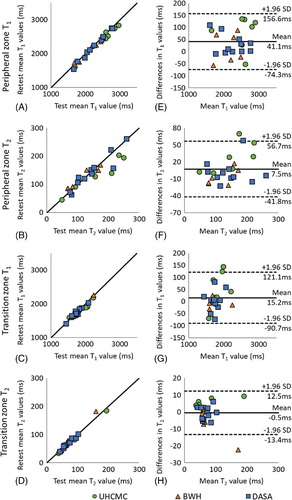
Supporting Figure S3 shows representative prostate MRF T1 and T2 maps in patients from 5 different scanners. For the same-day test–retest in vivo prostate experiments performed on patients, the mean T1 and T2 values in both the peripheral zone and transition zones are shown in Figure 4A–4D. The mean and SD of T1 and T2 values in these zones are given in Table 1. The test–retest reliability coefficients demonstrate test–retest reliability intraclass correlation coefficient > 0.92 in both prostate regions at all 3 sites.
| UHCMC Verio 1 | BWH Verio | DASA Verio | ||||||
|---|---|---|---|---|---|---|---|---|
| 7 Patients (68.4 ± 1.4 years) | 6 Patients (67.3 ± 6.2 years) | 11 Patients (60.7 ± 9.0 years) | ||||||
| Mean ± SD (ms) | ICC (95% CI) | Mean ± SD (ms) | ICC (95% CI) | Mean ± SD (ms) | ICC (95% CI) | |||
| T1 | PZ | Test | 2551.8 ± 409.7 | 0.99 (0.98–1.00) | 2153.4 ± 331.1 | 0.99 (0.92–1.00) | 2257.6 ± 378.9 | 0.98 (0.88–1.00) |
| Retest | 2471.9 ± 407.4 | 2136.6 ± 317.9 | 2150.6 ± 546.1 | |||||
| TZ | Test | 1880.0 ± 233.3 | 0.96 (0.87–0.99) | 1773.8 ± 244.1 | 0.94 (0.70–0.99) | 1740.7 ± 166.0 | 1.00 (0.98–1.00) | |
| Retest | 1827.6 ± 194.3 | 1778.8 ± 246.2 | 1738.2 ± 156.2 | |||||
| T2 | PZ | Test | 164.1 ± 73.9 | 0.94 (0.78–0.98) | 115.4 ± 48.7 | 0.92 (0.59–0.99) | 146.0 ± 59.4 | 0.94 (0.63–0.99) |
| Retest | 136.1 ± 55.5 | 122.3 ± 38.4 | 143.7 ± 58.8 | |||||
| TZ | Test | 77.6 ± 54.0 | 0.98 (0.92–0.99) | 76.7 ± 40.9 | 1.00 (0.99–1.00) | 69.3 ± 18.5 | 0.98 (0.89–1.00) | |
| Retest | 72.6 ± 52.0 | 83.1 ± 48.8 | 70.0 ± 18.1 | |||||
- BWH, Brigham and Women's Hospital; CI, confidence interval; DASA, Diagnosticos da America; ICC, intraclass correlation coefficient; PZ, peripheral zone; TZ, transition zone; UHCMC, University Hospitals Cleveland Medical Center.
The Bland–Altman analysis revealed that 24 of 24 PZ T1 measurements, 22 of 24 PZ T2 and TZ T1 measurements, and 23 of 24 TZ T2 measurements fell within the 95% confidence interval (CI) for limits of agreement when difference in measurements was plotted against the mean of the measurements (Figure 4). The T1 values obtained from PZ and TZ demonstrated a strong linear correlation (R2 = 0.978 and R2 = 0.936, respectively) and acceptable agreement (bias 41.1 ms, 95% CI −74.3 ms to 156.6 ms; bias 15.2 ms, 95% CI −90.7 ms to 121.1 ms). The T2 values from PZ and TZ also showed a strong linear correlation (R2 = 0.840 and R2 = 0.970, respectively) and acceptable agreement (bias 4.5 ms, 95% CI −41.8 ms to 56.7 ms; bias −0.45 ms, 95% CI −13.4 ms to 12.5 ms) with corresponding plots presented in Figure 4F, 4H, respectively.
4 DISCUSSION
This study assesses the repeatability and reproducibility of prostate MRF-derived T1 and T2 measurements on 5 different 3T MRI scanners with different software versions in 3 different medical institutions. It also demonstrates the use of a Gadgetron-based online MRF reconstruction to generate quantitative maps rapidly at the scanner. This implementation enabled the same MRF reconstruction to be used on 5 different MRI scanners in 3 different locations where the personnel had technical expertise ranging from minimal to advanced. Additionally, the improvement in the workflow made possible through the use of the online reconstruction meant that quantitative maps could be provided immediately to the radiologist for annotation and analysis. Coupled with the results demonstrating repeatability and reproducibility, this work paves the way for a Gadgetron-based MRF framework for quantitative mapping of the prostate to be distributed and used with a variety of MRI scanners around the world.
This study reports the repeatability and reproducibility of prostate MRF performed at different centers on different continents. Over the wide ranges of T1 and T2 values found in the ISMRM/NIST system phantom, intrascanner MRF T1 and T2 estimates showed small variations over 6 measurements. The interscanner measurements showed larger T1 and T2 variations between scanners at different institutions, which is similar to the results reported in Ref.19 These measurements are in line with other quantitative measurements in the prostate; previous research has shown that the repeatability CV for measurements of apparent diffusion coefficient in the prostate is < 2.4%, and reproducibility CV is < 4.0% across three 3T scanners.29 Our findings of repeatability (T1 CV < 2.0% and T2 CV < 4.7%) and reproducibility (T1 CV < 4.9% and T2 CV < 8.1%) for MRF T1 and T2 values in the phantom are similar to the reported prostate apparent diffusion coefficient values. However, T2 values lower than 30 ms and higher than 300 ms demonstrated larger variation. An underestimation of very high T2 values (> 300 ms) in the phantom study was observed as compared to reference values in Figure 1; however, variations in this range of T2 are not expected to be clinically relevant in the prostate because cancer and prostatitis have much shorter measured T2. The T2 step size in the MRF dictionary was set to 10 ms from 160 to 200 and 50 ms from 250 to 500 ms because such high values were not originally expected to be encountered in vivo. Finer dictionary step size and higher maximum T2 values in the dictionary may improve the accuracy of high T2 values. Similarly, the higher CV seen for vials with a T2 value below 30 ms likely relates to dictionary coarseness (5 ms at this range), which is a substantial fraction of the measured values. A finer dictionary with smaller step sizes could result in an improved test–retest agreement and a lower CV. Other factors that may increase systematic variation of the measured T1 and T2 values (Supporting Figure S1 and Supporting Figure S2) include temperature, B0 inhomogeneity, and B1 inhomogeneity.
In addition to the phantom experiment, this study also examined in vivo measurements in prostatic tissues. The phantom study demonstrated same-scanner test–retest reliability intraclass correlation coefficient > 0.99, whereas the in vivo study showed test–retest reliability intraclass correlation coefficient > 0.92. The slightly lower agreement in the in vivo study as compared to the phantom is likely due to a combination of patient motion, physiologic differences, dictionary coarseness, partial volume effects, and B0 field drift. Because the test–retest scans were performed after moving the subject, the slice selected may also be slightly different, which could add further variation to the values measured. Partial volume effects could affect the measurements, especially if evaluating small structures/lesions and smaller glands. Thinner slices with a higher spatial resolution would improve the partial volume effects in subjects with small prostates. Main magnetic field drifts could cause errors in T2 values. The same center frequency was used for all scans in single experiment. Adjusting center frequency before each scan may improve the reproducibility.
Differences were observed between the average T1 and T2 values of the peripheral zone in the 3 measurements from different institutions. The patient data collected from BWH showed lower T1 and T2 values as compared to the normal peripheral zone, and higher T1 and T2 values as compared to prostate cancer and noncancers reported in literature.7 The differences between groups likely related to differences in populations from which these cohorts were drawn. Some of the patients from BHW underwent prior biopsy or brachytherapy before MRF measurement and may have different tissue properties as compared to other 2 sites. Several patients had small or almost no PI-RADS 1 peripheral zone due to either prior therapy or benign prostatic hypertrophy (PI-RADS 2 with no specific findings); thus, peripheral zone measurements in these patients were difficult to obtain and may contain significant partial volume effects. Finally, small cohorts were scanned due to workflow pressures and distances between sites; thus, patients at each site were not from homogeneous populations. For these reasons, whereas exact matched comparisons between the patients at the 3 sites were not possible for this early study, studies with closely matched patient populations can be explored in the future.
One of the limitations in this work was the lack of age-matched healthy subjects. However, the focus of this study was on repeatability and reproducibility and not to provide normative ranges for T1 and T2 in the prostate. In order to extend the MRF results to the general population as imaging biomarkers of disease status, repeatability and reproducibility could be assessed in larger populations that include age-matched healthy subjects and patients with different pathologies.
5 CONCLUSION
MRF measurements of T1 and T2 using the MRF-fast imaging with steady-state precession prostate protocol are highly repeatable and reproducible between MRI scanners at different centers on different continents.
FUNDING INFORMATION
National Center for Research Resources (1C06RR12463-01); National Institute of Biomedical Imaging and Bioengineering (P41 EB 015898); National Institutes of Health (1R01CA208236, 1R01EB016728, R01DK098503, R01EB020667, R01HL094557); Siemens Healthineers.
CONFLICT OF INTEREST
Wei-Ching Lo is an employee of Siemens Medical Solutions. No potential conflicts of interest were disclosed by the other authors.


