The Impact of Zinc on Manganese Bioavailability and Cytotoxicity in HepG2 Cells
Abstract
Scope
Despite their essentiality, several studies have shown that either manganese (Mn) or zinc (Zn) overexposure may lead to detrimental health effects. Although Mn is transported by some of the SLC family transporters that translocate Zn, the role of Zn in hepatocellular Mn transport and Mn-induced toxicity have yet to be fully characterized.
Methods and Results
The human hepatoma cell line, HepG2, is utilized. Total cellular Mn and Zn amounts are determined after cells are treated with Zn 2 or 24 h prior to Mn incubation for additional 24 h with inductively coupled plasma-based spectrometry and labile Zn is assessed with the fluorescent probe FluoZin-3. Furthermore, mRNA expression of genes involved in metal homeostasis, and mechanistic endpoints associated with Mn-induced cytotoxicity are addressed. These results suggest that Zn protects against Mn-induced cytotoxicity and impacts Mn bioavailability to a great extent when cells are preincubated with higher Zn concentrations for longer duration as characterized by decreased activation of caspase-3 as well as lactate dehydrogenase (LDH) release.
Conclusions
Zn protects against Mn-induced cytotoxicity in HepG2 cells possibly due to decreased Mn bioavailability. Additionally, mRNA expression of metal homeostasis-related genes indicates possible underlying pathways that should to be addressed in future studies.
1 Introduction
Although intake recommendations for trace elements (TE) proposed by various authorities, such as the German Nutrition Society (DGE) or the European Food Safety Authority (EFSA), can be reached through balanced nutrition, large segments of the general population commonly supplement their diets to optimize TE intake.[1] Despite the essentiality of manganese (Mn) and zinc (Zn), it is well established that overexposure to these TEs can also lead to adverse health effects, among others, caused by unbalanced metal homeostasis.[2, 3]
Mn is involved in several physiological processes, such as antioxidative defense or carbohydrate metabolism.[4] The EFSA proposed in 2013 an adequate intake of 3 mg day−1 for adults, which can easily be attained by drinking water and diet, for example, by consuming rice, grains, or tea.[5] Due to its plentiful dietary sources, Mn deficiency is rarely observed in humans.[6] However, studies have shown that exceeding the homeostatic range may lead to adverse health effects. Cellular and molecular modes of action of Mn-induced toxicity include, among others, mitochondrial dysfunction, induction of protein aggregation, glutamate excitotoxicity, disturbed DNA repair, and impaired homeostasis of other TEs. Additionally, especially oxidative stress has been identified as a sensitive endpoint of Mn-induced toxicity with the formation of reactive oxygen species (ROS), either formed by Fenton chemistry or inhibition of complexes of the mitochondrial respiratory chain.[4, 6]
In contrast, Zn, which is involved in cell cycle regulation, DNA replication, and apoptosis, is a redox-inert TE with antioxidative, anti-inflammatory, and anti-apoptotic functions.[7] However, the antioxidative characteristics of Zn are dependent upon certain dynamic conditions of the amount of labile and protein-bound Zn present in cells.[8, 9] Nevertheless, Zn intake drastically exceeding or falling below the reference intake values of 7.0–10.0 mg Zn per day for women and 11.0–16.0 mg Zn per day for men (recently revised by the Nutrition Societies of Germany, Austria, and Switzerland in 2020)[8-10] has been shown to impact on metal homeostasis and maintenance of the cellular metabolism.[11, 12] For example, high dietary Zn intake may result in copper (Cu) deficiency. Metallothioneins (MTs), which are primarily Zn-binding metalloproteins, have a higher binding affinity for Cu compared to Zn. This, in turn, can lead to enhanced Cu binding with subsequent excretion during the renewal of the intestinal epithelium.[13, 14] In contrast, it has been shown that Zn deficiency may result in oxidative stress or induction of apoptosis by disrupting ERK and AKT, two kinases involved in growth factor signaling.[15] Therefore, maintaining Mn as well as Zn homeostasis is needed for sustaining optimal health.
The human liver is centrally involved in Mn and Zn metabolism. It tightly regulates Mn and Zn distribution to other tissues as well as the hepatobiliary excretion of Mn.[4, 16] The highest Mn amounts of 1.2–1.3 mg kg−1 wet weight[17] are inherent to the liver, while Zn concentrations range between 142 and 369 mg kg−1 dry weight.[18]
Transporters that mediate the transmembraneous translocation of Mn and Zn are among others the divalent metal transporter 1 (DMT1), the ZRT/IRT-like protein (ZIP) family, namely ZIP8 and ZIP14, respectively, and the zinc transporter 10 (ZnT10). Intracellularly, Zn-binding proteins like MTs maintain adequate levels of this TE.[19-23] Transport mechanisms and distribution are well understood for single TEs.[4, 8] However, TE interactions and homeostatic alterations caused by metal mixtures have been seldom characterized. These studies have shown the interrelationship between Mn and Fe uptake, as both TEs compete for metal binding sites of the transporters noted above, as well as for transferrin-bound transport via the transferrin receptor (TfR).[24-26] Additionally, Zn affects Fe homeostasis, mainly during deficiency, since it increases DMT1 as well as ferroportin (FPN) mRNA expression, leading to enhanced Fe efflux.[27-29] These studies have shown that TE transport is highly dependent on metal homeostasis, which may be altered by the induction of regulatory processes caused by other TEs taken up from the environment. Therefore, this study aimed to elucidate mechanisms of metal homeostasis, focusing on Mn and Zn in HepG2 cells in order to characterize alterations which influence metal intake and distribution. HepG2 cells were utilized in this study, since they exhibit key functions of human hepatocytes and express a variety of transporters involved in Mn and Zn homeostasis.[22, 30-33]
2 Experimental Section
2.1 Cultivation of HepG2 Cells
The human hepatoma cell line HepG2 was cultured as described previously.[34] Briefly, HepG2 cells were cultured in Eagle's Minimum Essential Medium (MEM; Sigma–Aldrich, Steinheim, Germany) supplemented with 10 % fetal calf serum (FCS; Biochrom GmbH, Berlin, Germany), 2 % v/v penicillin/streptomycin (Sigma–Aldrich), and 1% v/v non-essential amino acid solution (NEA; Sigma–Aldrich) in a humidified incubator at 37°C with 5% CO2. Cells were sub-cultured every second day using a 0.25 % trypsin-EDTA solution (Sigma–Aldrich).
2.2 Exposure Scenarios and Dosage Regimen
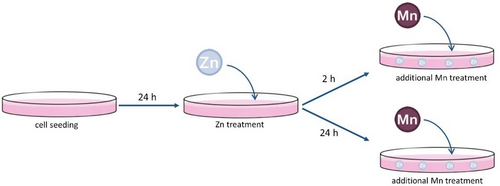
Unless otherwise stated, the abbreviations Mn and Zn referred to both metals in the divalent form (Mn(II) and Zn(II)). To investigate the effect of short- and long-term Zn exposure on Mn transfer and cytotoxicity in HepG2 cells two scenarios were applied. For short-term exposure, cells were preincubated with 50 or 100 µM ZnSO4 for 2 h (24 h after seeding) followed by 24 h incubation with MnCl2. For long-term exposure, cells were preincubated with 50 or 100 µM ZnSO4 for 24 h (24 h after seeding) followed by a 24 h incubation with MnCl2 (Figure 1). In consideration of the cell cycle of HepG2 cells, single MnCl2 treatment was carried out for 26 h (corresponding to 2 h Zn preincubation) and 48 h (corresponding to 24 h Zn preincubation) after seeding. Accordingly, single Zn treatment was realized for 26 h of incubation (corresponding to 2 h pretreatment + 24 h MnCl2 treatment) and 48 h (corresponding to 24 h pretreatment + 24 h MnCl2 treatment).
2.3 Cytotoxicity Testing
Stock solutions of MnCl2 (MnCl2·4H2O, 99.9% TE basis, Honeywell, Morristown, NJ, USA) and ZnSO4 (ZnSO4·7H2O, 99.9% TE basis, Sigma–Aldrich) were prepared in sterile purified water (18 mΩ) prior to the experiment. For the assessment of the cytotoxicity, 15 000 cells cm−2 were seeded in 96-well plates. The cytotoxicity of MnCl2 and ZnSO4 was determined after 24 and 48 h of incubation and for the combined exposures as described in Section 2.2.
2.3.1 Hoechst Assay
For the indirect determination of the cell number by Hoechst staining, cells were fixed using 4 % formaldehyde in PBS followed by permeabilization of the membrane using a solution of 0.2 % Triton X-100 in PBS (Sigma–Aldrich). After permeabilization, Hoechst dye (Bisbenzimide H 33258, Calbiochem, Sigma–Aldrich) interacted with the DNA of living cells.[35] Subsequently, fluorescence was detected with a microplate reader (Tecan Infinite Pro M200, Tecan, Crailsheim, Germany; Ex: 355 nm;Em: 460 nm).
2.4 Mn and Zn Bioavailability
For the determination of Mn and Zn bioavailability, cells were seeded in 6 cm diameter cell culture dishes (growth area 22.1 cm2) and incubated with Mn and/or Zn, respectively (see Section 2.2). After incubation, cells were pelletized by detaching from the culture dish using 0.25 % trypsin-EDTA (Sigma–Aldrich) and washing with ice-cold PBS containing 5 % FCS (Biochrom GmbH). The cell suspension was centrifuged at 340 × g, 4°C for 5 min. The supernatant was removed and the cell pellet was resuspended in ice-cold PBS to remove the remaining FCS. After another centrifugation (3750 × g, 4°C, 5 min) and removal of the supernatant, cell pellets were stored at −20°C until further analysis. For TE measurement, cells were first digested with a mixture of 65 % HNO3 (Suprapur is a trademark of Merck, VWR, Darmstadt, Germany) and 30 % hydrogen peroxide (Sigma–Aldrich) at 95°C over-night. Ashes diluted in 2 % HNO3 were measured with an inductively coupled plasma-optical emission spectrometer (ICP-OES; Spectro, Krefeld, Germany) or Agilent ICP-MS/MS Triple Quadrupole Mass Spectrometer (ICP-QQQ-MS 8800, Agilent, Waldbronn, Germany). Measurement parameters can be found in the supplementary information (Tables S1, S2). ICP measurements were validated using certified reference material BCR (single cell protein, Institute for Reference Materials and Measurement of the European Commission, Geel, Belgium), which was digested according to the protocol for cells. The cellular TE amount was normalized to cell volume, which was determined using an automated cell counter (CASYTTC, OMNI Life Science GmbH, Bremen, Germany).
2.5 Determination of Labile Zn [Zn2+] Using FluoZin-3
2.6 Caspase-3 Activity and Lactate Dehydrogenase Assay
Both caspase-3-activity, as well as the measurement of lactate dehydrogenase (LDH) release, were assays serving as an endpoint for the cell death mechanism. While caspase-3 was activated during apoptosis, LDH was released during the process of necrotic cell death.[38, 39]
2.6.1 Caspase-3 Activity
Caspase-3 activity was determined by cleavage of the substrate N-acetyl-asp-glu-val-asp-7-amino-4-trifluoromethylcoumarin (Ac-DEVD-AFC) into the fluorescent residue 7-amino-4-trifluoromethylcoumarin (AFC). For this, 18 000 cells cm−2 were seeded in a 24-well plate and incubated according to the exposure scenarios (see Section 2.2). After incubation, cells were washed with PBS to remove the remaining medium. Afterward, cells were lysed using a lysis buffer (1 mM Tris, 0.1 M NaCl, 1 mM EDTA disodium salt, and 0.1 % Triton X-100) for 15 min on ice. Cells were scraped from the culture dish and transferred into a reaction tube. The cell suspension was centrifuged for 10 min at 16 000 × g, and 4°C. An aliquot of the supernatant was transferred into a black 96 well plate. The substrate AFC (7.3 µM) was added to the supernatant, diluted in a reaction buffer consisting of caspase buffer (41 mM PIPES, 10 mM EDTA disodium salt, 8 mM CHAPS, pH 7.4) and 1 mM dithiothreitol and the solution was incubated at 37°C for 1 h. Subsequently, fluorescence intensity was measured every hour using a microplate reader (Tecan Infinite Pro M200, Tecan, Crailsheim, Germany; Ex: 405 nm, Em: 510 nm). AFC content was quantified via external calibration and normalized to protein amount determined by bicinchoninic acid (BCA) assay. Additionally, the assay was validated beforehand with staurosporine as a positive control.[40]
2.6.2 Lactate Dehydrogenase Assay
In case of necrotic cell death, LDH was released into the cell culture medium because of an impaired cell membrane. For the assessment of released LDH, the conversion of pyruvic acid to lactate was used. Available LDH reduced nicotinamide adenine dinucleotide (NADH) to NAD+, resulting in a measurable change in absorption.[41] After incubation (see Section 2.2), an aliquot of the cell culture medium was transferred into a black 96-well plate. Cells were lysed as described in Section 2.6.1 and the resulting supernatant was transferred as well. The LDH reaction buffer consisting of 0.2 mM NADH disodium salt (Roth, Karlsruhe, Germany), 10 mM pyruvic acid (Roth, Karlsruhe, Germany), and LDH buffer (100 mM HEPES buffer, pH 7.0) was added to start the reaction. Absorption at 355 nm was measured every 54 s for 50 cycles with a microplate reader (Tecan Infinite Pro M200, Tecan, Crailsheim, Germany). LDH release was normalized to the protein amount determined by the BCA assay.
2.6.3 Determination of the Protein Amount via BCA Assay
The determination of the protein amount was based on the formation of a colored chromophore after the complexation of Cu(I)-ions with BCA in the presence of protein.[42] Briefly, after cell rupture, the supernatant was mixed with a solution of BCA (Sigma–Aldrich) and Cu(II)sulfate (Sigma–Aldrich) in a 1:50 ratio and incubated at 37°C for 30 min. Thereafter, the mixture was further incubated for 1 h at room temperature (RT), and absorbance was measured at 560 nm using a microplate reader (Tecan Infinite Pro M200, Tecan, Crailsheim, Germany).
2.7 RT-qPCR Analysis of Transport-Associated Genes
For the determination of the mRNA expression of metal transport-associated genes, HepG2 cells were pelletized from culture dishes according to Section 2.4. RNA isolation was achieved using the NucleoSpin extraction kit (NucleoSpin is a trademark of Marcherey-Nagel GmbH & Co. KG, Düren, Germany) and the RNA amount was quantified using a NanoDrop One Spectrometer (Thermo Fischer Scientific, Waltham, MA, USA). RNA with absorption ratios higher than 2.0 (A260/A280; A260/A230) were used for cDNA transcription using the High-Capacity cDNA Reverse Transcription Kit (Applied Biosystems, Thermo Fischer Scientific) according to the manufacturer's protocol. RT-qPCR analysis was realized by the SYBR green method using iQ SYBR Green Supermix (iQ SYBR is a trademark of Bio-Rad Laboratories Inc., Hercules, California, USA) as fluorescent probe. Before analysis, primer efficiencies were determined and product purity was verified via gel electrophoresis. Primers with efficiencies ranging from 100 %–120 % were used (Table S3). The temperature program with polymerase activation at 95°C for 3 min, DNA denaturation at 95°C for 30 s, primer annealing at 56°C for 1 min, and extension at 72°C for 15 s (repeated 37 times) was carried out on the Agilent AriaMx Real-time PCR System (Agilent). For metal regulatory transcription factor 1 (MTF1) gene expression analysis, the annealing temperature was adjusted to 54°C. For every measurement, a melting curve analysis was performed with a DNA denaturation at 95°C for 1 min and a subsequent increment from 60°C–95°C within 1 min. Relative gene expression was normalized to the housekeeping gene ACTB (β-actin) and was calculated in consideration of the primer efficiency.
2.8 Statistical Analysis
Statistical analysis was performed with GraphPad Prism 9 Software (GraphPad Software, La Jolla, CA, USA). Data were shown as means ± SD of at least three independent experiments and significance values were depicted as *p < 0.05, **p < 0.01, and ***p < 0.005 compared to untreated control unless otherwise stated.
3 Results
3.1 Zn Preincubation Results in Reduced Mn Cytotoxicity
In order to investigate the impact of combined Zn and Mn incubation on Mn-induced cytotoxicity in HepG2 cells, Mn cytotoxicity alone (also shown in comparison to Zn alone in Figures S1, S2) was compared to the combined incubation with Mn after Zn pretreatment. While cell survival was significantly affected after treatment with 200 µM Mn and higher for 24 h (79.1 % ± 9.5 % of cell number relative to untreated control) neither a preincubation with 50 µM ZnSO4 for 2 nor 24 h led to a decrease in cytotoxicity compared to Mn treatment alone (Figure 2a). Increasing the concentration of ZnSO4 to 100 µM led to a significant attenuation of Mn-induced cytotoxicity from 75 to 1000 µM MnCl2 after 24 h pretreatment, but not for 2 h pretreatment (65.7 % ± 11.5 % relative to untreated control for 500 µM MnCl2 versus 94.2 % ± 10.5 % relative to untreated control for the combination of 100 µM ZnSO4 [24 h] + 500 µM MnCl2 [24 h]) (Figure 2b).

 ) or 24 h (
 )) + Mn (24 h) with Mn treatment alone (
 ), B) time-dependent comparison of 100 µM Zn (2 h (
 ) or 24 h (
 )) + Mn (24 h) with Mn treatment alone (
 ). Shown are the means ± SD of at least three independent experiments. Statistical significance is depicted as **p < 0.01: Mn treatment alone compared to untreated control (unpaired Student's t-test), §§p < 0.01: combination of preincubation of 100 µM ZnSO4 for 24 h and MnCl2 treatment for additional 24 h compared to Mn treatment alone (two-way ANOVA with Šidák's multiple comparisons).
3.2 Zn Preincubation Influences the Mn-Induced Changes in Protein Content, Caspase-3 Activity, and LDH Release
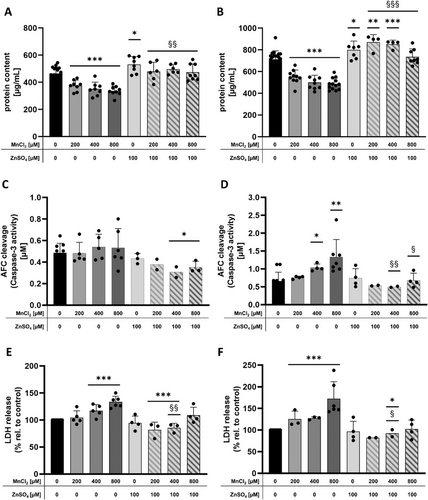
In addition to the cytotoxicity testing with the Hoechst assay, caspase-3 activity, LDH release, and protein content were measured to characterize the possible cytotoxicity pathways and mechanisms. HepG2 cells were treated with 200 µM MnCl2 (start of the cytotoxic range), 400 µM MnCl2 (cytotoxic), and 800 µM MnCl2 (cytotoxic) alone or in combination with 2 or 24 h pretreatment with 100 µM ZnSO4. Mn treatment alone (200–800 µM) resulted in significantly reduced protein content compared to untreated control 24 h (Figure 3a), as well as 48 h after seeding (Figure 2b). In contrast, ZnSO4 treatment alone led to a significantly increased protein content (modulating 2 h of pretreatment) (Figure 3a); and additionally, upon the combination with 200 and 400 µM MnCl2 after 24 h of pretreatment (Figure 3b). Caspase-3 activity was significantly decreased upon combined treatments with 100 µM ZnSO4 + 400 or 800 µM MnCl2 for 2 h of pretreatment compared to untreated control (Figure 3c). In comparison, caspase-3 activity was induced by incubation with 400 and 800 µM MnCl2, which was reversed by pretreatment with 100 µM ZnSO4 for 24 h (Figure 3d). Furthermore, LDH release was significantly increased upon treatment with 400 and 800 µM MnCl2 24 h after seeding (Figure 3e) and significance was also attained for 200 µM MnCl2 48 h after seeding (Figure 3f). Concurrent incubation of 200 and 400 µM MnCl2 with 100 µM ZnSO4 (2 h pretreatment) resulted in a significantly decreased LDH release compared to untreated control and Mn treatment alone (Figure 3e). The same was observed after 24 h pretreatment with 100 µM ZnSO4 in combination with 400 µM MnCl2 (Figure 3f).
3.3 Effect of Mn and Zn on TE Bioavailability
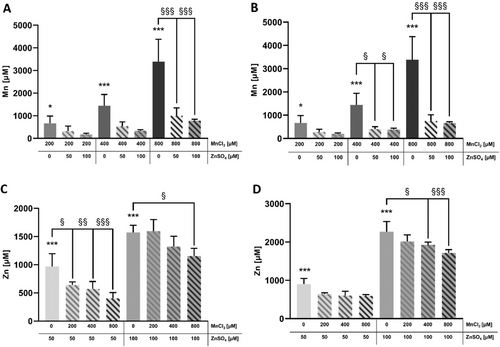
To investigate if altered Mn, as well as Zn concentrations, accounted for the attenuated Mn cytotoxicity (upon Zn pretreatment) in HepG2 cells, cellular Mn as well as Zn contents were measured with ICP-OES or -MS/MS, and normalized to cell volume in order to compare incubated concentrations with resulting cellular concentrations. Untreated control cells contained 20.5 ± 9.2 µM Mn and 286.3 ± 83.7 µM Zn. Overall, MnCl2 treatment alone resulted in an increased Mn concentration between 664.2 ± 323.2 µM (200 µM MnCl2) and 3388.1 ± 987.0 µM Mn (800 µM MnCl2) in HepG2 cells irrespective of whether the cells were treated 24 or 48 h after seeding (Figure 4a, b). Combined exposure to 800 µM MnCl2 with 50 or 100 µM ZnSO4 significantly decreased Mn concentrations after 2 h preincubation, as well as upon treatment with 400 or 800 µM MnCl2 after 24 h preincubation with ZnSO4 (Figure 4a, b). Analogous to MnCl2 treatment alone, application of ZnSO4 in the absence of Mn resulted in a concentration-dependent significant increase in Zn concentration compared to untreated cells (Figure 4c, d). Combined treatment with 200, 400, or 800 µM MnCl2 2 h after ZnSO4 treatment for additional 24 h showed a significant decrease in cellular Zn compared to 50 µM ZnSO4 treatment alone, as well as for 100 µM ZnSO4 + 800 µM MnCl2 (Figure 4c). Twenty-four hours of ZnSO4 preincubation further significantly influenced cellular Zn concentrations in the combination of 100 µM ZnSO4 + 400 µM MnCl2 and 100 µM ZnSO4 + 800 µM MnCl2. However, all other dose combinations showed a slight trend for decreased Zn concentrations in HepG2 cells (Figure 4c, d).
3.4 Labile Zn [Zn2+] Measurement
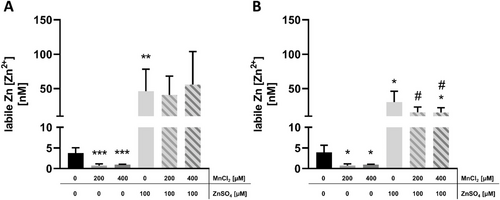
To determine the amount of [Zn2+], which is crucial for Zn activity in HepG2 cells,[43] the FluoZin-3 dye was used. Incubation with 100 µM ZnSO4 led to a significant increase of [Zn2+] with concentrations up to 46.4 and 30.5 nM after to 2 and 24 h of preincubation, respectively (Figure 5a, b). In contrast, Mn treatment alone significantly decreased [Zn2+] compared to untreated control, independent of preincubation time (Figure 5a, b). Concurrent incubation of 100 µM ZnSO4 together with either 200 or 400 µM MnCl2 had no additional effect on [Zn2+] compared to Zn treatment alone (Figure 5a, b).
3.5 qPCR Analysis of Transporter-Associated and Transport Protein-Related Genes Involved in Mn and Zn Transport
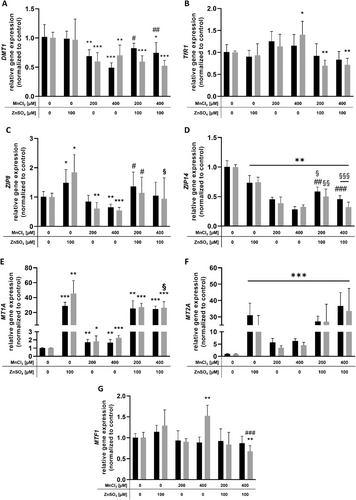
Since intracellular Mn and Zn concentrations were decreased after combined incubation with ZnSO4 and MnCl2 in all exposure scenarios, the RT-qPCR analysis of transporters involved in Mn and Zn transport was deemed to be important for providing possibly affected transport systems. MnCl2 treatment alone decreased mRNA expression of DMT1, ZIP8, and ZIP14, while MT1A, MT2A, as well as TfR1 (for 400 µM MnCl2) gene expression were significantly increased (Figure 6a–f). While ZnSO4 treatment alone significantly decreased ZIP14 mRNA expression, ZIP8 gene expression was significantly upregulated in all exposure scenarios, also showing a significant induction of MT1A and MT2A gene expression up to 45-fold compared to the untreated control (Figure 6c–f). DMT1 mRNA expression was significantly downregulated upon combined treatment of 100 µM ZnSO4 + 200 µM MnCl2 (after 2 and 24 h preincubation) and 100 µM ZnSO4 + 400 µM MnCl2 (after 2 h preincubation) compared to untreated control. Compared to Mn treatment alone, DMT1 mRNA expression was significantly less affected in both combinations with 100 µM ZnSO4 with a preincubation time of 2 h (Figure 6a). TfR1 and ZIP14 gene expressions were significantly downregulated upon combined Mn and Zn treatments as well, whereas preincubation with 100 µM ZnSO4 for either 2 or 24 h reversed the decrease in ZIP14 mRNA expression compared to treatment with MnCl2 alone (Figure 6b, d). Interestingly, MT1A and MT2A gene expressions were also significantly upregulated in the respective combined treatments, independent of the preincubation time. In comparison to ZnSO4 treatment alone, the time-dependent increased induction of MT1A gene expression by Zn (24 h preincubation) was completely compensated upon combined treatment of Zn with 400 µM MnCl2 (Figure 6e, f). The mRNA expression of MTF1, which is involved in MT regulation, was significantly upregulated by incubation with 400 µm MnCl2 alone, whilst significantly downregulated upon combined treatment with 100 µm ZnSO4 (24 h pretreatment) (Figure 6g).
 ) or 24 h (
 ) following 24 h MnCl2 treatment. Relative mRNA expression was assessed using RT-qPCR and normalized to ACTB as housekeeping gene. Shown are the means + SD of at least three independent experiments with two technical replicates each for a) DMT1, b) TfR1, c) ZIP8, d) ZIP14, e) MT1A, f) MT2A, and g) MTF1, respectively. Statistical significance was determined by an unpaired Student's t-test with Welch's correction, depicted as *p < 0.05, **p < 0.01, ***p < 0.05: compared to untreated control, §p < 0.05, §§p < 0.01, §§§p < 0.05: compared to Zn treatment alone, #p < 0.05, ##p < 0.01, ###p < 0.05: compared to Mn treatment alone. ACTB, β-actin; DMT1, divalent metal transporter 1; mRNA, messenger RNA; MT1A, metallothionein 1A; MT2A, metallothionein 2A; MTF1, metal regulatory transcription factor 1; TfR, transferrin receptor; ZIP, ZRT-, IRT-like protein.
4 Discussion
Mn and Zn are indispensable for multiple processes involved in human metabolism to sustain health.[4, 7] In order to optimize TE supply, a large segment of people tend to resort to TE supplements even when consuming adequate amounts in their nutrition.[1] While many studies have focused on the adverse health effects of Mn or Zn overexposure, the effects of Mn and Zn interactions have yet to be fully characterized.[6, 12] However, this is a more realistic exposure scenario, because nutrition is composed of more than one micronutrient. For example, grain-based products are rich in Mn and Zn, as well as supplements often contain both.[1, 5, 44] Physiological TE resorption is tightly regulated in the intestine.[45] However, patients with liver dysfunctions or in case of administration of total parenteral nutrition (PN) are more vulnerable to metal-induced toxicity, because Mn and Zn are not excreted optimally, or the efficient homeostasis of the intestine is bypassed and high amounts of Mn and Zn reach the liver due to bioavailability of almost 100% (such as upon iv PN).[4, 46]
This study addressed a gap in knowledge regarding Mn and Zn interactions upon overdosing, taking advantage of the human hepatoma cell line HepG2, which is widely used in pharmaco-toxicological research as it mimics most functions of human hepatocytes.[47] HepG2 cells express a variety of metal transporters also involved in Mn and Zn transport, such as DMT1, TfR, ZIP8, and ZIP14 as well as several MT isoforms.[22, 31-33] Recently, studies have shown that ZIP8 and ZIP14, initially associated with Zn transport, also play an essential role in systemic Mn homeostasis.[48] Even though the Mn and Zn concentrations applied in this study cannot result in serum from dietary Mn and Zn intake, administration of PN, as well as liver dysfunction may lead to Mn and Zn accumulation potentially exceeding homeostatic control in liver tissue.[46, 49]
With a focus on cytotoxicity, incubation with 200 µM MnCl2 was sufficient to significantly reduce HepG2 cell viability after 24 h of incubation. Investigation on mechanisms associated with the cell death revealed induction of caspase-3 and LDH release, which were dependent on the seeding time. Surprisingly, a significant induction of caspase-3 activity was only observed in cells incubated with MnCl2 48 h after seeding (corresponding to the scenario of 24 h preincubation with ZnSO4), while LDH release was evident throughout and independent of the seeding time. Mn cytotoxicity has often been associated with apoptosis (reviewed in ref. [50]), consistent with the enhanced caspase-3 activity observed in this study. Simultaneous induction of LDH release, however, may also indicate combined apoptosis and necrosis, defined as regulated necrosis or parthanatos, which has already been postulated by Porte Alcon et al. in the context of Mn-induced murine microglial cell death.[51] Additionally, the absence of caspase-3 activation in cells incubated 24 h after seeding with Mn might be indicative of the initiation of cellular senescence and subsequent cell cycle arrest, which has been associated with Mn-induced DNA damage and dysregulated DNA repair.[52-54] Interestingly, preincubation with 100 µM ZnSO4 24 h before Mn treatment for additional 24 h decreased caspase-3 activation and LDH release, resulting in increased cell survival of HepG2 cells in comparison to cells treated with Mn alone. However, it is not clear whether Zn is preventing the induction of oxidative stress, which, in turn, would lead, among other effects, to decreased cell death, or if it is interfering with regulatory factors involved in anti-apoptotic or anti-necrotic pathways.[55] Zn regulates apoptotic as well as anti-apoptotic factors such as Bax and Bcl-2. In HepG2 cells exposed to 10 µg mL−1 aflatoxin B1 (AFB1), it has been shown that concurrent incubation with 50 µM ZnSO4 led to decreased Bax and increased Bcl-2 induction, therefore, alleviating AFB1-induced apoptosis.[56] The precise role and mechanism of Zn-induced HepG2 cell survival after MnCl2 treatment needs to be elucidated in further studies, focusing on oxidative stress endpoints including gene and protein expression of senescence, oxidative stress, and DNA damage-associated genes.
Nevertheless, alleviation of Mn-induced cytotoxicity by Zn may also be explained by Mn and Zn bioavailability and alterations in gene expression of transport-associated genes. Quantifying the cellular TE concentrations in this study revealed that Zn is strongly affecting intracellular Mn concentrations in HepG2 cells, leading to a prominent decrease in cellular Mn upon exposure in combination with Zn. Furthermore, the effect of Mn on cellular Zn concentrations is not as strong, but with an apparent Mn concentration-dependency (Figure 4c, d). This effect was not observed in the study by Liu et al., which investigated the protective effect of Zn in cultured rat primary hepatocytes in comparable dose regimes.[57] Since cellular Mn concentrations are significantly decreased by the combined treatment with 50 or 100 µM ZnSO4 + 400 µM MnCl2 within 24 h of preincubation, but not after 2 h of preincubation, an influence of Zn on transport regulation at a translational level seems plausible. Fujishiro et al. revealed that after inhibition of ZIP8 and ZIP14 with siRNA transfection in mouse cells of the proximal tubule, Mn uptake was reduced to about 70% and 50%, respectively.[58] Xin et al. corroborated this observation by investigating Mn homeostasis in hepatocyte-specific ZIP14-knockout mice. Upon consumption of a high Mn diet, these mice had increased Mn levels in the brain and pancreas, but not in the liver.[59] Several studies have focused on the metal binding affinity of ZIP8 and ZIP14 and their involvement in either Mn or Zn transport showing that divalent metal transport by ZIP8 and ZIP14 can be described by Michaelis–Menten kinetics with Vmax factors of 2.0 µM for Mn(II) in HepG2 cells[19] and 0.26 µM for Zn(II) determined in Xenopus oocytes, leading to the hypothesis that Mn may be one of the physiological substrates for ZIP8.[60] This could be explained by studies by Kambe et al. investigating the amino acid composition in the active site of various ZIPs. Higher affinity of Mn(II) to ZIPs in comparison to Zn(II) has been attributed to the preferential binding of Mn(II) to aspartic acid and asparagine residues prevalent in the ZIP metal-binding site.[61] Regarding cellular metal transporters, transport by ZIPs may not be the main pathway involved in Mn and Zn transport. DMT1, as well as TfR1, have been implicated predominantly Mn but not Zn transport, due to the physiologically relevant trivalent oxidation state (relevant for metal transport via TfR) and pH dependency during uptake, representing an important factor for divalent metal transport by DMT1.[26, 62] Although Zn is involved in mRNA regulation of both DMT1 and TfR1 with the iron responsible element (IRE) as a possible target.[63] Therefore, focusing on alterations in gene expression of involved transporters may clarify their role in Mn and Zn interactions.
In general, DMT1, ZIP8, and ZIP14 mRNA expression were downregulated by Mn treatment alone. In the case of Mn overexposure, metal importers have been shown to be downregulated as to mitigate accumulation and ensuing formation of ROS.[64] One exception is the increased mRNA expression of TfR1 upon 24 h of Zn preincubation, after exposure to 400 µM MnCl2 (Figure 6b). Upregulation of metal importers is often associated with TE requirements in case of deficiency.[26] However, TfR1 upregulation may rather be associated with impaired Fe homeostasis. Herbison et al. have shown that TfR1 gene expression was upregulated in order to compensate for reduced Fe uptake in the presence of transferrin-bound Mn, but it is not the focus of this study, yet should be addressed in future research.[65]
Interestingly, although ZIP8 and ZIP14 are phylogenetically related, but distinct from the other 12 ZIPs,[66] ZIP8 and ZIP14 mRNA expression showed differential response profiles upon single Zn treatment. While ZIP8 was significantly upregulated after exposure to 100 µM ZnSO4, ZIP14 gene expression was downregulated, independent of the exposure duration. With reference to ZIP8 and ZIP14, it is not obvious if altered mRNA expression is the cause or consequence of excess metal in cultured HepG2 cells. Transcriptional ZIP8 upregulation has been shown as part of the anti-inflammatory pathway involving NF-κB.[67] In case of inflammation, ZIP8 provides a NF-κB binding site, increasing the sequestration of cytosolic Zn. In turn, cytosolic Zn, negatively regulates NF-κB activation by inhibition of the IκB kinase, leading to decreased induction of inflammation.[67] This hypothesis has been corroborated by Foligné et al., showing a Zn-dependent inhibition of intestinal inflammation caused by experimentally induced mouse models of colitis. They postulated an induction of Mt1 and Mt2 gene expression in the colon of healthy mice after administration of a dietary high-dose Zn supplementation as a possible reason preventing gut inflammation.[68] The same effect has been observed in the present study as treatment with 100 µM ZnSO4 also led to increased ZIP8 and MT1A and MT2A mRNA expression. In addition, treatment with 200 or 400 µM MnCl2 in the absence of ZnSO4 also increased MT1A and MT2A gene expression in HepG2 cells, however not as strongly as Zn treatment alone. Since MTs themselves do not bind Mn, as shown by Waalkes et al. and others, MTs induced by Mn treatment are likely to bind Zn ions, which is in line with the decreased [Zn2+] amounts in HepG2 cells after Mn treatment alone observed in our study.[69, 70] Furthermore, Kobayashi et al. described a dose-dependent MT induction by Mn administration in ICR mice liver with a rapid increase in interleukin-6 in the serum of these mice which may also contribute to inflammation.[70] Contrary to our findings, they observed upregulation of ZIP14 mRNA.[70] Herein, Mn treatment alone led to decreased ZIP14 mRNA in HepG2 cells. This may reflect a response to excess Mn present in the medium in order to avoid metal accumulation. Moreover a study by Zhao et al. have shown a contribution of p53 in ZIP14 mRNA regulation corroborating the hypothesis regarding Mn cytotoxicity and the induction of cellular senescence.[71] Additionally, in the case of cellular senescence NF-κB is also involved as a master regulator for the immune survival of senescent cells, therefore also contributing to the hypotheses postulated before.[72]
In summary, data obtained in this study showed that Zn alleviated Mn cytotoxicity, possibly due to decreased Mn bioavailability. However, the underlying mechanisms for this observation cannot yet be fully explained by the changes in mRNA expression of transporters inherent both to Mn and Zn uptake. In addition, the mechanisms proposed have to be addressed in future studies to better characterize the precise mechanisms of Zn and Mn interactions in HepG2 cells. Nevertheless, this novel study provides a closer look at the effects of combined exposure of Zn and Mn, establishing that Zn as well as Mn homeostasis, and corresponding regulatory processes are interdependent.
Acknowledgements
This work was supported by the DFG Research Unit TraceAge (FOR 2558, BO4103/4-2, HA 4318/4-2).
Conflict of Interest
The authors declare no conflicts of interest.
Author Contributions
V.M and J.B. conceptualized the study and wrote the manuscript. S.K. conducted the RT-qPCR experiments and realized labile Zn measurements. J.P. applied the caspase-3, LDH, and BCA assay. L.N. did the cytotoxicity measurement and with S.K. the bioavailability experiments. F.E. assisted with helpful tips in the handling of the in vitro system and established the protocols of the caspase-3 and LDH assay beforehand. H.H. and A.T. supported the experimental design and together with T.S. with important intellectual input. M.A. revised the manuscript critically for important input. All authors were involved in manuscript preparation and approved the final version. J.B. rendered this work possible.
Open Research
Data Availability Statement
The data that support the findings of this study are available from the corresponding author upon reasonable request.


