Small noncoding RNA sRNA0426 is involved in regulating biofilm formation in Streptococcus mutans
Luoping Yin and Wenhui Zhu contributed equally to this work.
Graphical Abstract
This study focuses on the role of small noncoding RNA both in standard Streptococcus mutans and clinical strain biofilms. sRNA0426 is potentially involved in the biofilm formation of S. mutans. The results of this study provide new insights into the complex biofilm regulatory network in S. mutans, which infers a new possibility for dental caries prevention.
Abstract
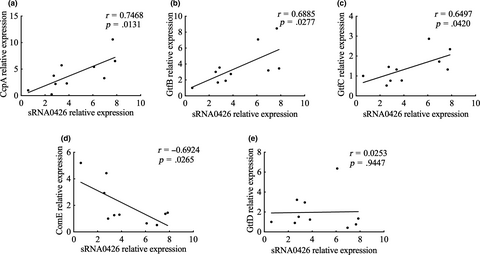
Evidence suggests that small noncoding RNAs (sRNAs) are involved in the complex regulatory networks governing biofilm formation. Few studies have investigated the role of sRNAs in Streptococcus mutans (S. mutans). In the present study, the association between sRNA and biofilm formation in S. mutans was explored. sRNAs that are differentially expressed in the biofilm and planktonic states of this bacterium were identified by quantitative real-time PCR (qRT-PCR). Confocal laser scanning microscopy was used to investigate the characteristics of biofilm formation in a standard strain of S. mutans (UA159, ATCC 700610) and ten clinical strains. Bioinformatics analyses were employed to predict and examine potential sRNA regulatory pathways. The results showed that sRNA0426 has a strong positive relationship with dynamic biofilm formation. Moreover, sRNA0426 expression was positively correlated with exopolysaccharide (EPS) production. Bioinformatics analyses showed that sRNA0426 is involved in biofilm formation such as metabolic pathways, especially carbon metabolism. Five target mRNAs (GtfB, GtfC, GtfD, ComE, and CcpA) involved in the synthesis of EPS were selected for further evaluation; the expression levels of three of these mRNAs (GtfB, GtfC, and CcpA) were positively correlated with sRNA0426 expression levels, and the expression level of one (ComE) was negatively correlated. In conclusion, the results suggested that sRNA0426 may play an important and positive role in the biofilm formation of S. mutans and provide novel insight into the S. mutans biofilm regulatory network.
1 INTRODUCTION
Streptococcus mutans (S. mutans), the bacterium currently recognized as the main microbiological cause of dental caries, depends on the formation of biofilms to exert its virulence (Klein, Hwang, Santos, Campanella, & Koo, 2015). Compared to the planktonic form, biofilm formation provides S. mutans with a better opportunity to adapt to the changing environment in the oral cavity over a planktonic condition (Flemming & Wingender, 2010; Krzysciak, Jurczak, Koscielniak, Bystrowska, & Skalniak, 2014; Welin-Neilands & Svensater, 2007). Therefore, it is important to explore the mechanism of biofilm formation in S. mutans.
Small noncoding RNAs (sRNAs) are typically 50–400 nt in length and continuously fine-tune regulatory networks to enable concentration-specific responses to environmental cues by sequestering, antagonizing, or activating regulatory mRNAs and proteins (Chambers & Sauer, 2013). sRNAs play pivotal roles in regulating gene expression under various conditions, thereby promoting adaptation to a changing environment, especially the biofilm microenvironment (Faizan et al., 2017; Roop et al., 2017; Tsai et al., 2013). It is increasingly appreciated that sRNAs are involved in the complex regulatory mechanisms that govern biofilm development, including the switch between planktonic and biofilm states in bacteria (Caldelari, Chao, Romby, & Vogel, 2013; Chambers & Sauer, 2013; Ghaz-Jahanian, Khodaparastan, Berenjian, & Jafarizadeh-Malmiri, 2013). For example, Zhao, Koestler, Waters, and Hammer (2013) found that Qrr sRNAs simultaneously negatively and positively regulate expression of the hapR gene and the vca0939 gene, respectively, to promote biofilm formation in Vibrio cholera. In Streptococcus sanguinis, two sRNAs that negatively regulate biofilm formation by inhibiting the expression of the target pilT gene were recently identified (Ota et al., 2018).
Additionally, Lee and Hong (2012) revealed more than 900 sRNAs and highlighted the importance of sRNAs in S. mutans. In a previous study, we established a library of 736 differentially expressed candidate sRNAs associated with initial adhesion in S. mutans UA159 by RNA deep sequencing (Zhu, Liu, Liu, Zhou, & Lin, 2018). Moreover, we observed a consistent correlation between the expression of sRNAs and initial adhesion ability in 100 clinical strains of S. mutans (Zhu et al., 2018). Initial adhesion is the first step in biofilm formation, the processes of which include reversible attachment, irreversible attachment, maturation, and dispersion (Hinsa, Espinosa-Urgel, Ramos, & O'Toole, 2003). The microbial composition and structure change dynamically during biofilm formation. Although sRNAs are widely considered to act as key regulators in biofilm formation (Svenningsen, 2018), there has been limited investigation of the role of these molecules in the dynamic process of biofilm formation (Kreth, Liu, Chen, & Merritt, 2015), and it remains unknown whether sRNA exerts an important role during the process of biofilm formation in S. mutans.
In this study, we first screened sRNAs associated with biofilm formation in the standard strain of S. mutans UA159 and then investigated the potential association between sRNAs and biofilm formation and the production of exopolysaccharide (EPS) in clinical strains of S. mutans. Bioinformatics analysis was used to predict and verify the potential regulatory mechanisms employed by candidate sRNAs. The results highlight the function of sRNAs in the dynamic regulation of biofilm formation and provide a promising avenue for developing novel methods of caries prevention by targeting S. mutans.
2 METHODS
2.1 Bacterial strain and culture conditions
The strains used in the present study included the standard strain of S. mutans (UA159ATCC 700610) and clinical isolates. Clinical isolates were obtained from an epidemiological survey conducted in Guangdong Province, People's Republic of China, in 2015 (Yu et al., 2015). The survey was conducted among 5-year-old children. A total of 215 clinical strains were isolated from 215 children with different caries status (Zhu et al., 2018). From these isolates, 10 clinical strains were randomly selected. The S. mutans strains were grown in brain heart infusion (BHI) broth (Oxoid) overnight under anaerobic conditions (80% N2, 20% CO2) at 37°C. The optical density at 600 nm (OD600) of overnight-cultured strains was measured using a microplate reader (Bio-tek, Epoch 2, America). UA159 suspensions (OD600 = 0.7) were inoculated at 1:20 into fresh BHI in round-bottom 6-well plates to obtain planktonic cells; the same suspensions (OD600 = 0.7) were inoculated at 1:20 into fresh BHI in flat-bottom 6-well plates and incubated for 4 h, 6 h, 12 h, and 24 h to monitor the dynamic biofilm formation process of S. mutans.
2.2 RNA extraction
Planktonic bacteria were collected by centrifugation at (13201 g) for 5 min. Biofilm bacteria were scraped from plates and centrifuged at (13201 g) for 5 min. Total RNA extraction was performed according to the method described by Zhu et al. (2017). Briefly, total RNA was stabilized with RNAprotect Bacteria Reagent (Qiagen) before extraction. Biofilms were harvested and washed three times with phosphate-buffered saline (PBS). The total RNA of biofilm cells was purified using a miRNeasy Mini Kit (Qiagen). A Thermo Scientific NanoDrop 2000 instrument (NanoDrop Technologies) and an Agilent 2100 system (Agilent Technologies) were used to assess RNA quality and quantity.
2.3 Quantitative real-time PCR (qRT-PCR)
The top twenty significantly differentially expressed sRNAs were selected as candidates from our sRNA library established in a previous study (Zhu et al., 2018). These candidate sRNAs were further analyzed between planktonic and biofilm conditions of S. mutans at 24 h by qRT-PCR. cDNA was synthesized using a Mir-X miRNA First-Strand Synthesis Kit (Takara and Clontech) according to the manufacturer's recommended protocol. qRT-PCR was performed using a LightCycler 96 Real-Time System and the SYBR Premix Ex Taq II Kit (Takara and Clontech). The primers used for sRNAs in this study are listed in Table 1. The reaction conditions were 95°C for 30 s followed by 40 cycles of 95°C for 15 s and 60–63°C for 30 s. The expressions of sRNAs were normalized to the 16S rRNA expression level.
| sRNA ID | Primers | |
|---|---|---|
| Forward | Reverse | |
| sRNA0698 (Zhu et al., 2018) | CTATTTCTGTTCTATTTTACCACA | Universal primer |
| sRNA0593 (Zhu et al., 2018) | CGCCAATCATTTCATTTTCCA | CCTACGTTTCCCGTGCCTAA |
| sRNA0074* | TACTGGAATAATGTTTAATTTTACT | Universal primer |
| sRNA0522* | CAATAGTAATAAGGTAAAGTGCG | GTATCTCGTAAATACTACAAAGAATT |
| sRNA0426* | ATTGGATAAGACCGTTACACA | AAATAGCGAGACAAGAAAGTT |
| sRNA0413* | AATAATAAGTCCGCAAAAATC | AAGGTGGATTAGGTAAAGATG |
| sRNA0650* | TTAGCATCTTTTACATCACAATA | TGATTCTTCTTTATGGGACA |
| sRNA0146* | AGCTAGTTGCTATAATTAATAATTT | TTCTCTTCAGTTAGACAATCTCT |
| sRNA0215* | TTGTGAAGCTCTCAATAAGTT | GATGTATCCAATGAATCAGTGA |
| sRNA0120* | TAAGCGTAAGCGGCAAAACT | AATAGCTGGGCTTCAGGTGC |
| sRNA0118* | AATATTGATTTTGACCTGCAT | GATTTTAGGCTAACTTTTGAGAT |
| sRNA0379* | AGTGCTTCTTCAATTTTATCCATC | GGCAAGGATAGAATGGTTGT |
| sRNA0250* | GCCATTTAAGATTCGGACTA | AGGAAGTGAATAAGTATGAAAGT |
| sRNA0301* | CTAAAGGGCAATAAAATATGTGA | GAAGCGTTTCCTATAAATTCTAT |
| sRNA0600* | TGTATTTGTTTCGGACCTTA | CGCTATTACGCGATATTCT |
| sRNA0656 (Zhu et al., 2018) | TATGGGGGATAAGATATGCTATGAT | Universal primer |
| sRNA0330 (Zhu et al., 2018) | TTTATTAGAAAGGAACAGTTTTG | Universal primer |
| sRNA0187 (Zhu et al., 2018) | CGTTCCGTCAAATAACCAAAGTG | AAGGAGAATGGTAATTCCGCTTT |
| sRNA0329 (Zhu et al., 2018) | GCAAAACTGTTCCTTTCTAATAA | Universal primer |
| sRNA0679 (Zhu et al., 2018) | AATCTCAAGCAAAGACTTTTTAGA | Universal primer |
| 16S rRNA | CTTACCAGGTCTTGACATCCCG | ACCCAACATCTCACGACACGAG |
- * The primers were designed by the technical staff from the TakaRa company. The universal primer was commercially supplied with the Mir-X miRNA qRT-PCR SYBR kits (TaKaRa).
The most highly expressed sRNA associated with biofilm formation from the analyzed 20 sRNAs was selected for further analysis. Five target mRNAs of the candidate sRNA were selected, and their possible functional roles were preliminarily explored. The primers used in the qRT-PCR analysis of the mRNAs are listed in Table 2. Synthesis of cDNA and qRT-PCR were performed as described above. The expression level of each gene was determined in triplicate. Expression levels were calculated using the 2−ΔΔCt method (Livak & Schmittgen, 2001).
| Gene ID | Primers | |
|---|---|---|
| Forward | Reverse | |
| ComE (Hung et al., 2011) | AGCCCATAAGCTCTGCCTTT | AGCGATGGCACTGAAAAAGT |
| CcpA (Wen & Burne, 2002) | ATTGACCGTCTTGATTATC | AGCATTAGCAATATTAGGG |
| GtfB (Gao et al., 2018) | AGCAATGCAGCCAATCTACAAAT | ACGAACTTTGCCGTTATTGTCA |
| GtfC (Gao et al., 2018) | CTCAACCAACCGCCACTGTT | GGTTTAACGTCAAAATTAGCTGTATTAGC |
| GftD (Gao et al., 2018) | ACAGCAGACAGCAGCCAAGA | ACTGGGTTTGCTGCGTTTG |
2.4 Crystal violet (CV) staining assay
The CV staining assay was used to evaluate the biofilm biomass of S. mutans (Weerasekera et al., 2016). Streptococcus mutans UA159 and the 10 clinical strains were incubated in flat-bottom 96-well plates under anaerobic conditions for 4 h, 6 h, 12 h, and 24 h. Then the contents of the 96-well plates were then removed, and the plates were washed three times with phosphate-buffered saline (PBS) to remove nonadherent cells. The washed biofilms were fixed with 95% methanol for 15 min and washed again. The biofilms were stained with 0.1% (wt/vol) CV solution for 15 min at room temperature. After thorough removal of the excess liquid, the remaining CV was dissolved in 200 μl of 95% ethanol for 15 min, and 100 μl of the sample was transferred to a new plate for OD600 measurement.
2.5 Confocal laser scanning microscopy (CLSM)
For analysis of EPS production, 1 μM Alexa Fluor 647 (Invitrogen) and 2.5 μM SYTO 9 (Invitrogen) were used to label dextran and bacterial cells, respectively (Huang et al., 2017). COMSTAT was used to analyze the biomass of EPS (μm3/μm2). The three-dimensional architecture of the biofilms was reconstructed using Imaris 8.0.2 (Bitplane). Three independent experiments were performed for each condition, and images of five random fields were collected for each sample.
2.6 Bioinformatics analysis of candidate sRNAs
We predicted the structures of candidate sRNA using RNAfold (http://rna.tbi.univie.ac.at/cgi-bin/RNAWebSuite/RNAfold.cgi). According to sequence data for S. mutans UA159 (AE014133.2), functional annotation of sRNA was performed with the Kyoto Encyclopedia of Genes and Genomes analyses (KEGG) and Database for Annotation, Visualization and Integrated Discovery (DAVID) software (http://david.abcc.ncifcrf.gov/). The binding sites of sRNAs in putative target mRNAs were predicted by intaRNA (http://rna.informatik.uni-freiburg.de/IntaRNA/Input.jsp).
2.7 Statistical analyses
Each experiment was independently repeated three times. GraphPad Prism version 7.0a (GraphPad Software, San Diego, CA, USA) and IBM SPSS 24.0 (IBM, Armonk, NY, USA) were used to analyze the data. The means and standard deviations of all continuous variables were computed. The data were assessed for normal distribution and sphericity; an unpaired t test was used for two conditions, and repeated measures analysis of variance was used for multiple time points (p < 0.05). The Spearman rank correlation coefficient was applied with a p-value of <0.05 for correlation testing.
3 RESULTS
3.1 Screening for the most highly differentially expressed sRNAs associated with biofilm formation
To obtain the most relevant sRNAs associated with biofilm formation, we screened the top 20 differentially expressed sRNAs from our previous study in the standard strain of S. mutans (UA159, ATCC 700610). Among the 20 sRNAs, 18 were successfully detected with 14 were upregulated in cultures with biofilm status relative to those with planktonic status, and 4 were downregulated. Two sRNAs (sRNA0250 and sRNA0656) expressed so unstably after multiple repeated studies that the detection of these two sRNAs was not shown in Table 3. sRNA0426 was the most highly differentially expressed sRNA. Its expression was 5.87 times higher in the biofilm state than in the planktonic state (p < 0.001, Table 3).
| sRNAs | log2 Fold change (Biofilm/Planktonic) | Fold change (Biofilm/Planktonic) | t value | p-value | |
|---|---|---|---|---|---|
| sRNA0426 | 2.55 | 5.87 | 26.09 | <0.001 | |
| sRNA0379 | 2.33 | 5.01 | 54.82 | <0.001 | |
| sRNA0650 | 2.19 | 4.56 | 54.31 | <0.001 | |
| sRNA0413 | 2.13 | 4.38 | 71.42 | <0.001 | |
| sRNA0600 | 1.99 | 3.97 | 19.11 | <0.001 | |
| sRNA0522 | 1.79 | 3.46 | 55.26 | <0.001 | |
| sRNA0698 | 1.29 | 2.45 | 20.36 | <0.001 | |
| sRNA0593 | 1.27 | 2.42 | 9.86 | <0.001 | |
| sRNA0215 | 1.14 | 2.20 | 13.78 | <0.001 | |
| sRNA0120 | 0.84 | 1.79 | 7.52 | <0.001 | |
| sRNA0146 | 0.81 | 1.75 | 8.99 | <0.001 | |
| sRNA0118 | 0.69 | 1.62 | 19.42 | <0.001 | |
| sRNA0301 | 0.54 | 1.45 | 17.93 | <0.001 | |
| sRNA0074 | 0.17 | 1.13 | 2.74 | 0.021 | |
| sRNA0329 | −0.66 | 0.63 | −7.43 | <0.001 | |
| sRNA0187 | −1.18 | 0.44 | −13.44 | <0.001 | |
| sRNA0330 | −1.23 | 0.43 | −12.83 | <0.001 | |
| sRNA0679 | −1.25 | 0.42 | −15.81 | <0.001 | |
| sRNA0250 | - | - | - | - | |
| sRNA0656 | - | - | - | - | |
Note
- Expression of the 20 selected sRNAs under standard Streptococcus mutans biofilm conditions compared with planktonic conditions at 24 h. 18 sRNAs were differentially expressed between the two conditions; of these, sRNA0426 was the most significantly upregulated sRNA. The expression of sRNA0250 and sRNA0656 under these two conditions was not measured stably. The sequencing data for these sRNAs were obtained from (Zhu et al., 2018).
3.2 Expression of sRNA0426 during biofilm formation in standard and clinical strains of S. mutans
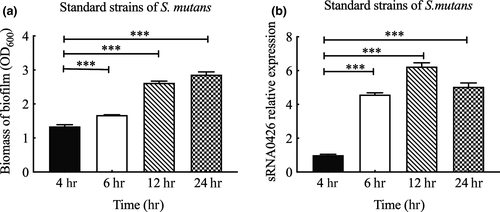
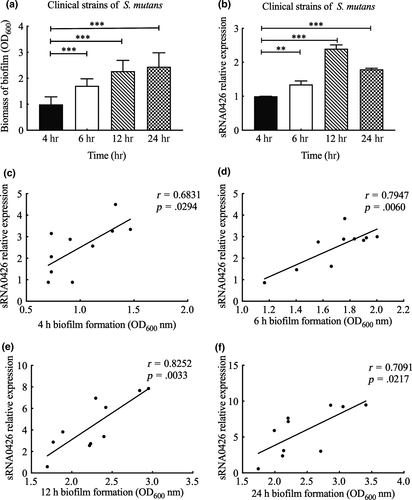
To further verify the relationship between sRNA0426 and biofilm formation, we first evaluated the biofilm biomass by CV assays and measured the expression of sRNA0426 at 4 h, 6 h, 12 h, and 24 h in the standard strain of S. mutans. The biofilm biomass increased from 4 h to 24 h during the biofilm formation process in the standard strain (p < 0.05, Figure 1a). Also, expression of sRNA0426 changed dynamically during biofilm formation in the standard strain, gradually increasing from 4 h to 12 h and then decreasing slightly at 24 h, with a peak at 12 h (p < 0.001) (Figure 1b). We observed a similar trend in the clinical strains of S. mutans (Figure 2a,b). There was a positive correlation between sRNA0426 expression and biofilm biomass in the clinical strains at various times (4 h, 6 h, 12 h, and 24 h). From 4 h to 12 h, the correlation strengthened as the biofilm formation capability of the 10 clinical strains increased, although the correlation weakened from 12 h to 24 h (Figure 2c-f). The strongest correlation between sRNA0426 expression and biofilm formation capability was observed at 12 h (r = 0.8252, p = 0.0033) (Figure 2e).
3.3 Relationship between expression of sRNA0426 and EPS
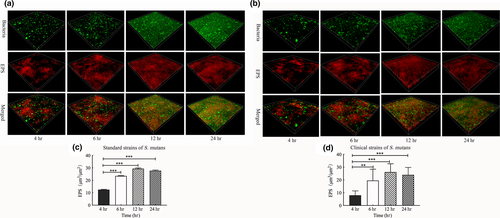
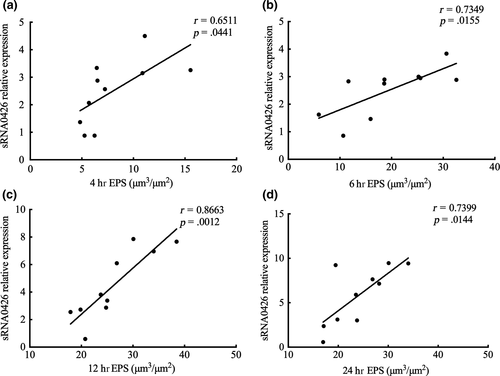
EPS forms the core of the matrix scaffold and provides binding sites that promote the accumulation of microorganisms on the tooth surface and the establishment of pathogenic biofilms (Bowen, Burne, Wu, & Koo, 2018). Thus, to further explore the association between sRNA0426 and EPS, we specifically analyzed EPS by CLSM. According to the confocal micrographs of EPS, the bacteria became increasingly encased or surrounded by EPS with time, but no change was apparent from 12 h to 24 h (Figure 3a,b). The highest biovolume of EPS was observed at 12 h in the biofilm of both the standard and clinical strains of S. mutans (p < 0.05) (Figure 3c,d), and the trend of the change in the amount of EPS was consistent with the dynamic expression of sRNA0426 during biofilm formation. We then analyzed the relationship between expression of sRNA0426 and the amount of EPS in the biofilms of the 10 clinical strains at 4 h, 6 h, 12 h, and 24 h of culture. The results obtained with the clinical strains suggest that the expression level of sRNA0426 correlates positively with the amount of EPS present during biofilm formation. The strongest correlation was observed at 12 h (r = 0.8663, p = 0.0012) (Figure 4c). These results indicate that sRNA0426 may play a positive role in the production of EPS in S. mutans biofilms.
3.4 Functional annotation of sRNA0426 using bioinformatics analyses
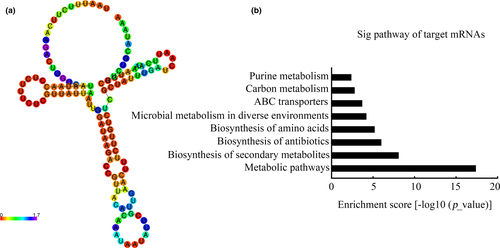
Considering the importance of secondary structures in stabilizing sRNAs, the secondary structure of sRNA0426 was predicted using RNAfold. It is reported that sRNA0426 possesses a stem-loop structure with a ΔG value of −18.7 kcal/mol (Figure 5a). To the best of our knowledge, sRNA0426 is located on the antisense mRNA strand between SMU_1238c and SMU_1239 (Table A1). To explore the potential mechanism by which sRNA0426 regulates S. mutans biofilm formation, KEGG pathway annotation was used to investigate the sRNA0426 regulatory pathway, revealing eight pathways that are significantly regulated by sRNA0426 (p < 0.05) (Figure 5b). Specifically, most of the pathways are involved in biofilm formation, such as metabolic pathways, especially carbon metabolism. The results of the KEGG analysis of biological pathways for the other sRNAs are presented in Appendix B (https://doi.org/10.6084/m9.figshare.12310133). The KEGG analysis for the other differential sRNAs expression showed a potential similar pathway with sRNA0426 and that there might be several sRNAs involved in the biofilm regulatory network in S. mutans.
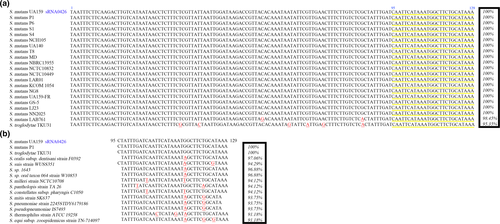
To determine whether similar putative sRNAs are present in other bacteria, we searched for sequences homologous of sRNA0426 using BLASTN. The results are shown in Figure 6. A sequence was only considered to be conserved when the coverage between the query and subject sequences was higher than 75% and the nucleotide identity was higher than 65% (E-value = 10−5, word = 11). The results suggest that sRNA0426 might be conserved in Streptococcus species, primarily in S. mutans strains and Streptococcus troglodytae (S. troglodytae). The genomes of 14 S. mutans strains were found to cover 100% of the sequence of sRNA0426. The S. mutans strain LAB761 and S. troglodytae separately cover 98.45% and 95.35% of the sequence respectively (Figure 6a). Furthermore, 14 streptococcus species including 105 strains have a 24%–27% query cover of sRNA0426. The BLASTN results of the representative 14 streptococcus species were shown in Figure 6b, and more details about the total 105 strains were presented in Appendix C (https://doi.org/10.6084/m9.figshare.12310133). We consider it specific seed sequences for the function of sRNA0426 in S. mutants.
3.5 Relationship of sRNA0426 and potential target mRNAs
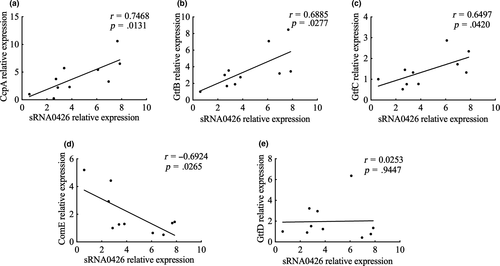
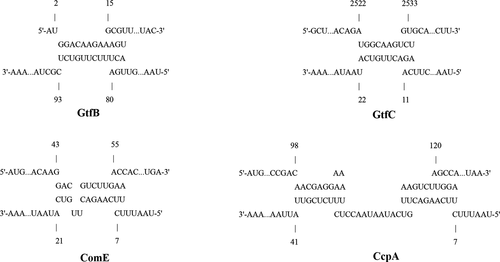
To further explore the function of sRNA0426, we examined the association between sRNA0426 and five potential target mRNAs predicted by bioinformatics (GtfB, GtfC, GtfD, ComE, and CcpA) at 12 h, when the strongest correlation was observed between sRNA0426 and biofilm biomass together with EPS. According to the results, sRNA0426 expression showed a significantly positive relationship with GtfB, GtfC, ComE, and CcpA expression (p < 0.05) but no significant relationship with GtfD expression (Figure 7). Potential binding sites were also predicted by intaRNA (Figure A1). The presence of binding sites between potential target mRNAs and sRNA0426 provides evidence for a regulatory role of sRNA0426.
4 DISCUSSION
Biofilm formation of S. mutans is a dynamic process that involves biofilm-specific genetic mechanisms and regulatory networks that allow the bacterium to adapt to a changing microenvironment (Krzysciak et al., 2014). sRNAs are reported to exert broad regulation by directly targeting a large number of mRNAs, thereby playing a crucial role in biofilm formation (Caldelari et al., 2013; Chambers & Sauer, 2013). However, identification and further analysis of biofilm-associated sRNAs in S. mutans have yet to be performed, especially in clinical strains. In this study, we detected the expression of sRNAs associated with biofilm formation and preliminarily investigated the potential function of sRNAs during biofilm formation both in standard S. mutans strain and clinical strains. Genes that are differentially expressed between biofilm and planktonic states are considered to be highly associated with biofilm formation. In Acinetobacter baumannii, Alvarez-Fraga et al. (2017) found that sRNA13573 was expressed more highly in biofilms than during planktonic states and verified that sRNA13573 was involved in biofilm formation. A previous study also showed that biofilm-associated genes exhibit different expression profiles in S. mutans under biofilm and planktonic conditions (Shemesh, Tam, & Steinberg, 2007). In our study, the expression of sRNA0426 was significantly higher in biofilms than in the planktonic state, and it changed dramatically during the biofilm formation process, showing a strong association with biofilm formation. Together with the correlation between sRNA0426 and biofilm biomass, the data suggest that sRNA0426 is associated with biofilm formation in S. mutans.
Biofilms are highly dynamic and structured communities of bacteria enmeshed in a self-produced matrix of extracellular polymeric substances (Flemming & Wingender, 2010; Flemming et al., 2016). EPS forms the core of the matrix scaffold and provides a binding site for bacterial cells, mediating their adherence to form mature biofilms (Koo, Falsetta, & Klein, 2013). As attractive and effective regulators, sRNAs have an important function in the production of EPS. Liu reported that the sRNA HmsB (sR035) promotes biofilm formation by increasing EPS production and that HmsA (sR084) activates biofilm formation by modulating the intracellular level of c-di-GMP molecules to determine EPS production in Yersinia pestis (Liu et al., 2016). Additionally, sRNAs cooperate with Hfq to regulate EPS production in Erwinia amylovora (Zeng, McNally, & Sundin, 2013). In the present study of S. mutans, sRNA0426 displayed a positive correlation with EPS. The results suggest that sRNA0426 plays an important role in S. mutans biofilm formation through the production of EPS.
Synthesis of EPS is determined by carbon metabolism, which in S. mutans is mainly controlled by glucosyltransferases (gtfs). GtfBC metabolizes sucrose to produce water-insoluble glucans, and gtfD synthesizes predominantly soluble glucans to establish the EPS matrix (Li & Burne, 2001). The activities of gtfs are controlled by regulators. For example, comE is part of two-component signal transduction systems and it is an occluded RNA polymerase that binds to the coding region of gtfC to abort its expression, thereby interfering with carbon metabolism and biofilm formation (Hung et al., 2011). Furthermore, ccpA plays a critical role in the response to carbon source availability by affecting the stability of biofilms in S. mutans, and the gtfBC genes require ccpA for optimal expression (Wen & Burne, 2002).
In general, sRNAs regulate gene expression by base-pairing with target mRNAs or by binding proteins directly (Chambers & Sauer, 2013) Associations between sRNA0426 and target mRNAs, including GtfB, GtfC, ComE, and CcpA, were examined, and the results further supported the role of sRNA0426 in the production of EPS biomass. The positive correlation between GtfB, GtfC, CcpA, and sRNA0426 expression, together with the negative correlation between ComE and sRNA0426, suggest that sRNA0426 might be positively associated with biofilm formation in the regulation of EPS. KEGG analysis of the predicted target genes of sRNA0426 suggests that sRNA0426 is involved in diverse physiological activities through 8 pathways (p < 0.05), such as metabolic pathways including carbon metabolism and microbial metabolism in diverse environments, that are associated with biofilm formation. What's more, the seed sequence is necessary but insufficient (Didiano & Hobert, 2006; Lee et al., 2016). And the most stable predicted binding sites between the biofilm-associated mRNAs and sRNA0426 are not limited in the seed sequence. Therefore, the seed sequence of sRNA0426 might serve an important role for sRNA0426, but the association between it and the function of sRNA0426 in S. mutants on biofilm formation is needed to be further verified (Fritsch, Siqueira, & Schrank, 2018). Overall, the functions of sRNAs may be more complex than once considered. The present study is a primary exploration of biofilm-associated sRNAs in S. mutans. The identification of more potential sRNAs and function analysis of additional sRNAs are required, and especially creating mutans to further analyze the role of sRNAs in S. mutans is needed. We have tried and failed to create mutant strains. The details are described in the Appendix A and shown in Figure A2. This could point to an essential function of this sRNA or more attempts to try.
In conclusion, we first explored the expression characteristics and potential functions of sRNAs in the biofilm formation process of standard S. mutans and clinical strains. We found that sRNA0426 and its target mRNAs are dynamically involved in the synthesis of EPS and biofilm-associated pathways. The results presented herein suggest the presence of a novel regulator in S. mutans under biofilm conditions, providing a better understanding of the mechanism of biofilm formation.
ACKNOWLEDGMENTS
This work was supported by grants from the National Natural Science Foundation of China (Grant No. 81570967).
CONFLICT OF INTEREST
None declared.
AUTHOR CONTRIBUTIONS
Luoping Yin: Data curation (equal); investigation (lead); methodology (equal); writing – original draft (equal); writing – review & editing (equal). Wenhui Zhu: Data curation (equal); investigation (equal); methodology (equal); writing – original draft (equal); writing – review & editing (equal). Dongru Chen: Software (supporting); writing – original draft (supporting). Yan Zhou: Investigation (supporting); methodology (supporting); writing – review & editing (equal). Huancai Lin: Conceptualization (lead); funding acquisition (equal); Writing – original draft (equal); writing – review & editing (equal).
ETHICS STATEMENT
The study protocol was approved by the Ethics Committee of the Guanghua School of Stomatology, Sun Yat-sen University (ERC-[2015]-09). The parents of all of the participants consented to the research.
Appendix A
Construction of the sRNA0426 deletion
Considering the length of sRNA0426 and the situation that there was no referable study of sRNAs deletion in Streptococcus mutans, we decided to attempt to construct the sRNA0426 deletion by markerless mutagenesis (Geng et al., 2016; McDaniel, Mackay, Quiroz, & Chilkoti, 2010). The knockout cassette for double-crossover homologous recombination was amplified from p15A (Selzer, Som, Itoh, & Tomizawa, 1983), named pTG17301. pTG17301 contains a counter selectable marker (phes) (Liu et al., 2020) and antibiotics marker that works in both Gram-negative and Gram-positive bacteria and will not lead to polar effects. Then, primers sRNA0426 LF and sRNA0426 RF were used to amplify the left and right flanks of sRNA0426 from the regions adjacent to its coding region of S. mutans UA159, generating 971-bp and 992-bp amplicons. The left flank region and the right flank region were ligated to pTG17301 by seamless ligation (Tolobio Ezmax one-step cloning Kit), creating plasmid pTC17316. And the left flank region and the right flank region were also ligated together by seamless ligation to replace the knockout cassette. The gene replacement vector was transformed into S. mutans UA159 in the presence of 1 μg/μl competence-stimulating peptide. Following the allelic exchange, S. mutans UA159 with sRNA0426 deficiency was isolated on BHI and chemically defined medium (CDM) (van de Rijn & Kessler, 1980) agar plates, with or without exogenous d-Glu (30 mM), supplemented with 100 μg/ml antibiotics and further confirmed using colony Polymerase chain reaction (PCR) and agarose gel electrophoresis (AGE).
Construction failure of the sRNA0426 deletion
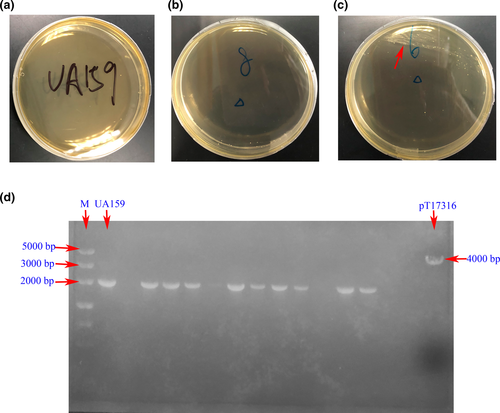
We carried many attempts to construct mutant strains, such as circular plasmid and linear plasmid transformation by chemical transformation and electrotransformation under different conditions. All the results were negative. In the control plates of S. mutans UA159, no strain was grown (Figure A2a). In the vast majority transformation plates, almost no possible deletion strain was grown (Figure A2b). And in the very few transformation plates strain, a small number of possible deletion strains were grown (Figure A2c). In confirmation of AGE, the lane of the wild type was located at 2000 bp, while the positive colony should be located at 4000 bp. Although there are some potential positive colonies in the transformation plates, the results suggested that only the bands of 2000 bp were detected, which meant the verified strains were all false positive (Figure A2d).
Discussion
We have tried and failed to construct a sRNA0426 mutant strain for S. mutans. This could point to an essential function of sRNA0426 or more attempts to improve the experimental methods and more trials. The present results might suggest a possibility of an important role of sRNA0426, and another situation is that homologous recombination is a probabilistic event where the times of repetitions were not enough under the tough condition of the length of sRNA0426 together with its stability. We might make a further try and confirmation of the role of sRNA0426 in the future.
| sRNA ID | Length | Begin | End | Strand | Pre-gene | Next-gene | Direction | Description | Sequence |
|---|---|---|---|---|---|---|---|---|---|
| >sRNA0698 | 49 | 1,975,630 | 1,975,678 | + | SMU_2102 | SMU_2104 | /−/+/+/ | IGR | TATATTCTTTACTTCTATTTCTGTTCTATTTTACCACAAAAACAACAGA |
| >sRNA0593 | 103 | 1,744,776 | 1,744,878 | + | SMU_1846c | SMU_1847 | /−/+/−/ | AM | TAACAATTTCGCCAATCATTTCATTTTCCATCAAACTTGTCCTTTCTAATAAATTCATCCAAAACTGTTTTCCTTAGGCACGGGAAACGTAGGTTCCCTCAGC |
| >sRNA0074 | 32 | 155,985 | 156,016 | − | SMU_153 | SMU_154 | /+/−/+/ | IGR | AAACGGCTACTGGAATAATGTTTAATTTTACT |
| >sRNA0522 | 132 | 1,501,217 | 1,501,348 | − | SMU_1573 | SMU_1574c | /−/−/−/ | IGR | ATTTTCCCTTCTTAAGTTTCTTTTAAGAATCCTATCTTATACTATAGTCATCCTAGCAATAGGAATCCTAAAACTTTTCTTTTTCATAAATCTCCTAAGAATCTCAGTCCATTCGGACTGGGATTTTTTTGC |
| >sRNA0426 | 129 | 1,177,303 | 1,177,431 | + | SMU_1238c | SMU_1239 | /−/+/−/ | AM | TAATTTCTTCAAGACTTGTCATAATAACCTCTTTCTCGTTATTAATTGGATAAGACCGTTACACAAATAATATTCGTTGAACTTTCTTGTCTCGCTATTTGATCAATTCATAAATGGCTTCTGCATAAA |
| >sRNA0413 | 118 | 1,140,596 | 1,140,713 | + | SMU_1197 | SMU_t37 | /+/+/−/ | AM | ATATTAACTAATAATAAGTCCGCAAAAATCGGGTATCAAAACTACTTTTTGTAAAAGCACCGCTTTCATCTTTACCTAATCCACCTTGAGGGAATCGAACCCCCATCTCAAGAACCGG |
| >sRNA0650 | 119 | 1,848,993 | 1,849,111 | + | SMU_1975c | SMU_1976c | /−/+/−/ | AM | TAATTAGCATCTTTTACATCACAATAAGTGATTGAAGAACACTCTAAGTAAAACGCCACATATGATTGTCCCATAAAGAAGAATCATCAGAGTAATCAGATAGCTGAAAGCGATATGCC |
| >sRNA0146 | 95 | 359,440 | 359,534 | + | SMU_379 | SMU_381c | /+/+/−/ | IGR | AGAGCTAGTTGCTATAATTAATAATTTACTAGAGATTGTCTAACTGAAGAGAAGTAGTGTCTAATAGATGTTCATTATTAGCGCACGGCCATTAC |
| >sRNA0215 | 147 | 556,,934 | 557,080 | − | SMU_597 | SMU_598 | /+/−/+/ | AM | AAGCTAAGCGAGTCGCTGTTTTGATACCAATACCCGGTAATTTTGTGAAGCTCTCAATAAGTTTGGCAATAGGCGTTGGGTAGAGCATTCTTTTTCCTCACTGATTCATTGGATACATCTTTTGATAAAGATTGATGATATCTCTCG |
| >sRNA0120 | 111 | 287,424 | 287,534 | + | SMU_298 | SMU_299c | /+/+/−/ | AM | TAACAATATGAACGATTATCTTAATGACTTAAGCGTAAGCGGCAAAACTTGCTGCACCTGAAGCCCAGCTATTTACTACAACGTCTGTTAAAGCTTGTGCTGGAGTTTTTG |
| >sRNA0118 | 100 | 279,927 | 280,026 | + | SMU_291 | SMU_292 | /+/+/+/ | IGR | TAATGTTAAAAGCTTTTAAAAACAGCTTCTTAGAAATATTGATTTTGACCTGCATCTCAAAAGTTAGCCTAAAATCTAACTTTTGGGGTGTTTTTCTATG |
| >sRNA0379 | 58 | 1,028,561 | 1,028,618 | + | SMU_1083c | SMU_1084 | /−/+/−/ | AM | TAAGTGCTTCTTCAATTTTATCCATCGTCAACCACAACCATTCTATCCTTGCCAAAAC |
| >sRNA0250 | 88 | 621,927 | 622,014 | − | SMU_662 | SMU_663 | /+/−/+/ | AM | TCTGATGGCCATTTAAGATTCGGACTAATTCTAATCCACTATATCCTGTAATACCGACAATCGAAACTTTCATACTTATTCACTTCCT |
| >sRNA0301 | 87 | 745,713 | 745,799 | − | SMU_799c | SMU_800 | /−/−/+/ | IGR | CTAAAGGGCAATAAAATATGTGATTCCAAAGCTTCAACAGTAACCTTTAATGGGAATATAGAATTTATAGGAAACGCTTCCAAAATT |
| >sRNA0600 | 139 | 1,757,677 | 1,757,815 | + | SMU_1862 | SMU_1865 | /+/+/+/ | IGR | TAGCTTTTCAACTTTAGCAAGAATCAGTACAACAACTCCTAGCAAAGCTGTTCGCTGTATTTGTTTCGGACCTTAGTCTCTTAGAATATCGCGTAATAGCGATTTATGCCATTTTTTACTTTAAAATCAAATAGTTGGT |
| >sRNA0656 | 113 | 1,849,900 | 1,850,012 | − | SMU_1977c | SMU_1978 | /−/−/−/ | IGR | GTAAAAGAGATTTGACATCTCTCACTAAATAGTAATTATGGGGGATAAGATATGCTATGATCATTAAAAAGATATTTAGTCAAGAATATTTCAGTACAACTTTAGTCAAATAG |
| >sRNA0330 | 25 | 827,355 | 827,379 | − | SMU_875c | SMU_876 | /−/−/−/ | IGR | TTTATTAGAAAGGAACAGTTTTGCA |
| >sRNA0187 | 118 | 460,,778 | 460,895 | − | SMU_491 | SMU_493 | /+/−/+/ | AM | TATCACGATAACTGTACATGCGTTCCGTCAAATAACCAAAGTGTTTTTGAGAATTCTTTTGAACATCATTTGTGTACTTTTGAGTTAAAAGCGGAATTACCATTCTCCTTCTCCTTTT |
| >sRNA0329 | 38 | 827,341 | 827,378 | + | SMU_875c | SMU_876 | /−/+/−/ | IGR | GTATCGCAAACGTTTGCAAAACTGTTCCTTTCTAATAA |
| >sRNA0679 | 53 | 1,922,203 | 1,922,255 | + | SMU_2046c | SMU_2047 | /−/+/−/ | AM | AATCTCAAGCAAAGACTTTTTAGATTCTAGCCTACTCCTTTTTAATCTTTTTA |
Note
- The data are extracted from Zhu et al. (2018). AM indicates that the sRNA is located on the antisense strand to mRNA; IGR indicates that the sRNA is in the intergenic region.
Appendix B
| KEGG_PATHWAY analysis for sRNA0379 | |||
|---|---|---|---|
| Term | Genes | % | p -value |
| Metabolic pathways |

|
17.3 | 0.000 |
| Biosynthesis of secondary metabolites |

|
8.2 | 0.000 |
| Biosynthesis of antibiotics |

|
6 | 0.000 |
| Biosynthesis of amino acids |

|
5.2 | 0.000 |
| Microbial metabolism in diverse environments |

|
4.2 | 0.000 |
| ABC transporters |

|
3.7 | 0.001 |
| Carbon metabolism |

|
2.8 | 0.010 |
| Purine metabolism |

|
2.4 | 0.022 |
| Pyrimidine metabolism |

|
2.1 | 0.047 |
| KEGG_PATHWAY analysis for sRNA0650 | |||
|---|---|---|---|
| Term | Genes | % | p -value |
| Metabolic pathways |

|
17.2 | 0.000 |
| Biosynthesis of secondary metabolites |

|
8.1 | 0.000 |
| Biosynthesis of antibiotics |

|
6 | 0.000 |
| Biosynthesis of amino acids |

|
5.2 | 0.000 |
| Microbial metabolism in diverse environments |

|
4.2 | 0.000 |
| ABC transporters |

|
3.7 | 0.001 |
| Carbon metabolism |

|
2.8 | 0.011 |
| Purine metabolism |

|
2.4 | 0.024 |
| Pyrimidine metabolism |

|
2 | 0.049 |
| KEGG_PATHWAY analysis for sRNA0413 | |||
|---|---|---|---|
| Term | Genes | % | p -value |
| Metabolic pathways |

|
17.2 | 0.000 |
| Biosynthesis of secondary metabolites |

|
8.1 | 0.000 |
| Biosynthesis of antibiotics |

|
6 | 0.000 |
| Biosynthesis of amino acids |

|
5.2 | 0.000 |
| Microbial metabolism in diverse environments |

|
4.2 | 0.000 |
| ABC transporters |

|
3.7 | 0.001 |
| Carbon metabolism |

|
2.8 | 0.012 |
| Purine metabolism |

|
2.4 | 0.025 |
| KEGG_PATHWAY analysis for sRNA0600 | |||
|---|---|---|---|
| Term | Genes | % | p -value |
| Metabolic pathways |

|
17.2 | 0.000 |
| Biosynthesis of secondary metabolites |

|
8.1 | 0.000 |
| Biosynthesis of antibiotics |

|
6 | 0.000 |
| Biosynthesis of amino acids |

|
5.2 | 0.000 |
| Microbial metabolism in diverse environments |

|
4.2 | 0.000 |
| ABC transporters |

|
3.7 | 0.001 |
| Carbon metabolism |

|
2.8 | 0.012 |
| Purine metabolism |

|
2.4 | 0.025 |
| KEGG_PATHWAY analysis for sRNA0522 | |||
|---|---|---|---|
| Term | Genes | % | p -value |
| Metabolic pathways |

|
17.2 | 0.000 |
| Biosynthesis of secondary metabolites |

|
8.1 | 0.000 |
| Biosynthesis of antibiotics |

|
6 | 0.000 |
| Biosynthesis of amino acids |

|
5.2 | 0.000 |
| Microbial metabolism in diverse environments |

|
4.2 | 0.000 |
| ABC transporters |

|
3.7 | 0.001 |
| Carbon metabolism |

|
2.8 | 0.011 |
| Purine metabolism |

|
2.4 | 0.024 |
| Pyrimidine metabolism |

|
2 | 0.049 |
| KEGG_PATHWAY analysis for sRNA0698 | |||
|---|---|---|---|
| Term | Genes | % | p -value |
| Metabolic pathways |

|
17.4 | 0.000 |
| Biosynthesis of secondary metabolites |

|
8.2 | 0.000 |
| Biosynthesis of antibiotics |

|
6 | 0.000 |
| Biosynthesis of amino acids |

|
5.2 | 0.000 |
| Microbial metabolism in diverse environments |

|
4.2 | 0.000 |
| ABC transporters |

|
3.8 | 0.001 |
| Carbon metabolism |

|
2.8 | 0.009 |
| Purine metabolism |

|
2.4 | 0.020 |
| Pyrimidine metabolism |

|
2.1 | 0.042 |
| KEGG_PATHWAY analysis for sRNA0593 | |||
|---|---|---|---|
| Term | Genes | % | p -value |
| Metabolic pathways |

|
17.2 | 0.000 |
| Biosynthesis of secondary metabolites |

|
8.1 | 0.000 |
| Biosynthesis of antibiotics |

|
6 | 0.000 |
| Biosynthesis of amino acids |

|
5.2 | 0.000 |
| Microbial metabolism in diverse environments |

|
4.2 | 0.000 |
| ABC transporters |

|
3.7 | 0.001 |
| Carbon metabolism |

|
2.8 | 0.012 |
| Purine metabolism |

|
2.4 | 0.025 |
| KEGG_PATHWAY analysis for sRNA0215 | |||
|---|---|---|---|
| Term | Genes | % | p -value |
| Metabolic pathways |

|
17.2 | 0.000 |
| Biosynthesis of secondary metabolites |

|
8.1 | 0.000 |
| Biosynthesis of antibiotics |

|
6 | 0.000 |
| Biosynthesis of amino acids |

|
5.2 | 0.000 |
| Microbial metabolism in diverse environments |

|
4.2 | 0.000 |
| ABC transporters |

|
3.7 | 0.001 |
| Carbon metabolism |

|
2.8 | 0.012 |
| Purine metabolism |

|
2.4 | 0.025 |
| KEGG_PATHWAY analysis for sRNA0120 | |||
|---|---|---|---|
| RT | Genes | % | p -value |
| Metabolic pathways |

|
17.2 | 0.000 |
| Biosynthesis of secondary metabolites |

|
8.1 | 0.000 |
| Biosynthesis of antibiotics |

|
6 | 0.000 |
| Biosynthesis of amino acids |

|
5.2 | 0.000 |
| Microbial metabolism in diverse environments |

|
4.2 | 0.000 |
| ABC transporters |

|
3.7 | 0.001 |
| Carbon metabolism |

|
2.8 | 0.012 |
| Purine metabolism |

|
2.4 | 0.025 |
| KEGG_PATHWAY analysis for sRNA0146 | |||
|---|---|---|---|
| Term | Genes | % | p -value |
| Metabolic pathways |

|
17.3 | 0.000 |
| Biosynthesis of secondary metabolites |

|
8.1 | 0.000 |
| Biosynthesis of antibiotics |

|
6 | 0.000 |
| Biosynthesis of amino acids |

|
5.2 | 0.000 |
| Microbial metabolism in diverse environments |

|
4.2 | 0.000 |
| ABC transporters |

|
3.7 | 0.001 |
| Carbon metabolism |

|
2.8 | 0.011 |
| Purine metabolism |

|
2.4 | 0.024 |
| Pyrimidine metabolism |

|
2 | 0.049 |
| KEGG_PATHWAY analysis for sRNA0118 | |||
|---|---|---|---|
| Term | Genes | % | p -value |
| Metabolic pathways |

|
17.2 | 0.000 |
| Biosynthesis of secondary metabolites |

|
8.1 | 0.000 |
| Biosynthesis of antibiotics |

|
6 | 0.000 |
| Biosynthesis of amino acids |

|
5.2 | 0.000 |
| Microbial metabolism in diverse environments |

|
4.2 | 0.000 |
| ABC transporters |

|
3.7 | 0.001 |
| Carbon metabolism |

|
2.8 | 0.012 |
| Purine metabolism |

|
2.4 | 0.025 |
| KEGG_PATHWAY analysis for sRNA0301 | |||
|---|---|---|---|
| Term | Genes | % | p -value |
| Metabolic pathways |

|
17.2 | 0.000 |
| Biosynthesis of secondary metabolites |

|
8.1 | 0.000 |
| Biosynthesis of antibiotics |

|
6 | 0.000 |
| Biosynthesis of amino acids |

|
5.2 | 0.000 |
| Microbial metabolism in diverse environments |

|
4.2 | 0.000 |
| ABC transporters |

|
3.7 | 0.001 |
| Carbon metabolism |

|
2.8 | 0.012 |
| Purine metabolism |

|
2.4 | 0.025 |
| KEGG_PATHWAY analysis for sRNA0074 | |||
|---|---|---|---|
| Term | Genes | % | p -value |
| Metabolic pathways |

|
17.2 | 0.000 |
| Biosynthesis of secondary metabolites |

|
8.1 | 0.000 |
| Biosynthesis of antibiotics |

|
6 | 0.000 |
| Biosynthesis of amino acids |

|
5.2 | 0.000 |
| Microbial metabolism in diverse environments |

|
4.2 | 0.000 |
| ABC transporters |

|
3.7 | 0.001 |
| Carbon metabolism |

|
2.8 | 0.012 |
| Purine metabolism |

|
2.4 | 0.025 |
| KEGG_PATHWAY analysis for sRNA0329 | |||
|---|---|---|---|
| Term | Genes | % | p -value |
| Metabolic pathways |

|
17.4 | 0.000 |
| Biosynthesis of secondary metabolites |

|
8.2 | 0.000 |
| Biosynthesis of antibiotics |

|
6 | 0.000 |
| Biosynthesis of amino acids |

|
5.2 | 0.000 |
| Microbial metabolism in diverse environments |

|
4.2 | 0.000 |
| ABC transporters |

|
3.8 | 0.001 |
| Carbon metabolism |

|
2.8 | 0.010 |
| Purine metabolism |

|
2.4 | 0.022 |
| Pyrimidine metabolism |

|
2.1 | 0.047 |
| KEGG_PATHWAY analysis for sRNA0187 | |||
|---|---|---|---|
| Term | Genes | % | p -value |
| Metabolic pathways |

|
17.2 | 0.000 |
| Biosynthesis of secondary metabolites |

|
8.1 | 0.000 |
| Biosynthesis of antibiotics |

|
6 | 0.000 |
| Biosynthesis of amino acids |

|
5.2 | 0.000 |
| Microbial metabolism in diverse environments |

|
4.2 | 0.000 |
| ABC transporters |

|
3.7 | 0.001 |
| Carbon metabolism |

|
2.8 | 0.012 |
| Purine metabolism |

|
2.4 | 0.025 |
| KEGG_PATHWAY analysis for sRNA0330 | |||
|---|---|---|---|
| Term | Genes | % | p -value |
| Metabolic pathways |

|
17.3 | 0.000 |
| Biosynthesis of secondary metabolites |

|
8.2 | 0.000 |
| Biosynthesis of antibiotics |

|
6 | 0.000 |
| Biosynthesis of amino acids |

|
5.2 | 0.000 |
| Microbial metabolism in diverse environments |

|
4.2 | 0.000 |
| ABC transporters |

|
3.7 | 0.001 |
| Carbon metabolism |

|
2.8 | 0.012 |
| Purine metabolism |

|
2.4 | 0.025 |
| KEGG_PATHWAY analysis for sRNA0679 | |||
|---|---|---|---|
| Term | Genes | % | p -value |
| Metabolic pathways |

|
17.2 | 0.000 |
| Biosynthesis of secondary metabolites |

|
8.1 | 0.000 |
| Biosynthesis of antibiotics |

|
6 | 0.000 |
| Biosynthesis of amino acids |

|
5.2 | 0.000 |
| Microbial metabolism in diverse environments |

|
4.2 | 0.000 |
| ABC transporters |

|
3.7 | 0.001 |
| Carbon metabolism |

|
2.8 | 0.010 |
| Purine metabolism |

|
2.4 | 0.022 |
| Pyrimidine metabolism |

|
2 | 0.047 |
Appendix C
Sequences producing significant alignments:
| Description | Max score | Total score | Alignment length | Query cover | Mismatch | E-value | Per.Ident | Accession |
|---|---|---|---|---|---|---|---|---|
| Streptococcus mutans strain P1 | 233 | 233 | 129 | 100% | 0 | 0.000 | 100 | CP050273.1 |
| Streptococcus mutans strain P6 | 233 | 233 | 129 | 100% | 0 | 0.000 | 100 | CP050272.1 |
| Streptococcus mutans strain S1 | 233 | 233 | 129 | 100% | 0 | 0.000 | 100 | CP050271.1 |
| Streptococcus mutans strain S4 | 233 | 233 | 129 | 100% | 0 | 0.000 | 100 | CP050270.1 |
| Streptococcus mutans strain NCH105 | 233 | 233 | 129 | 100% | 0 | 0.000 | 100 | CP044221.1 |
| Streptococcus mutans strain UA140 | 233 | 233 | 129 | 100% | 0 | 0.000 | 100 | CP044495.1 |
| Streptococcus mutans strain T8 | 233 | 233 | 129 | 100% | 0 | 0.000 | 100 | CP044492.1 |
| Streptococcus mutans strain MD | 233 | 233 | 129 | 100% | 0 | 0.000 | 100 | CP044493.1 |
| Streptococcus mutans NBRC 13955 | 233 | 233 | 129 | 100% | 0 | 0.000 | 100 | AP019720.1 |
| Streptococcus mutans strain NCTC10832 | 233 | 233 | 129 | 100% | 0 | 0.000 | 100 | LR134320.1 |
| Streptococcus mutans strain NCTC10449 | 233 | 233 | 129 | 100% | 0 | 0.000 | 100 | LS483349.1 |
| Streptococcus mutans strain LAR01 | 233 | 233 | 129 | 100% | 0 | 0.000 | 100 | CP023477.1 |
| Streptococcus mutans strain KCOM 1054 (= ChDC YM3) | 233 | 233 | 129 | 100% | 0 | 0.000 | 100 | CP021318.1 |
| Streptococcus mutans strain NG8 | 233 | 233 | 129 | 100% | 0 | 0.000 | 100 | CP013237.1 |
| Streptococcus mutans UA159-FR | 233 | 233 | 129 | 100% | 0 | 0.000 | 100 | CP007016.1 |
| Streptococcus mutans GS-5 | 233 | 233 | 129 | 100% | 0 | 0.000 | 100 | CP003686.1 |
| Streptococcus mutans LJ23 | 233 | 233 | 129 | 100% | 0 | 0.000 | 100 | AP012336.1 |
| Streptococcus mutans UA159 | 233 | 233 | 129 | 100% | 0 | 0.000 | 100 | AE014133.2 |
| Streptococcus mutans NN2025 | 233 | 233 | 129 | 100% | 0 | 0.000 | 100 | AP010655.1 |
| Streptococcus mutans strain LAB761 | 224 | 224 | 129 | 100% | 2 | 0.000 | 98.45 | CP033199.1 |
| Streptococcus troglodytae TKU31 DNA | 206 | 206 | 129 | 100% | 6 | 0.000 | 95.35 | AP014612.1 |
| Streptococcus oralis subsp. dentisani strain F0392 | 58.1 | 58.1 | 34 | 26% | 1 | 0.000 | 97.06 | CP034442.1 |
| Streptococcus oralis Uo5 | 58.1 | 58.1 | 34 | 26% | 1 | 0.000 | 97.06 | FR720602.1 |
| Streptococcus suis strain WUSS351 | 55.4 | 55.4 | 35 | 27% | 2 | 0.001 | 94.29 | CP039462.1 |
| Streptococcus sp. 1643 | 54.5 | 54.5 | 32 | 25% | 1 | 0.002 | 96.88 | CP040231.1 |
| Streptococcus sp. oral taxon 064 strain W10853 | 54.5 | 54.5 | 32 | 25% | 1 | 0.002 | 96.88 | CP016207.1 |
| Streptococcus milleri strain NCTC10708 | 53.6 | 53.6 | 34 | 26% | 2 | 0.002 | 94.12 | LR134307.1 |
| Streptococcus suis strain HA1003 | 53.6 | 53.6 | 34 | 26% | 2 | 0.002 | 94.12 | CP030125.1 |
| Streptococcus suis strain 1081 | 53.6 | 53.6 | 34 | 26% | 2 | 0.002 | 94.12 | CP017667.1 |
| Streptococcus suis strain 0061 | 53.6 | 53.6 | 34 | 26% | 2 | 0.002 | 94.12 | CP017666.1 |
| Streptococcus pantholopis strain TA 26 | 53.6 | 53.6 | 34 | 26% | 2 | 0.002 | 94.12 | CP014699.1 |
| Streptococcus constellatus subsp. pharyngis C1050 | 53.6 | 53.6 | 34 | 26% | 2 | 0.002 | 94.12 | CP003859.1 |
| Streptococcus constellatus subsp. pharyngis C818 | 53.6 | 53.6 | 34 | 26% | 2 | 0.002 | 94.12 | CP003840.1 |
| Streptococcus constellatus subsp. pharyngis C232 | 53.6 | 53.6 | 34 | 26% | 2 | 0.002 | 94.12 | CP003800.1 |
| Streptococcus suis isolate GD-0088 | 50.9 | 50.9 | 35 | 27% | 3 | 0.023 | 91.43 | LR738723.1 |
| Streptococcus suis isolate 861160 | 50.9 | 50.9 | 35 | 27% | 3 | 0.023 | 91.43 | LR738722.1 |
| Streptococcus suis isolate GD-0001 | 50.9 | 50.9 | 35 | 27% | 3 | 0.023 | 91.43 | LR738720.1 |
| Streptococcus suis strain AH681 | 50.9 | 50.9 | 35 | 27% | 3 | 0.023 | 91.43 | CP025043.1 |
| Streptococcus sp. 116-D4 | 50 | 50 | 32 | 25% | 2 | 0.023 | 93.75 | AP021887.1 |
| Streptococcus mitis strain SK637 | 50 | 50 | 32 | 25% | 2 | 0.023 | 93.75 | CP028415.1 |
| Streptococcus pneumoniae strain 2245STDY6179186 | 50 | 50 | 32 | 25% | 2 | 0.023 | 93.75 | LR216066.1 |
| Streptococcus oralis strain NCTC11427 | 50 | 50 | 32 | 25% | 2 | 0.023 | 93.75 | LR134336.1 |
| Streptococcus oralis strain FDAARGOS_367 | 50 | 50 | 32 | 25% | 2 | 0.023 | 93.75 | CP023507.1 |
| Streptococcus oralis strain S.MIT/ORALIS-351 | 50 | 50 | 32 | 25% | 2 | 0.023 | 93.75 | CP019562.1 |
| Streptococcus mitis strain SVGS_061 | 50 | 50 | 32 | 25% | 2 | 0.023 | 93.75 | CP014326.1 |
| Streptococcus sp. VT 162 | 50 | 50 | 32 | 25% | 2 | 0.023 | 93.75 | CP007628.2 |
| Streptococcus pseudopneumoniae IS7493 | 50 | 50 | 32 | 25% | 2 | 0.023 | 93.75 | CP002925.1 |
| Streptococcus pneumoniae strain PZ900701590 | 49.1 | 49.1 | 34 | 26% | 3 | 0.079 | 91.18 | CP050175.1 |
| Streptococcus thermophilus strain ATCC 19258 | 49.1 | 49.1 | 34 | 26% | 3 | 0.079 | 91.18 | CP038020.1 |
| Streptococcus equi subsp. zooepidemicus strain TN-714097 | 49.1 | 49.1 | 34 | 26% | 3 | 0.079 | 91.18 | CP046042.2 |
| Streptococcus equi subsp. zooepidemicus strain OH-71905 | 49.1 | 49.1 | 34 | 26% | 3 | 0.079 | 91.18 | CP046040.1 |
| Streptococcus pneumoniae strain R6CIB17 | 49.1 | 49.1 | 34 | 26% | 3 | 0.079 | 91.18 | CP038808.1 |
| Streptococcus pneumoniae strain 4559 | 49.1 | 49.1 | 34 | 26% | 3 | 0.079 | 91.18 | LR595848.1 |
| Streptococcus equi subsp. zooepidemicus strain NCTC11854 | 49.1 | 49.1 | 34 | 26% | 3 | 0.079 | 91.18 | LR590471.1 |
| Streptococcus pneumoniae isolate GPS_ZA_821-sc-1950967 | 49.1 | 49.1 | 34 | 26% | 3 | 0.079 | 91.18 | LR536845.1 |
| Streptococcus pneumoniae strain 2245STDY6178854 | 49.1 | 49.1 | 34 | 26% | 3 | 0.079 | 91.18 | LR536841.1 |
| Streptococcus pneumoniae strain 2245STDY6105855 | 49.1 | 49.1 | 34 | 26% | 3 | 0.079 | 91.18 | LR536839.1 |
| Streptococcus pneumoniae strain 2245STDY6106635 | 49.1 | 49.1 | 34 | 26% | 3 | 0.079 | 91.18 | LR536837.1 |
| Streptococcus pneumoniae strain 2245STDY6020240 | 49.1 | 49.1 | 34 | 26% | 3 | 0.079 | 91.18 | LR536835.1 |
| Streptococcus pneumoniae strain 2245STDY5775553 | 49.1 | 49.1 | 34 | 26% | 3 | 0.079 | 91.18 | LR536833.1 |
| Streptococcus pneumoniae strain 2245STDY5699475 | 49.1 | 49.1 | 34 | 26% | 3 | 0.079 | 91.18 | LR536831.1 |
| Streptococcus pneumoniae strain 521 | 49.1 | 49.1 | 34 | 26% | 3 | 0.079 | 91.18 | CP036529.1 |
| Streptococcus pneumoniae strain EF3030 | 49.1 | 49.1 | 34 | 26% | 3 | 0.079 | 91.18 | CP035897.1 |
| Streptococcus pneumoniae strain 2245STDY6178828 | 49.1 | 49.1 | 34 | 26% | 3 | 0.079 | 91.18 | LR216069.1 |
| Streptococcus pneumoniae isolate b04a6400-1f66-11e7-b93e-3c4a9275d6c8 | 49.1 | 49.1 | 34 | 26% | 3 | 0.079 | 91.18 | LR536843.1 |
| Streptococcus pneumoniae isolate 55896440-41bd-11e5-998e-3c4a9275d6c6 | 49.1 | 49.1 | 34 | 26% | 3 | 0.079 | 91.18 | LR216065.1 |
| Streptococcus pneumoniae isolate 569492b0-41bd-11e5-998e-3c4a9275d6c6 | 49.1 | 49.1 | 34 | 26% | 3 | 0.079 | 91.18 | LR216064.1 |
| Streptococcus pneumoniae strain 2245STDY6105839 | 49.1 | 49.1 | 34 | 26% | 3 | 0.079 | 91.18 | LR216063.1 |
| Streptococcus pneumoniae isolate GPS_HK_150-sc-2296816 | 49.1 | 49.1 | 34 | 26% | 3 | 0.079 | 91.18 | LR216062.1 |
| Streptococcus pneumoniae strain 2245STDY6178826 | 49.1 | 49.1 | 34 | 26% | 3 | 0.079 | 91.18 | LR216061.1 |
| Streptococcus pneumoniae strain 2245STDY6178787 | 49.1 | 49.1 | 34 | 26% | 3 | 0.079 | 91.18 | LR216060.1 |
| Streptococcus pneumoniae strain 2245STDY6106384 | 49.1 | 49.1 | 34 | 26% | 3 | 0.079 | 91.18 | LR216057.1 |
| Streptococcus pneumoniae strain 2245STDY6092949 | 49.1 | 49.1 | 34 | 26% | 3 | 0.079 | 91.18 | LR216055.1 |
| Streptococcus pneumoniae strain 2245STDY6106372 | 49.1 | 49.1 | 34 | 26% | 3 | 0.079 | 91.18 | LR216054.1 |
| Streptococcus pneumoniae strain 2245STDY6106337 | 49.1 | 49.1 | 34 | 26% | 3 | 0.079 | 91.18 | LR216051.1 |
| Streptococcus pneumoniae strain 2245STDY6092834 | 49.1 | 49.1 | 34 | 26% | 3 | 0.079 | 91.18 | LR216048.1 |
| Streptococcus pneumoniae strain 2245STDY6031034 | 49.1 | 49.1 | 34 | 26% | 3 | 0.079 | 91.18 | LR216047.1 |
| Streptococcus pneumoniae strain 2245STDY6092613 | 49.1 | 49.1 | 34 | 26% | 3 | 0.079 | 91.18 | LR216046.1 |
| Streptococcus pneumoniae strain 2245STDY6020221 | 49.1 | 49.1 | 34 | 26% | 3 | 0.079 | 91.18 | LR216045.1 |
| Streptococcus pneumoniae strain 2245STDY6020210 | 49.1 | 49.1 | 34 | 26% | 3 | 0.079 | 91.18 | LR216043.1 |
| Streptococcus pneumoniae strain 2245STDY6092581 | 49.1 | 49.1 | 34 | 26% | 3 | 0.079 | 91.18 | LR216042.1 |
| Streptococcus pneumoniae strain 2245STDY6031048 | 49.1 | 49.1 | 34 | 26% | 3 | 0.079 | 91.18 | LR216041.1 |
| Streptococcus pneumoniae strain 2245STDY6030848 | 49.1 | 49.1 | 34 | 26% | 3 | 0.079 | 91.18 | LR216040.1 |
| Streptococcus pneumoniae strain 2245STDY5775610 | 49.1 | 49.1 | 34 | 26% | 3 | 0.079 | 91.18 | LR216039.1 |
| Streptococcus pneumoniae strain 2245STDY5775666 | 49.1 | 49.1 | 34 | 26% | 3 | 0.079 | 91.18 | LR216037.1 |
| Streptococcus pneumoniae strain 2245STDY5775603 | 49.1 | 49.1 | 34 | 26% | 3 | 0.079 | 91.18 | LR216036.1 |
| Streptococcus pneumoniae isolate SA_GPS_SP505-sc-1895675 | 49.1 | 49.1 | 34 | 26% | 3 | 0.079 | 91.18 | LR216035.1 |
| Streptococcus pneumoniae strain 2245STDY5983173 | 49.1 | 49.1 | 34 | 26% | 3 | 0.079 | 91.18 | LR216034.1 |
| Streptococcus pneumoniae strain 2245STDY5868782 | 49.1 | 49.1 | 34 | 26% | 3 | 0.079 | 91.18 | LR216033.1 |
| Streptococcus pneumoniae strain 2245STDY5775874 | 49.1 | 49.1 | 34 | 26% | 3 | 0.079 | 91.18 | LR216032.1 |
| Streptococcus pneumoniae strain 2245STDY5982722 | 49.1 | 49.1 | 34 | 26% | 3 | 0.079 | 91.18 | LR216031.1 |
| Streptococcus pneumoniae strain 2245STDY5775545 | 49.1 | 49.1 | 34 | 26% | 3 | 0.079 | 91.18 | LR216030.1 |
| Streptococcus pneumoniae strain 2245STDY6093044 | 49.1 | 49.1 | 34 | 26% | 3 | 0.079 | 91.18 | LR216049.1 |
| Streptococcus pneumoniae strain 2245STDY5562412 | 49.1 | 49.1 | 34 | 26% | 3 | 0.079 | 91.18 | LR216028.1 |
| Streptococcus pneumoniae strain 2245STDY5775520 | 49.1 | 49.1 | 34 | 26% | 3 | 0.079 | 91.18 | LR216027.1 |
| Streptococcus pneumoniae strain 2245STDY5775485 | 49.1 | 49.1 | 34 | 26% | 3 | 0.079 | 91.18 | LR216026.1 |
| Streptococcus pneumoniae strain 2245STDY5562562 | 49.1 | 49.1 | 34 | 26% | 3 | 0.079 | 91.18 | LR216025.1 |
| Streptococcus pneumoniae strain 2245STDY5699394 | 49.1 | 49.1 | 34 | 26% | 3 | 0.079 | 91.18 | LR216024.1 |
| Streptococcus pneumoniae strain 2245STDY5699131 | 49.1 | 49.1 | 34 | 26% | 3 | 0.079 | 91.18 | LR216022.1 |
| Streptococcus pneumoniae strain 2245STDY5562600 | 49.1 | 49.1 | 34 | 26% | 3 | 0.079 | 91.18 | LR216021.1 |
| Streptococcus pneumoniae strain 2245STDY5562351 | 49.1 | 49.1 | 34 | 26% | 3 | 0.079 | 91.18 | LR216020.1 |
| Streptococcus pneumoniae strain 2245STDY5609237 | 49.1 | 49.1 | 34 | 26% | 3 | 0.079 | 91.18 | LR216019.1 |
| Streptococcus pneumoniae strain 2245STDY5605682 | 49.1 | 49.1 | 34 | 26% | 3 | 0.079 | 91.18 | LR216018.1 |
| Streptococcus pneumoniae strain 2245STDY5605669 | 49.1 | 49.1 | 34 | 26% | 3 | 0.079 | 91.18 | LR216017.1 |
| Streptococcus pneumoniae strain 2245STDY5605535 | 49.1 | 49.1 | 34 | 26% | 3 | 0.079 | 91.18 | LR216016.1 |
Open Research
DATA AVAILABILITY STATEMENT
All data generated or analyzed during this study are included in this published article except the data in Appendix B (The KEGG analysis of biological pathways of the other 17 sRNAs) and Appendix C (More details about the BLASTN of 103 strains for seeking seed sequence), which are available in the figshare repository at https://doi.org/10.6084/m9.figshare.12310133.


