Characterization and comparison of the bacterial microbiota in different gastrointestinal tract compartments of Mongolian horses
Graphical Abstract
The microbial communities of the different parts of the Mongolian horse gastrointestinal tracts were significantly different, and there was greater diversity between the lower gut and upper gut. Direct sampling of the different segments of gastrointestinal tracts provided a more complete diagram of the gut microbiota than fecal analysis. The vegetarian diets and adaptability of Mongolian horses were likely related not only to their stable and complicated gastrointestinal microbiota but also to their special herbivorous digestive physiology.

Abstract
The intestinal microbiota plays an important role in the health and metabolism of the host. Next-generation sequencing technology has enabled the characterization of the gut microbiota of several animal species. We analyzed the intestinal microbiota in six different parts of the gastrointestinal tracts (GITs) of five Mongolian horses by sequencing the 16S rRNA gene V3-V4 hypervariable region. All horses were kept in the natural habitat of the Inner Mongolia grassland. Significant differences were observed among the microbiota compositions of the distinct GIT regions. In addition, while the microbial community structures of the small and large intestine were significantly different, those of the cecum and colon were similar. In the foregut, Firmicutes (65%) and Proteobacteria (23%) were the most abundant, while Firmicutes (45%) and Bacteroidetes (42%) were the most common in the hindgut. At the level of family, Ruminococcaceae (p = .203), Lachnospiraceae (p = .157), Rikenellaceae (p = .122), and Prevotellaceae (p = .068) were predominant in the hindgut, while the relative abundance of the Akkermansia genus (5.7%, p = .039) was higher in the ventral colon. In terms of the putative functions, the ratio of microbial abundance in the different parts of the GIT was similar, the result can help characterize the gut microbial structure of different animals.
1 INTRODUCTION
The horse is a herbivorous nonruminant animal with highly compartmentalized gastrointestinal tract (GIT), which can utilize a variety of plant fibers (Harris et al., 2017; Santos, Rodrigues, Bessa, Ferreira, & Martin-Rosset, 2011). Each segment of the GIT has an independent ecosystem with unique biotic and abiotic (temperature, water, pH, oxygen, etc.) characteristics. The composition (diversity and structure) and function (metabolic mechanism and end products) of the GIT microbiome are highly significant to animal health and metabolism. In normal circumstances, the gut microbes and host are in the symbiotic and highly dynamic relationship. In horses, for example, 60%–70% energy comes from volatile fatty acids (VFAs) (Argenzio, 1975; Vermorel & MartinRosset, 1997) produced by the cecum and colon microorganisms, 30% of which is produced by the cecum microbiota alone (Glinsky, Smith, Spires, & Davis, 1976). Therefore, the balance and stability of the intestinal microbiota are essential for the health and function of GIT. Several diseases of the GIT are related to change in the composition or function of its microbiota. In addition, metabolic diseases, such as laminitis that can affect the musculoskeletal system, are also related to the intestinal microbiota (Milinovich et al., 2007; Steelman, Chowdhary, Dowd, Suchodolski, & Janecka, 2012).
The Mongolian horse is one of the most ancient grassland horse bred in the world and found in Inner Mongolia, China. At present, studies of the intestinal microorganisms of Mongolian horses have been limited in feces (Zhao et al., 2016). Horse feces can only represent the microbial changes in the distal regions of the posterior intestine (Costa, Silva, et al., 2015; Dougal et al., 2012) rather than the whole gastrointestinal microflora, and this had been demonstrated by studies of human intestinal microflora (Durban et al., 2011; Eckburg et al., 2005). In this study, we analyzed the characterization of the microbial composition of different parts of the Mongolian horse GIT by using the next-generation sequencing (NGS) firstly.
2 MATERIALS AND METHODS
2.1 Horses and sample collection
Five healthy Mongolian horses (three males and two females with an average age of 4.4 years ranged from 3 to 6 years and weight of 292.8 ± 11.9 Kg) grazed in the Xilin Gol League prairie in Inner Mongolia Autonomous Region, and horses were euthanized in October and November 2017. All horses came from the same pasture fence, maintained in same grazing condition, and were fed by same pasture. The dry matter intake (DMI) horse is 16.51 kg day−1 per Mongolian (Table A1) (Wei et al., 2015). The animals were examined by a veterinarian to confirm there were no obvious metabolic and gastrointestinal disorders. After euthanasia and dissection, all organs of the gastrointestinal tract were collected by tying up the narrow interface between each segment with ropes, the middle of each segment was collected when the organs were placed horizontally. To ensure the consistency, samples were collected at the same position of each segment. The sampling was as follows: stomach (the pylorus), jejunum (the site 10 cm after the duodenojejunal junction), ileum (the site 10 cm before the ileum–cecum orifice), cecum (the tip of the cecum), ventral colon (the middle of the ventral colon), and dorsal colon (the middle of the dorsal colon; Liu et al., 2019). The contents were stored in a 50-ml sterile and enzyme-free centrifuge tube, mixed, and immediately placed in liquid nitrogen, and then cryopreserved at −80°C. The animal experiments were approved by the Animal Welfare Committee of Inner Mongolia Agricultural University, and all procedures were conducted in accordance with the guidelines of the China Animal Protection Association. The characteristics of the individual horses, including age, sex, weight, height, length, bust, hair, and color, are summarized in Table 1.
| Sample | Age | Sex | Weight (kg) | High (cm) | Length (cm) | Bust (cm) | Color | Condition | Reason for euthanasia | Feeding |
|---|---|---|---|---|---|---|---|---|---|---|
| Horse 1 | 3 | F | 275 | 126 | 133 | 145 | Black | WNL | Neurological | Grass |
| Horse 2 | 3 | M | 296 | 135 | 140 | 153 | Black | WNL | Old wound | Grass |
| Horse 3 | 5 | M | 298 | 132 | 140 | 156 | Bay | WNL | Navicular disease | Grass |
| Horse 4 | 5 | F | 285 | 130 | 138 | 153 | Gray | WNL | Osteoarthritis | Grass |
| Horse 5 | 6 | M | 310 | 137 | 142 | 156 | Chestnut | WNL | Old wound | Grass |
- Abbreviation: GIT, gastrointestinal tract; WNL, within normal limits.
2.2 DNA extraction, 16S rRNA gene PCR, and sequencing
Total genomic DNA was extracted from the GIT samples using the CTAB/SDS method, and the concentration and purity were evaluated by electrophoresing in 1% agarose gels. The distinct regions of the 16S rRNA (V3-V4 hypervariable regions) were amplified using barcode-tagged specific primers (16SRNA V3-V4: 341F-806R). Each PCR mixture consisted of 15 μl Phusion® High-Fidelity PCR Master Mix (New England Biolabs), 0.2 μM forward and reverse primers, and ~10 ng template DNA (1 ng/µl) for a final volume of 30 µl. The PCR mixture was denatured at 98°C for 1 min firstly, then followed by 30 cycles of denaturation at 98°C for 10 s, annealing at 50°C for 30 s, and elongation at 72°C for 30 s, and the final elongation was performed at 72°C for 5 min. The PCR products were electrophoresed on a 2% agarose gel and purified by Gene JETTM Gel Extraction Kit (Thermo Scientific).
2.3 Library preparation and sequencing
Library construction and sequencing were performed by the Novogene Company. Sequencing libraries were generated using Ion Plus Fragment Library Kit (48 reactions, Thermo Scientific) according to the manufacturer's instructions. The library quality was assessed on the Qubit® 2.0 Fluorometer (Thermo Scientific) and sequenced on an Ion S5 TM XL platform. 400-bp/600-bp single-end reads were generated by sequencing finally.
2.4 Data analysis
Single-end reads were assigned to samples based on their unique barcode and truncated by excising the barcode and primer sequences. The raw reads were first filtered according to the Cutadapt (V1.9.1, http://cutadapt.readthedocs.io/en/stable/) quality control process to obtain high-quality reads. The latter were compared with the reference database using the UCHIME algorithm (http://www.drive5.com/usearch/manual/uchime/algo.html) (Edgar, Haas, Clemente, Quince, & Knight, 2011) to detect chimaera sequences, which were then removed (Haas et al., 2011). Then, the clean reads were obtained (Table A2). Sequence analyses were performed with Uparse software (v7.0.1001, http://drive5.com/uparse/) (Edgar, 2013), and sequences with ≥97% similarity were assigned to the same operational taxonomic units (OTUs). Representative sequences of each OTU were subjected to species annotation (threshold set at 0.8 to 1) and abundance analysis using the Mothur software and SSU rRNA SILVA128 (http://www.arb-silva.de/) (Accessed Date: November 2017) database (Wang, Garrity, Tiedje, & Cole, 2007) (Quast et al., 2013). With the minimum amount of data in the sample as the standard, the data of each sample were homogenized for subsequent alpha and beta diversity analyses.
To calculate alpha diversity, the OTU table was rarefied and two metrics were calculated, observed species and Shannon index, the observed species is to estimate the amount of unique OTUs found in each sample. Rarefaction curves were generated based on these two metrics. For beta diversity analysis, UniFrac distance was calculated, and unweighted pair group method with arithmetic (UPGMA) mean sample clustering trees were constructed using QIIME software (version 1.9.1). The unweighted UniFrac was used for principal coordinate analysis (PCoA). PCoA can be used for determining principal coordinates and visualizing complex, multidimensional data. Differences in community structure among groups were tested by analysis of molecular variance (AMOVA), and species differences among groups were analyzed with LDA effect size (LEfSe, LDA score of 4). The functional composition of the microorganisms was predicted by the PICRUSt (version 1.1.2) programs. Default parameters were used for all analyses except those specific parameters.
All data analyses were performed using SPSS software, version 22.0. The different parameters of horse GIT were expressed as mean ± standard deviation. Statistical significance was analyzed with ANOVA, and multiple groups were compared using the LSD test.
3 RESULTS
3.1 Species richness and diversity across the GIT segments
A total of 2,295,386 valid sequences were obtained, 1,355,813 of which were annotated corresponding to 24,602 OTUs. At the OTU level, all samples of different segments were sequenced approximately to the plateau (Figure 1a), which reflected the richness of species indirectly. The richness was decreased in the following order: dorsal colon (DC) > ventral colon (VC) > cecum (C) > jejunum (J) ≥ ileum (I) > stomach (S). Based on the microbial diversity, the GI segments were stratified in the lower gut (LG) (cecum, ventral colon, dorsal colon) and the upper gut (UG) (stomach, jejunum, ileum), with greater richness seen in the LG (Figure A1-A). OTU cluster analysis indicated that a total of 293 OTUs were in different GIT segments, which could be divided into 10 phyla in the GIT (Figure 1b) and 16 phyla in the LG (Figure A1-B), the result indicated that there was a greater richness in the LG. The Venn diagram of the LG indicated that the proportion of specific OTUs in the cecum, ventral colon, and dorsal colon were 11.69%, 11.79%, and 24.95%, respectively. The proportion of common OTUs was 31.98%. The alpha diversity index analysis showed significantly higher microbial diversity in the individual LG segments than different UG segments (p < .001; Figure 1c,d), whereas no significant differences were observed among the individual segments of the LG or those of the UG.

3.2 Microbial abundance and composition in horse GIT
The OTU sequences of the entire horse GIT were classified into 26 phyla, and the phyla with greatest abundances were the Firmicutes (55.01%), Bacteroidetes (24.76%), and Proteobacteria (12.43%) (Figure A2). However, there were significant differences in the abundances of Firmicutes, Spirochetes (p < .05), Bacteroidetes, Verrucomicrobia, Fibrobacteres (p < .01), Proteobacteria, and Tenericutes (p < .001) between the UG and LG (Figure 2a; Table A3). While the thick-walled Firmicutes was the most abundant phylum in the UG, the relative abundance of Firmicutes and Bacteroides was similar in the LG (Table A4). The results of analysis by individual segments showed Firmicutes were significantly more abundant in the mid-ileum than stomach (p = .039), cecum (p < .001), ventral colon (p = .015), and dorsal colon (p = .005). Firmicutes were also more abundant in the jejunum than cecum (p = .004) and DC (p = .022). Bacteroidetes was more abundant in the cecum than the stomach (p < .001), jejunum (p < .001), ileum (p < .001), and ventral colon (p = .02), and also in the dorsal colon than the stomach, jejunum, and ileum (p < .001 for all). Proteobacteria was more abundant in the jejunum, stomach, and ileum than the cecum, ventral colon, and dorsal colon (p < .001, p = .001, and p < .001, respectively). The abundance of Verrucomicrobia was greater in the ventral colon than the stomach (p = .03), jejunum (p = .031), and ileum (p = .031), and that of Fusobacteria was greater in the stomach than the jejunum (p = .009), ileum (p = .007), cecum (p = .001), ventral colon (p = .001), and dorsal colon (p < .001). Actinobacteria was more abundant in the jejunum than the stomach (p = .03), cecum (p = .012), ventral colon (p = .012), and dorsal colon (p = .011). Spirochetes was more abundant in the dorsal colon than the stomach, jejunum, ileum, cecum (p < .001 for all), and ventral colon (p = .002), whereas Tenericutes was more abundant in the cecum and ventral colon than the stomach, jejunum, and ileum (p < .001 for all).

At the genus level, significant differences were also seen between the microbial compositions of the small and large intestines, whereas those of the cecum and colon were more consistent (Figure 2c). The abundance of all genus did not exceed 35% in the UG, and only slight differences were seen between the abundance of different genera in the LG. However, the relative abundance of microorganisms across the different GIT segments was significantly different (Table A5). The results of AMOVA showed that the microbial community structures were significantly different across the distinct GIT regions (p < .05; F = 12.26), while those of the jejunum, ileum, cecum, and VC were similar (Table 2). To assess the structural differences between samples better, all OTUs were subjected to PCoA based on the weighted UniFrac distance (Figure 3). The samples were formed into two distinct clusters, representing UG and LG, along with the main component 1 (PC1, contribution value of 60.23%) (Figure 3). The UG samples were more dispersed, indicating that there was a greater difference in microbial communities across the segments. In contrast, the LG samples were clustered relatively, indicating higher compositional similarity. The UPGMA clustering tree also showed distinct microbial microbiota in the different parts of the GIT, with those of the UG and LG forming two branches (Figure 2). The linear discriminant analysis (LDA) effect size (LEfSe) values were used to determine the taxonomic biomarkers between GIT segments (Costa et al., 2012), the result revealed 28 microorganisms with different biological relevance across the segments (Figure 4) and 83 microorganisms with LDA values greater than 4 (Figure A3). To summarize, the abundance of Fusobacteria, Proteobacteria and Actinobacteria, Firmicutes, Bacteroidetes, Verrucomicrobia, and Spirochetes was the highest in the stomach, jejunum, ileum, cecum, ventral colon, and dorsal colon, respectively.
| AMOVA | ||||||
|---|---|---|---|---|---|---|
| S | J | I | C | VC | DC | |
| S | 0.02 | 0.015 | 0.009 | 0.008 | 0.005 | |
| J | 2.9876 | 0.929 | 0.008 | 0.006 | 0.005 | |
| I | 3.2498 | 0.3294 | 0.006 | 0.007 | 0.011 | |
| C | 13.0352 | 20.1294 | 24.04 | 0.190 | 0.005 | |
| VC | 11.7801 | 17.2003 | 20.386 | 1.5424 | 0.018 | |
| DC | 16.5085 | 25.821 | 33.8992 | 5.3081 | 2.7487 | |
Note
- Bonferroni-corrected p-values of pairwise comparisons are shown in the upper right, with significant differences depicted in bold; F-values are shown in the lower left.
- Abbreviations: C, cecum, DC, dorsal colon, I, ileum, J, jejunum, S, stomach, and VC, ventral colon.


3.3 Putative functions of the GIT microbiota
PICRUSt and the KEGG (Kyoto Encyclopedia of Genes and Genomes) database were used to predict the metabolic functions of the GIT microbiota (Figure 5a). The following seven pathways were identified in the primary layer: metabolism (45.32%–47.92%), genetic information processing (19.35%–20.86%), environmental information processing (13.32%–16.29%), unclassified (13.68%–14.41%), cellular processes (1.95%–3.61%), human diseases (0.69%–0.84%), and organic systems (organismal systems, 0.46%–0.77%).

The top 35 predicted functions were screened based on the functional annotation and abundance in the third-order layer (Figure 5b), and a three-level functional abundance cluster heat map was drawn. The intensity of the red color indicated abundance. The functional abundance was different across the six segments of the intestine, along with the microbial functions in each part. Eleven functions (including glycolysis/gluconeogenesis) were in the stomach, three functions (including amino sugar and nucleotide sugar metabolism) were in the jejunum, three (including phosphatase and phosphotransferase system) were in the ileum, four (including starch and sucrose metabolism) were in the cecum, bacterial motility proteins were in the ventral colon, and 12 functions of methane metabolism in the dorsal colon were more abundant than in the other segments.
4 DISCUSSION
Compared with traditional isolation methods, the next-generation sequencing appears more efficient to analyzing microbiome structures, especially for the species that are hard to cultivate in vitro (Zhang et al., 2016). Therefore, this technique had been used extensively to characterize the intestinal microbiota of several species (Kim, Gu, Lee, Joh, & Kim, 2012; Orpin, 1981; Wu et al., 2016; Yang et al., 2017; Zhang et al., 2016; Zhou et al., 2016). Present studies on the gut microbiota were focused on fecal samples, which only represent the microbial structures of the right dorsal colon but not the entire gut microbiota. Therefore, direct sampling of the different parts of the GIT can reflect the function of the coevolving bacterial communities in complex mammalian ecosystems (Isaacson & Kim, 2012; Willing et al., 2009) more accurately. At the same time, the study shows that the fecal microbial diversity of wild horses is higher than that of captive horses (Metcalf et al., 2017). Therefore, this paper adopts grazing to simulate the natural state as much as possible.
4.1 Composition of the GIT microbiota of the Mongolian horse
The composition of the intestinal microbiota is the result of long-term evolutionary adaptation of the host to its diet; therefore, there are great differences among herbivores, carnivores, and omnivores. Herbivores have a higher proportion of Firmicutes and Bacteroides, reflecting the high cellulose content from ingested plants (Isaacson & Kim, 2012). In the gut of Mongolian horse, Firmicutes and Bacteroidetes also play the dominant role in the microbiota, accounting for more than 79% of the gut microbes. Studies have shown that these phyla facilitated the digestion and utilization of plant-derived foods (De Filippo et al., 2010; Xu et al., 2015).
The proportion of Firmicutes and Proteobacteria was the highest in microbiota in the foregut of the Mongolian horses. Proteobacteria maintains the stability of the intestinal microbiota structure and is a key indicator of mammal gut health (Shin, Whon, & Bae, 2015). The Proteobacteria Actinobacillus of the family Pasteurellaceae was also abundant in the UG and forms part of the normal microbiota of the anterior intestine of ruminants. However, Actinobacillus is a conditional pathogen that can cause diarrhea, meningitis, pneumonia, pyogenic nephritis or septic polyarthritis (snoring or joint disease), and sepsis, indicating that its balance is critical to the health of the animal (Layman, Rezabek, Ramachandran, Love, & Confer, 2014). In the hind or lower gut, Firmicutes and Bacteroidetes were predominant, which demonstrated that the LG is the main region for fermentation of plant fiber.
4.2 Diversity of the GIT microbiota in Mongolian horses
As mentioned above, Firmicutes and Bacteroidetes were the dominant bacteria at a ratio of 1:1 in the LG of the horses, the result contradicted the observations using fecal samples (Costa et al., 2012; Costa, Stampfli, et al., 2015; Schoster, Mosing, Jalali, Staempfli, & Weese, 2016; Zhao et al., 2016). However, this result is consistent with studies on microbial communities in different parts of the intestine (Costa, Silva, et al., 2015; Ericsson, Johnson, Lopes, Perry, & Lanter, 2016). Therefore, the feces do not fully represent the entire gut microbiota. In addition, previous studies indicated that the proportion of dominant intestinal microbiota is dependent on the geographical location or seasonal feed (Ericsson et al., 2016), but the availability in Mongolian horses needs further investigation. We observed distinct microbial communities in the different parts of the GIT, but the compositions of adjacent parts were usually similar (except for the ileum and cecum). The greater microbial diversity in the distal gut indicated a more complex microenvironment in that region. This is in agreement with studies that the ecology of the GIT is not static but with significant regional changes (Weese et al., 2015). Based on the gut microbiota, the equine GIT could be divided into two distinct regions: the hindgut region consisting of the cecum, ventral colon, and dorsal colon, and the foregut comprising of the stomach, jejunum, and ileum. While the different parts of the hindgut had similar microbiota, those of the foregut microbes were highly variable among the specific parts, as well as in different horses. As shown in the PCoA plot, individual horses differed most in the stomach or gastric microbiota. This may reflect the higher rate of throughput in the upper GIT, as well as the continuous introduction of environmental bacteria into the pasture.
The stomach mainly harbored the Firmicutes, Proteobacteria, and Bacteroidetes phyla and the Actinobacillus, Lactobacillus, Streptococcus, and Veillonella genera, which contradicted the results of Perkins et al. (2012). In addition, the Fusobacteria, Leptotrichia, and Alloprevotella genera were significantly more abundant than the other parts of the intestine. Fusobacteria produces VFAs, such as acetic acid, propionic acid, and butyric acid, which are essential for the absorption of electrolytes and the regeneration of mucosal epithelial cells, which are instrumental in preventing inflammation and cancer (Perkins et al., 2012). The jejunum and ileum had similar microbiota composition, possibly due to the proximity or the small sample size. Consistent with the studies by Dougal and Hayashi (Dougal et al., 2012; Hayashi, Takahashi, Nishi, Sakamoto, & Benno, 2005), Proteobacteria and Actinobacteria were the most abundant phyla in the jejunum and predominantly included Actinobacillus. Firmicutes was the most abundant phylum (72%) in the mid-ileum and mainly included the Clostridiaceae (Cymbidaceae) family, the Clostridium_sensu_stricto_1 (C. sinensis) and the Turicibacter genera, all of which were significantly different in the stomach, cecum, VC, and DC. This was inconsistent with the findings of Dougal et al. (2013). The horse ileum also harbored Proteobacteria (22%) and lower Bacteroides (2%), similar to the human ileum (Booijink et al., 2010; Durban et al., 2011). Therefore, the ileal microbiota of Mongolian horses and other mammals appear highly conserved and could be related to the structure and function of the ileum.
Cecum and colon are the major sites of microbial hydrolysis and fermentation to produce VFAs, which are correlated with high abundance of Bacteroidetes and Firmicutes observed in these regions. Dynamic changes in the two phyla are closely related to obesity, and their proportion is an indicator of metabolism (Costa, Stampfli, et al., 2015; Ley, Turnbaugh, Klein, & Gordon, 2006). A high Firmicutes-to-Bacteroidetes (FD/BD) ratio is conducive to energy absorption and storage since Firmicutes can ferment more short-chain fatty acids (SCFAs) to promote fat accumulation (Backhed et al., 2004; Ley et al., 2005). The FD/BD ratio in this population of five Mongolian horse guts was ~0.82, indicating low-fat deposition, and correlated with the high roughage diet of the horses. Verrucomicrobia and Spirochetes are abundant in the colon (abdominal and dorsal colon), which is consistent with the hindgut microbes of Hokkaido horses, indicating high microbial diversity in both species (Yamano, Koike, Kobayashi, & Hata, 2008). In the LG, the predominant families were Ruminococcaceae (p = .203), Lachnospiraceae (p = .157), Rikenellaceae (p = .122), and Prevo Section (Prevotellaceae, p = .068) (Figure 2b). The Ruminococcaceae and Lachnospiraceae families are abundant in the hindgut of many animals, including horses, and are also associated with many intestinal diseases such as inflammatory bowel disease (IBD) (Dougal et al., 2013; Frank et al., 2007). The hindgut microbiota can produce a large amount of butyrate, which affects the health of the colonic mucosa (Brown et al., 2011; Jalanka-Tuovinen et al., 2011; Pryde, Duncan, Hold, Stewart, & Flint, 2002).
The Ruminococcaceae_UCG-005, Phascolarctobacterium, Prevotellaceae_UCG-003, Bacteroides, and Fibrobacter genera were significantly more abundant in the cecum than in the other parts of the GIT, while the relative abundances of Ruminococcus_1, Ruminococcaceae_UCG-002, Campylobacter (Centida), and Akkermansia (Ekmania) genera were the highest in the ventral colon. The Ruminococcaceae_NK4A214_group, Lachnospiraceae_XPB1014_group, Lachnospiraceae_AC2044_group, Rikenellaceae_RC9_gut_group (Reuters), and Prevotellaceae_UCG-001 (Prevoella) genera were abundant in the dorsal colon. Fibrobacter (Bacillus) and Ruminococcus_1 (Ruminococcus) are cellulose-degrading bacteria and were abundant in the hindgut, along with Akkermansia, which is more abundant in the ventral colon of Mongolian horses (5.7%). This bacterium is an appealing candidate to become a human probiotic because of negative correlation with the incidence of obesity, diabetes, inflammation, and metabolic disorders (Everard et al., 2013; Hansen et al., 2012; Png et al., 2010; Wang, Bose, Kim, Han, & Kim, 2015). Only four previous studies (Costa, Stampfli, Allen-Vercoe, & Weese, 2016; Costa, Stampfli, et al., 2015; Rodriguez et al., 2015; Zhao et al., 2016) described the genus Akkermansia in the equine intestinal microbiota, which was only found in stool samples. In this study, for the first time, we found the ventral colon had the highest content of Akkermansia in the gastrointestinal tract of Mongolian horses, which supports further study of this bacterium.
4.3 Functional prediction of the Mongolian horse intestinal microbiota
In previous studies, there was no prediction of the function of gastrointestinal flora in different parts of the gastrointestinal tract of horses (Costa, Silva, et al., 2015; Ericsson et al., 2016). This study predicted the functions of the bacterial communities for the first time. In terms of functional diversity, the gut microbiota of the Mongolian horse was enriched in seven pathways, with metabolism, genetic information processing, and environmental information processing as the top three functions. Despite the diversity of the microbial species across the different parts of the GIT, the functional abundance was similar, indicating that the core microbial functions may have species specificity in the GIT. The three-level functional abundance clustering clearly demarcated the anterior and the posterior intestine microbiota, indicating regional specificity in bacterial functions. However, the predictive power of PICRUSt is limited, and a combination of metagenomic sequencing, related functional gene analysis, and metabolomic profiling can elucidate the functions of the gut microbiota more accurately. In addition, the small sample size in our study may reduce the statistical significance of the differences among the different GIT regions, especially that of the stomach, and may have underestimated the complexity of the microbial communities and the intersample fluctuations. Although this is the first systematic study on the microbial population of the entire GIT of Mongolian horses, further research is needed to determine the effects of other factors such as age, geographical location, and seasonal diet. The influences of these factors on horse intestinal microbiota were not yet clear.
The resolution of the 16S rRNA amplicon sequencing used in this study was limited. Compared with whole-genome sequencing, targeted sequencing of the 16Sr RNA gene pool can only classify microorganisms at the level of species, and most of the sequences are only annotated at the level of family or genus. Although changes were detected in the composition of multiple microbial communities in this technique, some unclassified flora may still be ignored.
Although the materials collected from various parts of the gastrointestinal tract appeared uniform, the analysis results of a small number of samples may not represent the whole gastrointestinal tract. Multiple iterations of techniques to solve these problems are costly and of limited value.
5 CONCLUSIONS
The microbial communities of the different parts of the Mongolian horse GIT were significantly different, and there was greater diversity between the LG and UG. Direct sampling of the different segments of GIT provided a more complete diagram of the gut microbiota compared with fecal analysis. The vegetarian diets and adaptability of Mongolian horses were likely related not only to their stable and complicated gastrointestinal microbiota but also to their special herbivorous digestive physiology.
ACKNOWLEDGEMENTS
The authors would like to thank Dr Sachula Wu, Dr Xiaoqing Zhao, Dr Yumei Shan, and Dr A Naer for their technical help.
CONFLICT OF INTEREST
The authors declare no conflict of interest.
AUTHOR CONTRIBUTIONS
Shaofeng Su: Data curation; Formal analysis; Methodology; Project administration; Software; Validation. Yiping Zhao: Data curation; Formal analysis; Funding acquisition. Zongzheng Liu: Data curation; Funding acquisition; Investigation; Software; Writing-original draft. Guiqin Liu: Formal analysis; Methodology; Supervision. Ming Du: Funding acquisition; Investigation. Jing Wu: Formal analysis; Methodology. Dongyi Bai: Methodology; Visualization. Bei Li: Data curation; Formal analysis; Investigation; Supervision. Gerelchimeg Bou: Data curation; Methodology. Xinzhuang Zhang: Conceptualization; Data curation; Formal analysis. Manglai Dugarjaviin: Conceptualization; Data curation; Formal analysis; Funding acquisition; Project administration.
ETHICS STATEMENT
The animal experiments were approved by the Animal Welfare Committee of Inner Mongolia Agricultural University, and all procedures were conducted in accordance with the guidelines of the China Animal Protection Association.
APPENDIX A


| Treatment | Standing yield | Number of horses grazing (N) | Grazing days (D) | Grazing area (H) | The DMI per horse (PD) | |
|---|---|---|---|---|---|---|
| Fresh grass | Hay | |||||
| Button cage | 230.12 | 110.10 | 26 | 34 | 35.23 | 16.51 ± 4.09 |
| Buckle cage | 156.61 | 68.69 | ||||
Note
- The cage technique was used as follows: ten 1.5 m × 1.5 m grazing cages were placed within 35.23 ha pasture, and after 34-day grazing of 26 horses, the forage inside the cages and outside the cages in ten random areas was clipped. The weight of fresh forage was measured, and after drying, the daily dry matter intake of each horses was calculated according to the formula.
- Equation
-
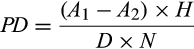
- PD: average daily dry matter intake per horse (kg/day); A1: the weight of dry forage inside the cages (g/m2); A2: the weight of dry forage outside the cages (g/m2); H: grazing area (ha); D: grazing days (d); N: number of horses grazing.
| Sample name | Raw reads | Clean reads | AvgLen | Q20 | GC (%) | Effective (%) |
|---|---|---|---|---|---|---|
| S1 | 90,585 | 73,788 | 425 | 81.63 | 51.61 | 81.46 |
| S2 | 98,791 | 82,327 | 421 | 83.21 | 51.82 | 83.33 |
| S3 | 68,040 | 56,342 | 427 | 81.88 | 50.79 | 82.81 |
| S4 | 82,014 | 70,854 | 422 | 82.14 | 51.30 | 86.39 |
| S5 | 96,887 | 79,844 | 423 | 83.20 | 52.33 | 82.41 |
| J1 | 61,172 | 51,050 | 412 | 82.45 | 53.03 | 83.45 |
| J2 | 59,552 | 50,242 | 417 | 82.89 | 52.21 | 84.37 |
| J3 | 61,896 | 55,809 | 413 | 84.32 | 52.39 | 90.17 |
| J4 | 66,417 | 57,663 | 417 | 81.50 | 52.10 | 86.82 |
| J5 | 50,270 | 42,694 | 422 | 80.87 | 51.85 | 84.93 |
| I1 | 95,415 | 81,279 | 409 | 84.18 | 52.65 | 85.18 |
| I2 | 85,419 | 73,445 | 415 | 84.27 | 52.66 | 85.98 |
| I3 | 88,472 | 74,295 | 413 | 84.03 | 52.54 | 83.98 |
| I4 | 68,976 | 56,355 | 416 | 83.41 | 52.16 | 81.70 |
| I5 | 88,063 | 73,236 | 422 | 83.08 | 51.91 | 83.16 |
| C1 | 99,816 | 91,416 | 417 | 82.07 | 52.28 | 91.58 |
| C2 | 93,470 | 85,400 | 417 | 83.17 | 51.90 | 91.37 |
| C3 | 99,126 | 87,429 | 417 | 82.90 | 50.75 | 88.20 |
| C4 | 96,382 | 87,077 | 415 | 83.34 | 52.31 | 90.35 |
| C5 | 98,692 | 91,563 | 417 | 83.61 | 52.16 | 92.78 |
| VC1 | 89,719 | 80,405 | 415 | 83.48 | 52.59 | 89.62 |
| VC2 | 104,706 | 93,704 | 414 | 84.27 | 52.67 | 89.49 |
| VC3 | 85,569 | 74,979 | 415 | 83.68 | 51.64 | 87.62 |
| VC4 | 96,420 | 83,924 | 414 | 83.87 | 52.60 | 87.04 |
| VC5 | 93,895 | 86,179 | 416 | 84.48 | 52.02 | 91.78 |
| DC1 | 103,526 | 99,032 | 417 | 83.12 | 53.00 | 95.66 |
| DC2 | 101,768 | 95,426 | 416 | 83.26 | 52.57 | 93.77 |
| DC3 | 94,374 | 86,551 | 415 | 82.11 | 52.78 | 91.71 |
| DC4 | 91,961 | 88,045 | 417 | 82.33 | 52.89 | 95.74 |
| DC5 | 90,325 | 85,003 | 415 | 82.84 | 53.17 | 94.11 |
Note
- Raw reads: filter out the sequences of low-quality bases; clean reads: After filtering the chimera, the final sequence is used for subsequent analysis; AvgLen: average length of clean reads; Q20: the percentage of bases whose mass value is greater than 20 in clean reads; GC (%): GC base content in clean reads; effective (%): the number of clean reads versus the number of raw reads.
- Abbreviations: C, cecum, DC, dorsal colon, I, ileum, J, jejunum, S, stomach, and VC, ventral colon.
| Phylum | Relative abundancea | The upper GITb | The lower GITc |
|---|---|---|---|
| Firmicutes | 0.5501 | 0.6455 ± 0.0944* | 0.4547 ± 0.0533 |
| Bacteroidetes | 0.2476 | 0.0744 ± 0.0830 | 0.4208 ± 0.0637** |
| Proteobacteria | 0.1243 | 0.2255 ± 0.0109*** | 0.0232 ± 0.0103 |
| Verrucomicrobia | 0.0220 | 0.0006 ± 0.0003 | 0.0434 ± 0.0155** |
| Fusobacteria | 0.0158 | 0.0300 ± 0.0262 | 0.0016 ± 0.0010 |
| Spirochetes | 0.0115 | 0.0002 ± 0.00004 | 0.0229 ± 0.0108* |
| Fibrobacteres | 0.0089 | 0.0002 ± 0.00004 | 0.0175 ± 0.0043** |
| Actinobacteria | 0.0089 | 0.01670 ± 0.0130 | 0.0012 ± 0.0002 |
| Tenericutes | 0.0031 | 0.0001 ± 0.00002 | 0.0061 ± 0.0008*** |
| Saccharibacteria | 0.0012 | 0.0010 ± 0.0005 | 0.0013 ± 0.0021 |
- Abbreviations: GIT, gastrointestinal tract; LG, lower gut; IG, upper gut.
- a The relative abundance of different flora in the whole gastrointestinal tract at the phylum level.
- b The average relative abundance of different flora in different parts of the upper GIT (stomach, jejunum, and ileum) at the phylum level.
- c The average relative abundance of different bacterial communities in the lower GIT in different parts (cecum, ventral colon, and dorsal colon) at the phylum level.
- *** p < .001, **p < .01, and *p < .05.
| Phylum | Stomach | Jejunum | Ileum | Cecum | Ventral colon | Dorsal colon |
|---|---|---|---|---|---|---|
| Firmicutes | 0.5416 ± 0.2548 ABab | 0.6687 ± 0.1109 ABab | 0.7261 ± 0.1225 Aa | 0.3980 ± 0.0516 Bb | 0.5040 ± 0.0900 ABab | 0.4620 ± 0.0677 ABb |
| Bacteroidetes | 0.1701 ± 0.1551 Bb | 0.0311 ± 0.0181 Bbc | 0.0220 ± 0.0134 Bc | 0.4838 ± 0.0819 Aa | 0.3564 ± 0.0682 Aa | 0.4222 ± 0.0598 Aa |
| Proteobacteria | 0.2195 ± 0.07142 Aa | 0.2380 ± 0.1198 Aa | 0.2190 ± 0.1365 Aa | 0.0271 ± 0.0099 Bb | 0.0310 ± 0.03341 Bb | 0.0116 ± 0.00601 Bb |
| Verrucomicrobia | 0.0003 ± 0.0002 | 0.0009 ± 0.0007 | 0.0007 ± 0.0004 | 0.0396 ± 0.0243 | 0.0604 ± 0.0967 | 0.0302 ± 0.0140 |
| Fusobacteria | 0.0601 ± 0.0585 Ab | 0.0159 ± 0.0097 ABac | 0.0138 ± 0.0103 ABac | 0.0018 ± 0.0030 Bc | 0.0025 ± 0.0048 Bc | 0.0005 ± 0.0005 Bc |
| Fibrobacteres | 0.0001 ± 0.0001 | 0.0002 ± 0.0002 | 0.0002 ± 0.0001 | 0.0222 ± 0.0385 | 0.0138 ± 0.0108 | 0.0166 ± 0.0133 |
| Actinobacteria | 0.0056 ± 0.0090 | 0.0310 ± 0.0367 | 0.0134 ± 0.0195 | 0.0014 ± 0.0009 | 0.0012 ± 0.0005 | 0.0009 ± 0.0005 |
| Spirochetes | 0.0001 ± 0.00004 Cc | 0.0002 ± 0.00009 Cc | 0.0002 ± 0.0002 Cc | 0.0144 ± 0.0081 BCb | 0.0193 ± 0.0103 ABb | 0.0350 ± 0.0114 Aa |
| Tenericutes | 0.00009 ± 0.00005 Bb | 0.0001 ± 0.0001 Bb | 0.00007 ± 0.00005 Bb | 0.0068 ± 0.0031 Aa | 0.0063 ± 0.0043 Aa | 0.0053 ± 0.0036 ABa |
| Saccharibacteria | 0.0006 ± 0.0010 | 0.0016 ± 0.0020 | 0.0007 ± 0.0012 | 0.00007 ± 0.0001 | 0.0001 ± 0.0001 | 0.0036 ± 0.0033 |
Note
- Capital letters indicate p < .001; lowercase letters indicate p < .01 (Student's t test).
| Phylum | Family | Genus | Stomach | Jejunum | Ileum | Cecum | Ventral colon | Dorsal colon |
|---|---|---|---|---|---|---|---|---|
| Firmicutes | Lactobacillaceae | Lactobacillus | 0.1347 ± 0.2326 | 0.0175 ± 0.0209 | 0.0091 ± 0.0130 | 0.0004 ± 0.0002 | 0.0003 ± 0.0001 | 0.0004 ± 0.0003 |
| Clostridiaceae | Clostridium_sensu_stricto_1 | 0.0741 ± 0.0740 Bb | 0.2724 ± 0.090 Aa | 0.3442 ± 0.1032 Aa | 0.0031 ± 0.0008 Bb | 0.0034 ± 0.0005 Bb | 0.0027 ± 0.0005 Bb | |
| Sarcina | 0.0182 ± 0.0236 | 0.0836 ± 0.0912 | 0.0499 ± 0.0392 | 0.0007 ± 0.0002 | 0.0008 ± 0.0002 | 0.0005 ± 0.0001 | ||
| Veillonellaceae | Veillonella | 0.1160 ± 0.1240 a | 0.0234 ± 0.0180 ab | 0.0458 ± 0.0558 ab | 0.0003 ± 0.0001 b | 0.0004 ± 0.0001 b | 0.0004 ± 0.0001 b | |
| Streptococcaceae | Streptococcus | 0.1239 ± 0.0714 Aa | 0.0872 ± 0.0679 ABa | 0.0642 ± 0.0561 ABab | 0.0011 ± 0.0004 Bb | 0.0009 ± 0.0003 Bb | 0.0008 ± 0.0001 Bb | |
| Peptostreptococcaceae | Terrisporobacter | 0.0169 ± 0.0315 | 0.0555 ± 0.0722 | 0.0259 ± 0.0172 | 0.0006 ± 0.0003 | 0.0007 ± 0.0001 | 0.0005 ± 0.0001 | |
| Intestinibacter | 0.0003 ± 0.0001 | 0.0033 ± 0.0023 | 0.0424 ± 0.0767 | 0.0002 ± 0.0002 | 0.0004 ± 0.0002 | 0.0002 ± 0.0001 | ||
| Romboutsia | 0.0003 ± 0.0001 b | 0.0139 ± 0.0237 ab | 0.0407 ± 0.0428 a | 0.0002 ± 0.0001 b | 0.0002 ± 0.0001 b | 0.0002 ± 0.0001 b | ||
| Ruminococcaceae | Ruminococcaceae_UCG-005 | 0.0002 ± 0.0001 Bb | 0.0007 ± 0.0007 Bb | 0.0005 ± 0.0003 Bb | 0.0609 ± 0.0229 Aa | 0.0469 ± 0.0196 Aa | 0.0121 ± 0.0022 Bb | |
| Ruminococcus_1 | 0.0005 ± 0.0005 b | 0.0005 ± 0.0002 b | 0.0005 ± 0.0002 b | 0.0201 ± 0.0127 ab | 0.0438 ± 0.0463 a | 0.0255 ± 0.0234 ab | ||
| Ruminococcaceae_NK4A214_group | 0.0001 ± 0.0001 Bc | 0.0006 ± 0.0005 Bc | 0.0004 ± 0.0002 Bc | 0.0077 ± 0.0059 Bbc | 0.0176 ± 0.0095 Bb | 0.0590 ± 0.0167 Aa | ||
| Ruminococcaceae_UCG-002 | 0.0002 ± 0.0001 Bb | 0.0003 ± 0.0001 Bb | 0.0002 ± 0.0001 Bb | 0.0009 ± 0.0004 Bb | 0.0433 ± 0.0271 Aa | 0.0307 ± 0.0164 Aa | ||
| Lachnospiraceae | Cellulosilyticum | 0.0006 ± 0.0004 | 0.0445 ± 0.0765 | 0.0339 ± 0.0402 | 0.0007 ± 0.0006 | 0.0020 ± 0.0010 | 0.0006 ± 0.0003 | |
| Lachnospiraceae_XPB1014_group | 0.0002 ± 0.0001 b | 0.0004 ± 0.0002 b | 0.0004 ± 0.0002 b | 0.0159 ± 0.0115 ab | 0.0234 ± 0.0156 ab | 0.0432 ± 0.0475 a | ||
| Lachnospiraceae_AC2044_group | 0.0001 ± 0.0001 | 0.0005 ± 0.0002 | 0.0003 ± 0.0001 | 0.0216 ± 0.0199 | 0.0182 ± 0.0134 | 0.0251 ± 0.0313 | ||
| Acidaminococcaceae | Phascolarctobacterium | 0.0002 ± 0.0001 b | 0.0003 ± 0.0002 b | 0.0001 ± 0.00004 b | 0.0243 ± 0.0248 a | 0.0226 ± 0.0166 ab | 0.0072 ± 0.0029 ab | |
| Carnobacteriaceae | Atopostipes | 0.0139 ± 0.0272 | 0.0067 ± 0.0098 | 0.0033 ± 0.0059 | 0.00003 ± 0.00002 | 0.00008 ± 0.00002 | 0.00003 ± 0.00004 | |
| Erysipelotrichaceae | Turicibacter | 0.0001 ± 0.0002 b | 0.0012 ± 0.0011 b | 0.0222 ± 0.0272 a | 0.0001 ± 0.0001 b | 0.0001 ± 0.00004 b | 0.0001 ± 0.00004 b | |
| Bacteroidetes | Rikenellaceae | Rikenellaceae_RC9_gut_group | 0.0007 ± 0.0005 Bb | 0.0007 ± 0.0004 Bb | 0.0008 ± 0.0005 Bb | 0.1018 ± 0.1188 ABab | 0.0838 ± 0.0647 ABab | 0.1546 ± 0.0426 Aa |
| Prevotellaceae | Alloprevotella | 0.0466 ± 0.0557 | 0.0031 ± 0.0030 | 0.0023 ± 0.0018 | 0.0113 ± 0.0056 | 0.0057 ± 0.0024 | 0.0017 ± 0.0009 | |
| Prevotellaceae_UCG-001 | 0.0002 ± 0.0003 | 0.0001 ± 0.0001 | 0.0001 ± 0.0002 | 0.0366 ± 0.0482 | 0.0172 ± 0.0197 | 0.0519 ± 0.0035 | ||
| Prevotellaceae_UCG-003 | 0.0065 ± 0.0099 ABb | 0.0006 ± 0.0051 Bb | 0.0002 ± 0.0002 Bb | 0.0360 ± 0.0277 Aa | 0.0068 ± 0.0277 ABb | 0.0023 ± 0.0013 Bb | ||
| Bacteroidaceae | Bacteroides | 0.0104 ± 0.0137 | 0.0029 ± 0.0029 | 0.0009 ± 0.0004 | 0.0253 ± 0.0499 | 0.0160 ± 0.0314 | 0.0011 ± 0.0018 | |
| Porphyromonadaceae | Porphyromonas | 0.0194 ± 0.0305 | 0.0044 ± 0.0065 | 0.0003 ± 0.0034 | 0.0001 ± 0.0001 | 0.0001 ± 0.0001 | 0.0002 ± 0.0001 | |
| Proteobacteria | Pasteurellaceae | Actinobacillus | 0.1684 ± 0.0242 Aa | 0.1851 ± 0.1070 Aa | 0.1735 ± 0.1133 Aa | 0.0020 ± 0.0014 Bb | 0.0017 ± 0.0005 Bb | 0.0011 ± 0.0003 Bb |
| Campylobacteraceae | Campylobacter | 0.0008 ± 0.0009 | 0.0008 ± 0.0009 | 0.0006 ± 0.0003 | 0.0022 ± 0.0028 | 0.0148 ± 0.0267 | 0.0037 ± 0.0043 | |
| Verrucomicrobia | Akkermansiaceae | Akkermansia | 0.0003 ± 0.0001 | 0.0008 ± 0.0005 | 0.0006 ± 0.0004 | 0.0369 ± 0.0223 | 0.0579 ± 0.0871 | 0.0202 ± 0.0128 |
| Fusobacteria | Fusobacteriaceae | Fusobacterium | 0.0321 ± 0.0532 | 0.0100 ± 0.0077 | 0.0084 ± 0.0081 | 0.0016 ± 0.0028 | 0.0023 ± 0.0044 | 0.0004 ± 0.0005 |
| Fusobacteria | Leptotrichiaceae | Leptotrichia | 0.0280 ± 0.0341 | 0.0058 ± 0.0078 | 0.0054 ± 0.0068 | 0.0002 ± 0.0001 | 0.0002 ± 0.0001 | 0.0001 ± 0.0001 |
| Fibrobacteres | Fibrobacteraceae | Fibrobacter | 0.0001 ± 0.0001 | 0.0002 ± 0.0001 | 0.0002 ± 0.0001 | 0.0222 ± 0.0344 | 0.0138 ± 0.0097 | 0.0166 ± 0.0119 |
Note
- Capital letters indicate p < .001; lowercase letters indicate p < .01 (Student's t test).
Open Research
DATA AVAILABILITY STATEMENT
Data are available from the National Centre for Biotechnology Information Sequence Read Archive repository under the BioProject PRJNA524207 (https://www.ncbi.nlm.nih.gov/bioproject/PRJNA524207).