Proteomic analysis of Aspergillus niger 3.316 under heat stress
Graphical Abstract
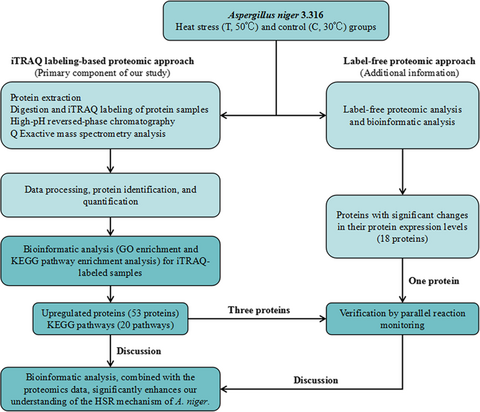
We explored the intracellular proteome profile of Aspergillus niger 3.316 in group T (50°C stress) and group C (30°C control) using isobaric tags for relative and absolute quantitation proteomic approach, and the observations were further verified using a parallel reaction monitoring approach. The label-free proteomic analysis provided an additional explanation of the differences between groups T and C. Bioinformatic analysis, combined with the proteomics data, significantly enhances our understanding of the heat stress response mechanism of A. niger.
Abstract
β-Glucosidase production by Aspergillus niger is accompanied by an inevitable temperature increase in the industrial fermentation environment. Hence, the synthetic process of β-glucosidase is negatively affected. However, our understanding of the heat stress response (HSR) mechanism in A. niger is still incomplete. The current study explored the intracellular proteome profile of A. niger 3.316 in group T (50°C stress) and group C (30°C control) using two proteomic approaches (isobaric tags for relative and absolute quantitation [iTRAQ] and label-free) and examined the expression of four proteins using a parallel reaction monitoring (PRM) approach. Based on the result of the iTRAQ proteomic analysis, 1,025 proteins were differentially expressed in group T compared to group C. Using the label-free approach, we only focused on 77 proteins with significant changes in their protein expression levels. In addition, we performed bioinformatics analysis on all these proteins and obtained detailed gene ontology (GO) enrichment and Kyoto encyclopedia of genes and genomes (KEGG) pathway results. Under heat stress conditions, the relative expression levels of proteins with protection and repair functions were upregulated in A. niger 3.316. These proteins were involved in metabolic pathways, oxidative phosphorylation, porphyrin and chlorophyll metabolism, pyruvate metabolism, and the citrate cycle (TCA cycle). The insights obtained from the presented proteomics and bioinformatics analyses can be used to further explore the HSR mechanism of A. niger.
1 INTRODUCTION
Currently, Aspergillus niger is one of the most important industrial fermentation microorganisms and a significant producer of lignocellulosic enzyme biomass worldwide (Andersen et al., 2011; Souza et al., 2013). Cellulase is used in the degradation of lignocellulosic biomass into soluble free sugars in order to produce ethanol (Adav, Li, Manavalan, & Punt, 2010). It has the potential to generate an alternative clean energy source for various industries (Adav et al., 2010). β-Glucosidase produced by A. niger is an important component of the cellulase enzyme complex and has been widely used in industrial production (Lima et al., 2013).
Liquid media for A. niger fermentation are based on an unsteady-state operation. The fermentation temperature and the flow rate are two significant factors that influence the production of β-glucosidase (Abrashev et al., 2014). Generally, the optimum temperature for the growth of most fungi is 37°C (Klinkert & Narberhaus, 2009; Shankar, Nigam, Saxena, & Madan, 2004). An increase in the temperature can have several consequences for fungal cells, primarily a decrease in cell viability (Bhabhra & Askew, 2005; Lamoth, Juvvadi, Fortwendel, & Steinbach, 2012). A. niger is certainly no exception. During the fermentation of A. niger, substantial cellular damage can be caused by a temperature increase in the fermentation environment (Abrashev et al., 2008). Consequently, the efficiency of producing β-glucosidase during industrial fermentation is greatly reduced. To circumvent this disadvantage, the production cost can increase substantially to maintain the relative stability of the fermentation temperature. However, fungal cells have adaptation mechanisms to reduce the impact of heat stress. One of the most significant adaptation mechanisms for fungal cells under heat stress is the heat stress response (HSR), a highly conserved gene expression regulatory circuit that inhibits protein biosynthesis and induces the expression of a series of cytoprotective genes encoding heat shock proteins (HSPs; Verghese, Abrams, Wang, & Morano, 2012). HSPs are soluble intracellular proteins that can increase the protection of fungi from environmentally induced cellular damage, which in turn regulates HSR (Liu, Yang, & Ma, 2007). HSPs are involved in various routine biological processes in fungi, including transcription, translation, and posttranslational modifications (Tiwari, Thakur, & Shankar, 2015). HSPs serve as molecular chaperones to promote refolding of unfolded or misfolded proteins and can help identify proteins that have been denatured (Thomas, Campos, Le, & Guyotat, 2005). Heat stress can also cause the production of reactive oxygen species (ROS; Abrashev et al., 2014). Various ROS-scavenging proteins can respond to heat stress, such as catalase (CAT), superoxide dismutase (SOD), thioredoxin reductases (TrxRs), and glutaredoxin–glutathione reductases (GRX-GRs; Zhang, St. Leger, & Fang, 2017). Several protein families, in addition to HSPs, are involved in the process of HSR.
To the best of our knowledge, this is the first study to perform proteomic (isobaric tags for relative and absolute quantitation [iTRAQ] and label-free) and bioinformatic analysis on the intracellular proteins of A. niger 3.316 under heat stress. The relative quantification results for the protein samples were estimated in the heat stress (T, 50°C) and control (C, 30°C) groups using the iTRAQ labeling-based proteomic approach. Because iTRAQ has the advantages of sensitivity and reliability, we regarded the iTRAQ proteomic analysis as the primary component of our study; the label-free proteomic analysis serves as additional information. Based on the results of the label-free proteomic analysis, we only focused on 77 proteins with significant changes in their protein expression levels. Bioinformatic analysis was conducted for all differentially expressed proteins (DEPs). Furthermore, parallel reaction monitoring (PRM) is a targeted hypothesis-driven proteomics approach, offering high sensitivity, reproducibility, and precision (Bourmaud, Gallien, & Domon, 2016). PRM ensures quantitative sensitivity and specificity, with high-throughput detection, and a strong anti-interference ability and high resolution in complex backgrounds (Tang et al., 2014; Taumer et al., 2018). To further substantiate our observations from the iTRAQ and label-free analysis, we examined the expression of selected proteins using a PRM approach.
At present, a limited number of studies have been conducted on A. niger HSR. The main studies that examined HSPs and ROS-scavenging proteins are those by Sorensen, Lametsch, Andersen, and Nielsen (2009) and Abrashev et al. (2008). The number of previously studied proteins associated with HSR is relatively insufficient. A comprehensive proteomic analysis of A. niger, in combination with sufficient bioinformatic data, has not been previously reported. The exact process of HSR in A. niger remains unknown. Therefore, the aim of the present study was to combine the results of the proteomic and bioinformatic analyses to better understand the mechanism of HSR of the A. niger 3.316 strain.
2 MATERIALS AND METHODS
2.1 Chemicals
The chemicals and reagents used in this study included radioimmunoprecipitation assay (RIPA) lysis buffer (89900; Thermo Fisher Scientific), dithiothreitol (DTT) (161-0611; Bio-Rad), iodoacetamide (163-2109; Bio-Rad), dissolution buffer (4381664; AB Sciex), trypsin (V5111; Promega), iTRAQ 8-plex (4390812; AB Sciex), acetonitrile (100030; Merck KGaA), and formic acid (56302; Sigma-Aldrich). In addition, sucrose (V900116), NaNO3 (229938), MgSO4·7H2O (1058860), KCl (746436), FeSO4·7H2O (F8263), and K2HPO4 (P8709) were obtained from Sigma-Aldrich.
2.2 Microorganism culture and heat stress conditions
The experimental fungal strain used in the present study, A. niger 3.316, originated from the Chinese General Microbiological Culture Collection Center (CGMCC). A preculture was prepared by inoculating A. niger 3.316 in 250-ml conical flasks containing 100 ml of Czapek Dox liquid medium. The medium composition was as follows: 3 g sucrose, 0.3 g NaNO3, 0.05 g MgSO4·7H2O, 0.05 g KCl, 0.001 g FeSO4·7H2O, and 0.1 g K2HPO4. These reagents were mixed in 100 ml of distilled water and incubated at 30°C at 155 rpm for 60 hr.
The preculture was added (10 ml) to a 250-ml conical flask containing the Czapek Dox culture medium (100 ml). It has been shown that Aspergillus niger 26 can survive under heat stress at 45°C (Abrashev et al., 2014). Our previous work indicated that 50°C is suitable for heat stress, and this temperature was therefore used in the present study. After inoculation, the samples were divided into two groups, the control (C) and treatment (T) groups, cultured at 30°C and 50°C (stress), respectively, at 155 rpm for 24 hr.
2.3 Preparation of protein samples to be analyzed
2.3.1 Protein extraction
The A. niger 3.316 samples were divided into two parts, one part for iTRAQ proteomic analysis (four biological replicates) and the other part for label-free proteomic analysis (three biological replicates). After the heat stress, extraction of the intracellular proteins of A. niger 3.316 was achieved using RIPA lysis buffer. The samples were then incubated on ice for 30 min with occasional shaking. The insoluble components were removed via centrifugation at 15,000 g for 1 hr at 10°C. The protein concentration was measured using the Bradford assay (Harlow & Lane, 2006).
2.3.2 Digestion and iTRAQ labeling of protein samples
Two hundred micrograms of protein in each sample were mixed with 25 mM DTT and incubated at 60℃ for 1 hr (Nel, Garnett, Blackburn, & Soares, 2015). Subsequently, 50 mM iodoacetamide was added (Nel et al., 2015). After 10 min, the mixture was centrifuged for 20 min at 12,000 g (Nel et al., 2015). One hundred microliters of dissolution buffer was added, and the solution was then centrifuged at 12,000 g for 20 min; this step was repeated three times. Next, four micrograms of trypsin were added to each protein sample with a ratio of 1/50 (trypsin/protein). All protein samples were digested at 37℃ for 12 hr. The digestion of the proteins was conducted with four replicates. Thereafter, the digested samples were labeled with the iTRAQ 8-plex according to the manufacturer's protocol (Karp et al., 2010). For the group C samples, the details are as follows: sample C1 (113 tag), C2 (114 tag), C3 (115 tag), and C4 (116 tag). For the group T samples, the details are as follows: sample T1 (117 tag), T2 (118 tag), T3 (119 tag), and T4 (121 tag). Thereafter, the eight labeled samples were combined. The mixed sample was used for chromatography.
2.4 High-pH reversed-phase chromatography
A RIGOL L-3000 HPLC system (RIGOL, China) with a Durashell-C18 column (4.6 mm × 250 mm, 5 μm, 100 Å) (Agela, USA) was used to fractionate the iTRAQ-labeled peptides. One hundred microliters of sample was loaded onto the column in A buffer (98% doubly distilled water, 2% acetonitrile, pH 10) and eluted in a combination of A buffer and B buffer (2% doubly distilled water, 98% acetonitrile, pH 10) with a gradient of 5% to 95% over 73 min, at a flow rate of 0.7 ml/min. A total of 10 fractions were obtained, and mass spectrometry detection was performed on each fraction.
2.5 Q Exactive mass spectrometry analysis
Each sample was split into two volumes and subsequently analyzed on an EASY-Spray C18 LC column (75 μm × 120 mm, 3 μm) (Thermo Fisher Scientific). A Q Exactive mass spectrometer (Thermo Fisher Scientific) combined with an EASY-nLC 1000 system (Nano HPLC, Thermo Fisher Scientific) was used to analyze the samples. Ten microliters of each sample was separated using mobile phase A (99.9% ultrapure water, 0.1% formic acid) and mobile phase B (99.9% acetonitrile, 0.1% formic acid), with a gradient of 5% to 95% mobile phase B for 126 min, at a flow rate of 0.3 μl/min. Then, the eluate was analyzed using the Q Exactive mass spectrometer.
The MS data were acquired in high sensitivity mode, using the following analytical parameters: ion source EASY-Spray, spray voltage 2.3 kV; capillary temperature, 320℃; full scan automatic gain control (AGC), target 3E6; resolution, 70,000 (full width at half maximum, fwhm); full scan maximum injection time, 20 ms; and scan range, 300 − 1,800 m/z. The MS/MS spectrum parameters were as follows: resolution, 17,500 (fwhm); AGC target, 1E5; maximum injection time, 120 ms; and intensity threshold, 8.30E3. A total of 30 data-dependent MS/MS scans were acquired for each full scan. Precursor ions were further fragmented in a collision cell using normalized collision energy of 32%, and the fragments were quantitated using an Orbitrap.
2.6 Data processing, protein identification, and quantification
All MS and MS/MS data were analyzed by the ProteoWizard software (version 3.0.8789). The MS/MS raw data were searched against the A. niger subset of the UniProt database (uniprot-proteome-Aspergillus_niger-5061; http://www.uniprot.org/) using the Mascot Distiller software (version 2.6.0; Adav et al., 2010). Each fraction corresponded to one raw file (10 raw files). The mass spectrometry raw data have been deposited to the ProteomeXchange Consortium via the iProX partner repository. Trypsin was selected for protein cleavage site identification, with a maximum of two allowed missed cleavages. Carbamidomethylation at cysteine and iTRAQ 8-plex labels were set as fixed modifications. Mascot searches were performed using a fragment ion mass tolerance of 0.02 Da and a parent ion tolerance of 10.0 ppm.
The Scaffold software (version 4.6.2) was used for protein identification and quantification. Moreover, Scaffold was used to further filter the database search results with a 1% false discovery rate (FDR) at the protein level and two unique peptides per protein (Searle, 2010). Following data filtering, the peptide abundance of the different reporter ion channels of the MS/MS scan was normalized. The protein abundance ratio was based on unique peptide results. Furthermore, the relative quantitation results (ratio) of all identified proteins were obtained according to channels 117/113, 118/114, 119/115, and 121/116, corresponding to T1/C1, T2/C2, T3/C3, and T4/C4, respectively. Proteins with a fold change greater than or equal to 1.3 (T/C ≥ 1.3) or T/C ≤ 0.83, with a p-value < .05 by Student's t test, were selected as DEPs. A volcano plot was constructed by combining the fold-change analysis and t test results using the Perseus software (version 1.5.5.1; Tyanova, Temu, Sinitcyn, et al., 2016).
2.7 Bioinformatic analysis for iTRAQ-labeled samples
Hierarchical clustering analysis was carried out using the Perseus software (version 1.5.5.1) to identify proteins with a significant fold change between groups T and C (Tyanova, Temu, Sinitcyn, et al., 2016). GO enrichment was performed using the Blast2GO software (version 4.1; Conesa et al., 2005). All DEPs were subjected to KEGG pathway enrichment analysis using the Koba software (version 2.0, a database for KEGG; Xie et al., 2011). KEGG pathways with computed p-values <.05 were considered significantly enriched. In addition, the proteins selected based on their expression profile under heat stress conditions were also screened using GO enrichment analysis (Blast2GO software, version 4.1).
2.8 Label-free proteomic analysis and bioinformatic analysis
Label-free proteomic analysis was also performed on the samples of groups T and C. The analysis included three biological replicates for each group (6 samples). The experimental procedures for the label-free proteomic analysis of the samples were identical to those described for the iTRAQ proteomic analysis, except for the iTRAQ labeling and chromatography steps, which were not executed. MS detection was performed on each sample, where each sample generated one raw file. The mass spectrometry raw data have been deposited to the ProteomeXchange Consortium via the iProX partner repository. Moreover, MaxQuant (version 1.6.2) was used for protein identification according to the following settings (Cox & Mann, 2008; Tyanova, Temu, & Cox, 2016): trypsin cleavage with a maximum of two missed cleavages; peptide mass matching error tolerance of 10 ppm; fragment mass tolerance of 0.05 Da; fixed carbamidomethylation of cysteine; variable modifications of deamidation of asparagine, deamidation of glutamine, and oxidation of methionine. GO enrichment analysis was also performed using the Blast2GO software (version 4.1).
2.9 Parallel reaction monitoring and data processing
PRM was performed to further verify the MS observations. The A. niger 3.316 samples used for PRM were the same as those used for proteomic analysis (iTRAQ and label-free). The biological replicates used for PRM were also the same as those used to perform the discovery-phase experiment. We selected three of the 53 upregulated proteins (based on iTRAQ analysis, Table 2) for PRM verification: alpha, alpha-trehalose glucohydrolase TreA/Ath1, GPI-anchored cell wall organization protein Ecm33, and 60S acidic ribosomal protein P1. We also selected sugar transporter for PRM verification, from the list of 18 proteins studied by label-free analysis (Table 3). A target peptide list consisting of nine peptides was selected from the four selected proteins, based on a data-dependent acquisition (DDA) experiment. This target peptide list was then imported into the inclusion list of the Xcalibur PRM module, and a candidate ion mass selection error tolerance of 5 ppm was set for PRM mode detection.
A Q Exactive HF quadrupole Orbitrap mass spectrometer (Thermo Fisher Scientific) combined with a NanoAcuity UPLC (Waters) was used to analyze the samples. The samples were loaded in mobile phase A (99.9% ultrapure water, 0.1% formic acid) and eluted by a combination of mobile phase A and mobile phase B (99.9% acetonitrile, 0.1% formic acid), with a gradient of 2%‒80% mobile phase B for 120 min at a flow rate of 0.3 μl/min. The MS/MS data were acquired using the following parameters: spray voltage, 2.0 kV; capillary temperature, 300°C; resolution, 15,000 (fwhm); maximum ion injection time, 100 ms; and automatic gain control (AGC) target, 1E5. In addition, the parameters were set to account for peptides with two charges and no peptides containing methionine. The candidate parent ion was fragmented using high-energy C-trap dissociation (HCD) and scanned using an Orbitrap. The scan range (110–2,000 m/z) is automatically controlled according to the m/z ratio of the parent ion. The MS/MS raw data were processed using the Skyline (version 19.1.0.193) software to evaluate the peak shapes of the target peptides. The data were deemed reliable when the peak shape was intact and the retention time was within the set retention time range (Maclean et al., 2010). The peptide abundance of the selected four proteins was then determined. Peptides with computed p-values lower than .1 (two-tailed Student's t test) were considered reliable. The PRM analysis included four biological replicates.
2.10 Statistical analysis
Student's t test was used to compare the protein quantification data of samples in group C (30°C control) and group T (50°C stress). Fisher's exact test was performed on the data from the GO and KEGG pathway enrichment analyses. The PRM data were analyzed using a two-tailed Student's t test.
3 RESULTS
3.1 Quantification of intracellular proteins based on iTRAQ labeling
The intracellular expression levels of the proteins of A. niger 3.316 were markedly affected by heat stress. A total of four independent iTRAQ labeling experiments were performed, and the results demonstrated that the experiments were reproducible. The search results from the Uniprot database indicated that 1,025 proteins were differentially expressed in the samples of group T compared to the samples of group C. Correlation analysis of the protein intensity demonstrated the reliability of the experimental data.
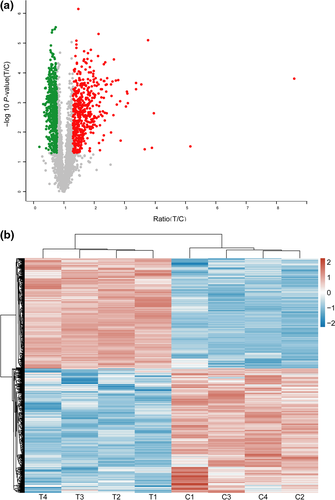
The volcano plot (Figure 1a) simultaneously presents the fold change and t test results. The comparison of the quantitative data of the proteins in group C indicated that 481 proteins were highly upregulated in A. niger 3.316, whereas 544 proteins were downregulated. Hierarchical clustering analysis illustrated that 1,025 DEPs in the T group were clearly distinguished from the proteins in the C group, whereas the ratio of all DEPs in each sample was intuitively represented (Figure 1b). The upregulated proteins were involved in the HSR mechanism of A. niger 3.316.
3.2 Bioinformatic analysis data of the 1,025 DEPs
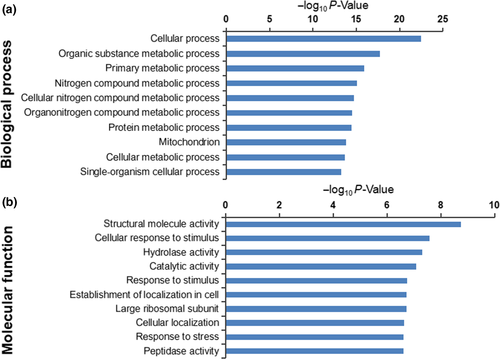
The Uniprot and KEGG database searches allowed us to correlate the GO results with molecular functions and biological processes related to the A. niger 3.316 HSR. The top 10 most significant terms of protein enrichment were identified by GO molecular function analysis and biological process analysis (Figure 2a,b, respectively).
Importantly, the analysis indicated that certain terms were more closely related to HSR. We further defined eight molecular function terms and five biological process terms (Table 1), including 53 upregulated proteins (Table 2) and 41 downregulated proteins (Table A1). These terms were supported by bioinformatic information metadata on the GO database as follows: The molecular functional (MF) section included cellular response to stress, intracellular protein transmembrane transport, cellular response to misfolded proteins, unfolded protein binding, positive regulation of molecular function, cellular response to topologically incorrect protein, antioxidant activity, and peroxidase activity (Table 1). The biological process (BP) analysis section included protein folding, cellular response to oxidative stress, cellular protein modification process, regulation of macromolecular metabolic processes, and cellular response to heat (Table 1). Certain upregulated or downregulated proteins were involved in multiple GO terms. This resulted in a total selection of 94 proteins (53 upregulated and 41 downregulated proteins), of which 54 were specialized in the cellular response to stress, eight carried out intracellular protein transmembrane transport, four were involved in cellular response to misfolded proteins, eight operated in unfolded protein binding, nine operated in positive regulation of molecular function, and others played key roles in the cellular response to topologically incorrect proteins (five proteins), antioxidantactivity (seven proteins), and peroxidase activity (six proteins). Furthermore, a total of 14, 38, and 14 proteins were involved in protein folding, cellular protein modification process, and cellular response to oxidative stress, respectively, whereas 44 participated in the regulation of macromolecular metabolic processes and nine were specialized in the cellular response to heat. Based on the GO terms presented in Table 1, and the specific ratio of each DEP listed in Table 2, it can be inferred that these proteins may play important roles in the HSR mechanism of A. niger 3.316.
| Term | Number of DEPs | p-Value |
|---|---|---|
| Molecular function | ||
| Cellular response to stress | 54 | 1.15E−06 |
| Intracellular protein transmembrane transport | 8 | .015 |
| Cellular response to misfolded protein | 4 | .016 |
| Unfolded protein binding | 8 | .021 |
| Positive regulation of molecular function | 9 | .022 |
| Cellular response to topologically incorrect protein | 5 | .026 |
| Antioxidant activity | 7 | .029 |
| Peroxidase activity | 6 | .031 |
| Biological process | ||
| Protein folding | 14 | .001 |
| Cellular response to oxidative stress | 14 | .001 |
| Cellular protein modification process | 38 | .013 |
| Regulation of macromolecule metabolic process | 44 | .022 |
| Cellular response to heat | 9 | .003 |
| Protein name | Accession no. | p-Value | Ratio |
|---|---|---|---|
| Alpha, alpha-trehalose glucohydrolase TreA/Ath1 | A0A100I1U6 | .00015 | 2.419 |
| Aha1 domain family | A0A117DZ55 | .0025 | 1.534 |
| Phosphatidyl synthase | A0A117DWL1 | .0065 | 1.338 |
| Kexin | A0A117DWS3 | .0014 | 1.594 |
| UDP-glucose:glycoprotein glucosyltransferase | A0A100IE92 | .0059 | 1.465 |
| Protein transport protein SEC13 | A0A117DX10 | .0011 | 1.409 |
| Ubiquitin fusion degradation protein Ufd1 | A0A100I306 | .002 | 1.528 |
| GPI-anchored cell wall organization protein Ecm33 | A0A117DX26 | .00025 | 3.546 |
| l-asparaginase | A0A117E3D0 | .019 | 2.865 |
| Phosphoesterase | A0A100IRD2 | .013 | 1.365 |
| Translation initiation factor | A0A100INM7 | .0004 | 1.348 |
| Heat shock protein Hsp98/Hsp104/ClpA | A0A100I757 | .019 | 1.363 |
| Calcium channel subunit Cch1 | A0A100II07 | .0017 | 1.377 |
| V-type proton ATPase subunit F | A0A117DX62 | .00082 | 1.465 |
| Catalase | A0A100I1U7 | .00056 | 2.021 |
| NADH-cytochrome b5 reductase | A0A124BUN3 | .0024 | 1.476 |
| Peroxidase | A0A117DXD4 | .00026 | 2.016 |
| DNA mismatch repair protein Msh2 | A0A117E0Y6 | .0069 | 1.423 |
| Mannitol-1-phosphate 5-dehydrogenase | A0A100I4E3 | .00049 | 1.383 |
| Ras-like protein | A0A117DUH2 | .00018 | 2.781 |
| Cell division control protein 2 kinase | A0A117E082 | .0057 | 1.341 |
| Allergen | A0A124BYU7 | .0046 | 1.497 |
| DNA replication factor C subunit Rfc5 | A0A100I4N1 | .00069 | 1.932 |
| Protein GCY | A0A100IL95 | .00108 | 1.365 |
| Heat shock protein SSC1, mitochondrial | A0A124BXS3 | .011 | 1.320 |
| Import inner membrane translocase subunit tim10 | A0A100I2H5 | .047 | 1.470 |
| Mitochondrial import receptor subunit | A0A100IIJ7 | .00167 | 1.548 |
| Mitochondrial import inner membrane translocase subunit tim-16 | A0A100IT22 | .0033 | 1.358 |
| Mitochondrial import receptor subunit tom-40 | A0A117DZK5 | .015 | 1.412 |
| Hsp70 chaperone | A0A100IDD7 | .0019 | 1.381 |
| 60S acidic ribosomal protein P1 | A0A100INH0 | .0065 | 1.829 |
| Profilin | A0A117E1G0 | .0116 | 1.653 |
| Catalase | A0A117DVZ9 | .00025 | 2.547 |
| Allergen Asp F3 | A0A124BYH9 | .0154 | 1.485 |
| FK506-binding protein 2 | A0A100I4T5 | .016 | 1.433 |
| Disulfide isomerase | A0A100I4B6 | .0045 | 1.796 |
| Eukaryotic translation initiation factor 5 | A0A117E234 | .00019 | 1.326 |
| Prohibitin | A0A100IIG1 | .00027 | 2.080 |
| Zn(II)2Cys6 transcription factor | A0A124BWU7 | .0087 | 1.593 |
| 1,3-beta-glucanosyltransferase | A0A100INU2 | .0042 | 1.512 |
| C6 zinc finger domain protein | A0A100IM80 | .035 | 1.589 |
| C6 transcription factor | A0A100IQP1 | 7.49E−05 | 1.367 |
| Folylpolyglutamate synthase | A0A100IA90 | .00042 | 1.393 |
| Endoplasmic reticulum DnaJ domain protein Erj5 | A0A100INL2 | .033 | 1.559 |
| Cyclophilin-like peptidyl-prolyl cis-trans isomerase | A0A100IS83 | .0037 | 1.529 |
| Cell division control protein 42 | A0A100IRP8 | .012 | 1.652 |
| 60S ribosomal protein L30 | A0A100IPI2 | .0198 | 1.584 |
| E3 ubiquitin-protein ligase | A0A100IHK9 | 8.96E−05 | 1.351 |
| Aldehyde dehydrogenase | A0A100IJL1 | .0092 | 1.428 |
| C6 transcription factor | A0A100ISD3 | .00015 | 2.045 |
| Prohibitin | A0A100IPF9 | .0027 | 1.711 |
| Protein disulfide isomerase | A0A100IRZ3 | .0044 | 1.763 |
| Guanine nucleotide-binding protein subunit alpha | A0A100IIH6 | .000062 | 1.592 |
Note
- Protein names and accession numbers are based on the Uniprot database. The ratio is referring to the relative quantitative results for the T and C groups.
In addition, some of these DEPs were previously reported to play important roles in stress response mechanisms or metabolic processes of fungi, such as glycosylphosphatidylinositol (GPI)-anchored cell wall organization protein Ecm33 (ratio 3.546), alpha, alpha-trehalose glucohydrolase TreA/Ath1 (ratio 2.419), 60S acidic ribosomal protein P1 (ratio 1.829), DNA replication factor C subunit 5 (ratio 1.932), disulfide isomerase (ratio 1.796), C6 zinc finger domain protein (ratio 1.589), and cell division control protein 42 (ratio 1.652). In the discussion section, the specific functions of these proteins in fungal cells will be described in detail. Proteins were selected based on their greater quantification ratio (T/C) among the 53 upregulated proteins. In addition, the roles of Hspssc1 (ratio 1.320), Hsp70 chaperone (ratio 1.381), and Hsp98/Hsp104/ClpA (ratio 1.363) in the HSR process, as well as the functions of peroxidase (ratio 2.016) and catalase (ratio 2.02) with regard to ROS scavenging, have been well described in previous studies. Therefore, the function of the Hsp70 chaperone is also described in the discussion section.
3.3 KEGG pathway enrichment
The 1,025 DEPs (comparing the T and C groups) were enriched in numerous KEGG pathways. We identified the top 20 KEGG pathway enrichment terms (Figure 4). A more detailed representation of this list of pathways is shown in Table A2. Corrected p-values are listed in the Table S1. The two most significant enrichment pathways were the metabolic (ang01100) and the oxidative phosphorylation (ang00190) pathways. A total of 137 and 15 DEPs were enriched in these two pathways, respectively. Additional significant enrichment pathways identified in the present study were involved in porphyrin and chlorophyll metabolism (ang00860), pyruvate metabolism (ang00620), and the citric acid cycle (TCA cycle) (ang00020).
3.4 Label-free proteomic analysis
We performed a label-free proteomic analysis to provide additional information to support the iTRAQ labeling results. Based on the result of the label-free proteomic analysis, we found that 77 proteins (Table A3) were identified in group T (50°C stress) but not identified in group C (30°C control). The reason for this result may be that the protein expression levels of the 77 DEPs in group C were too low for MS detection. Therefore, we compared this result with the results obtained by iTRAQ proteomic analysis. We found that 12 of the 77 DEPs were identified by the iTRAQ proteomic approach, and the relative quantitation ratio (T/C) was obtained for these proteins. The protein expression levels of the 12 DEPs were upregulated; details of the 12 DEPs are as follows: phosphatidylinositol 4-kinase type II subunit alpha (ratio: 1.497), β-galactosidase (EC 3.2.1.23) (ratio: 2.131), cell wall protein (fragment) (ratio: 2.338), rhamnogalacturonate lyase A (ratio: 1.807), carboxypeptidase (EC 3.4.16.-) (ratio: 2.073), similar to An03g03490 (ratio: 1.776), peroxisomal membrane protein Pmp47 (ratio: 1.356), β-1,6-glucanase (ratio: 3.898), extracellular α-glucosidase (ratio: 2.09), similar to An14g02280 (ratio: 1.425), tripeptidyl peptidase A (ratio: 1.699), and integral membrane protein (ratio: 1.457). Because iTRAQ-based quantitative proteomic analysis has the advantages of sensitivity and reliability, we regarded iTRAQ proteomic analysis as a superior method for the purposes of this study.
We focused on the 77 DEPs because we considered that the protein expression levels of these DEPs had significant differences between groups T and C. Thus, we also performed bioinformatics analysis (GO) on the 77 DEPs. However, the cellular component (CC) and molecular function information for most of the proteins could not be obtained by GO due to a database limitation. Fifteen proteins were identified as intrinsic components of the membrane, based on the main CC enrichment results (Figure 3c).
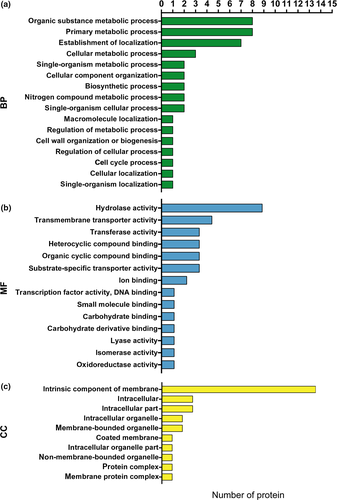
Fifteen molecular function enrichment terms were identified for 18 proteins (Table 3), and this was further supported by the metadata from the GO database. The following proteins were identified: nine with hydrolase activity, four involved in transmembrane transport, three with transferase activity, three involved in heterocyclic compound binding, three involved in organic cyclic compound binding, three with substrate-specific transporter activity, two involved in ion binding, and one associated with transcription factor activity, DNA binding, small molecule binding, carbohydrate-binding, carbohydrate derivative binding, lyase, isomerase, and oxidoreductase activities (Figure 3b).
| Protein name | Accession no. | Alternate ID |
|---|---|---|
| Cytochrome P450 61 | A0A100I288 | ABL_00141 |
| Endopolygalacturonases | A0A100I4L3 | ABL_00795 |
| Phosphatidylinositol 4-kinase type II subunit alpha | A0A100I5B9 | ABL_00995 |
| Beta-galactosidase (EC 3.2.1.23) | A0A100I7G1 | ABL_01506 |
| DUF803 domain membrane protein | A0A100I8A3 | ABL_01356 |
| Alpha-1,6-mannosyltransferase subunit | A0A100IB80 | ABL_02446 |
| Peptidyl-tRNA hydrolase 2 | A0A100IBB0 | ABL_02482 |
| Sugar transporter | A0A100ID32 | ABL_02908 |
| Alpha-1,6-mannosyltransferase subunit | A0A100IDU9 | ABL_03125 |
| C6 transcription factor | A0A100IKC9 | ABL_05017 |
| Nucleoside diphosphatase | A0A100IKH7 | ABL_05575 |
| Rhamnogalacturonate lyase A | A0A100IKQ4 | ABL_05670 |
| Carboxypeptidase (EC 3.4.16.-) | A0A100ILU3 | ABL_06225 |
| Secreted lipase | A0A100IN59 | ABL_06681 |
| Uncharacterized protein | A0A100IP18 | ABL_07404 |
| Extracellular serine carboxypeptidase | A0A100IPA5 | ABL_07541 |
| Glycosyl hydrolase family 43 protein | A0A100IQ58 | ABL_07746 |
| 1-(5-phosphoribosyl)-5-[(5-phosphoribosylamino)methylideneamino] imidazole-4-carboxamide isomerase (EC 5.3.1.16) (5-proFAR isomerase) (Phosphoribosylformimino-5-aminoimidazole carboxamide ribotide isomerase) | A0A100IQ93 | ABL_08050 |
Note
- Protein names, accession numbers, and alternate ID are from the Uniprot database. The alternate ID column represents the ID of the protein-coding genes.
3.5 Verification by parallel reaction monitoring
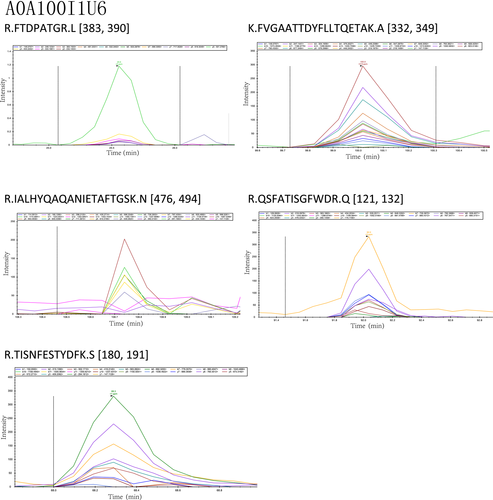
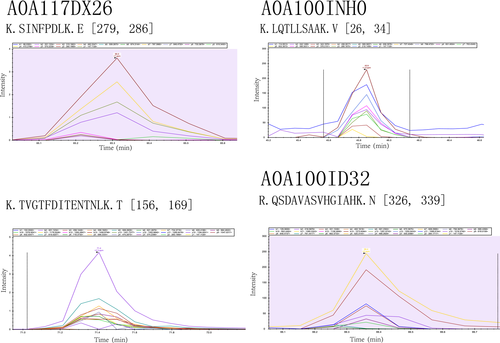
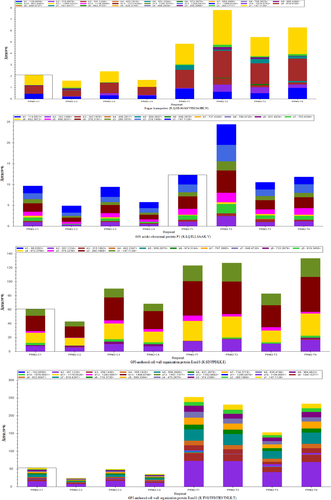
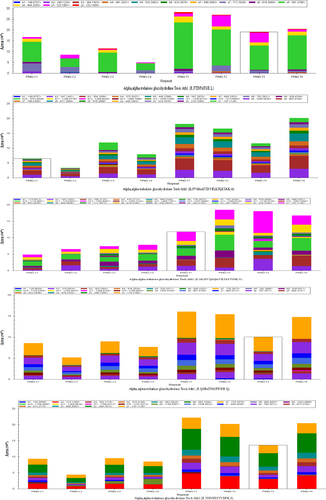
The peptide abundance values of the nine peptides belonging to the selected four proteins were obtained. Analysis results using the Skyline software are shown in Figures A3 and A4. The retention time and intensity of each fragment ion corresponding to the candidate peptides of the four selected proteins are shown in Figures A1 and A2. The results of the PRM analysis indicated that the relative protein expression levels of the selected four proteins were upregulated (Table 4). Compared with the results of proteomic analysis (iTRAQ and label-free), the relative protein expression levels of the four proteins had the same trends. Therefore, the PRM data further validated the reliability of the proteomic analysis results.
| Protein name | Ratio (T/C) | Peptide | p-Value |
|---|---|---|---|
| Source: iTRAQ proteomic analysis | |||
| Alpha, alpha-trehalose glucohydrolase TreA/Ath1 | 2.2 | R.FTDPATGR.L | .0056 |
| K.FVGAATTDYFLLTQETAK.A | .0112 | ||
| R.IALHYQAQANIETAFTGSK.N | .0098 | ||
| R.QSFATISGFWDR.Q | .0071 | ||
| R.TISNFESTYDFK.S | .0025 | ||
| GPI-anchored cell wall organization protein Ecm33 | 3.5 | K.SINFPDLK.E | .0145 |
| K.TVGTFDITENTNLK.T | .0003 | ||
| 60S acidic ribosomal protein P1 | 1.6 | K.LQTLLSAAK.V | .0782 |
| Source: label-free proteomic analysis | |||
| Sugar transporter | 3.1 | R.QSDAVASVHGIAHK.N | .0008 |
Note
- Ratio (T/C) indicates the peak area ratio of the candidate peptides of each protein.
4 DISCUSSION
4.1 Functional enrichment analyses
The mechanism of HSR in A. nigerhas not yet been fully described. Previous studies have successfully demonstrated the important role of HSPs and ROS-scavenging proteins under heat stress at 45°C in A. niger (Abrashev et al., 2014). However, the HSR mechanism is complex, and additional proteins are involved in the response process. The heat stress temperature of 50°C used in the present study was higher than that of the temperature used in previous studies. In addition to HSPs and ROS-scavenging proteins, we provided a comprehensive bioinformatic data analysis on the proteins associated with HSR in A. niger 3.316. The results of the bioinformatic analyses are useful for exploring the underlying molecular function of DEPs.
Depending on the protein-specific ratio, the proteins identified in the present study may be closely related to the HSR process in A. niger 3.316. The molecular functions of these proteins in other fungal cells have been reported. Thus, we concluded that they have the same or similar function in A. niger 3.316. The most highly upregulated protein of the GO terms is GPI-anchored cell wall organization protein Ecm33, which is localized on the cell surface. The cell walls of the fungi are comprised of three major polysaccharides, namely chitins, glucans, and mannoproteins (Klis, Mol, Hellingwerf, & Brul, 2002; Molina, Gil, Pla, & Arroyo, 2000). Approximately 40% (dry weight) of the cell wall is composed of mannoproteins that serve as a filling material embedded in the chitin and glucan structural network (Pardo et al., 2004). GPI-anchored cell wall organization protein Ecm33 is vital for appropriate fungal cell wall ultrastructure organization and correct assembly of the mannoprotein outer layer (Pardo et al., 2004). The deletion of the gene encoding this protein can result in a weakened cell wall (Pardo et al., 2004). The main role of alpha, alpha-trehalose glucohydrolase TreA/Ath1 is to catalyze trehalose hydrolysis; trehalose has previously been identified in A. niger (Svanstrom, Leeuwen, Dijksterhuis, & Melin, 2014). The function of trehalose is mainly the prevention of oxidative damage to cells (Pereira, Panek, & Eleutherio, 2003; Singer & Lindquist, 1998). Trehalose is a fungal carbohydrate, and trehalose oxidation has been shown to provide energy for the cells (Novodvorska et al., 2016). Moreover, 60S acidic ribosomal protein P1 is part of the 60S subunit of the fungal ribosome (Wahl & Moller, 2002). A previous study in Saccharomyces cerevisiae demonstrated that the deletion of this ribosomal protein affected the activity of yeast ribosomes and altered the selectivity of ribosomes to specific mRNAs (Remacha et al., 1995). Replication factor C subunit 5 (Rfc5) acts as a DNA replication factor in fungi (Sugimoto et al., 1996). Deletion of Rfc5 induces mitosis in yeast cells at certain temperatures, with unevenly separated and fragmented chromosomes (Sugimoto et al., 1996). Based on previous reports, disulfide isomerase is important for protein folding in the endoplasmic reticulum, where it catalyzes the formation and breakage of disulfide bonds in proteins (Wilkinson & Gilbert, 2004). Disulfide bonds stabilize proteins, and their formation is considered the rate-limiting step in the majority of protein folding processes (Darby, Morin, Talbo, & Creighton, 1995). Moreover, previous studies have demonstrated that the C6 zinc finger domain protein significantly influences the regulation of genes involved in the production of secondary metabolites and the utilization of carbon and nitrogen as substrates (Chang & Ehrlich, 2013). The protein levels of cell division control protein 42 (Cdc42) are regulated by exocytosis and endocytosis (Estravis, Rincon, Portales, & Perez, 2017). This protein is a guanosine triphosphatase (GTPase) involved in the polarization of fungal cells (Estravis et al., 2017). A major consequence of heat stress is the increase in the levels of HSPs. For example, the Hsp70 chaperone protein interacts with partially folded proteins and extended peptide segments to optimize the folding process, regulate protein activity, and prevent aggregation (Mashaghi et al., 2016).
In summary, the information derived from the GO functional enrichment analysis helped us to infer the underlying molecular function of proteins in A. niger 3.316 and to aid the understanding of the mechanism of the HSR process.
4.2 KEGG pathway analyses
The results of the KEGG pathway enrichment analysis can be used to further explore HSR in A. niger 3.316. Most DEPs (Figure 4) were significantly enriched in metabolic pathways, which may illustrate the obvious distinction between the T and the C groups. In addition, the data demonstrated that metabolites in A. niger 3.316 cells were dramatically altered under heat stress. Furthermore, it is well known that fungi can alter their respiratory pathways during evolution to adapt to new environmental conditions, resulting in different levels of oxidative phosphorylation (Marcet-Houben, Marceddu, & Gabaldon, 2009). The TCA cycle is a crucial component of respiratory metabolism in both mammalian and fungal cells (Cavalcanti et al., 2014). Thus, under heat stress conditions, oxidative phosphorylation and the TCA cycle increase to maintain cellular energy homeostasis in A. niger 3.316. In addition, iron (III) porphyrin is involved in the synthesis of catalase (Garcia, Lee, Blasko, & Bruice, 1991). Porphyrin and chlorophyll metabolism directly affect the scavenging of heat-induced ROS. Moreover, pyruvate is essential for the fungal defense against heat stress and is involved inROS scavenging (Zhang et al., 2017). Therefore, pyruvate metabolism is an important part of the HSR mechanism of A. niger 3.316.
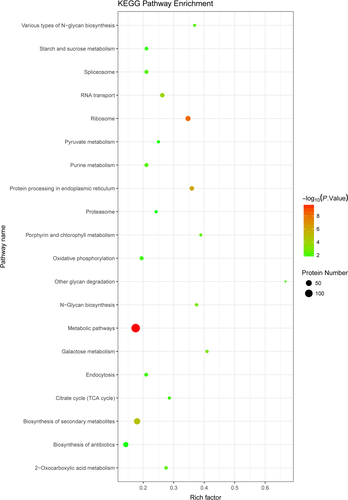
The KEGG pathway enrichment data provide a guide for further evaluation of protein interactions and functions. However, additional investigation is required regarding the association between HSR and changes in A. niger 3.316 metabolites.
4.3 Bioinformatic analysis of label-free proteomic data
The GO enrichment results for the 77 DEPs provided an improved understanding of the proteome differences between groups T and C. Although only a small fraction of the 77 DEPs was identified by GO enrichment analysis, the available molecular function information (Table 3) could be used to further understand the HSR mechanism of A. niger 3.316. Fifteen DEPs were identified as intrinsic components of the membrane by GO. This is the main difference between group T and C samples identified by GO. The 15 proteins may be involved in heat stress signal transduction in A. niger 3.316. Furthermore, GO analysis and the results of the iTRAQ proteomic analysis can be combined to more fully describe the differences between groups T and C.
In conclusion, an iTRAQ proteomic approach was applied to compare the proteome changes between group T samples (50°C stress) and group C samples (30°C control), and the observations were further verified using a PRM approach. The results are useful for the understanding of the proteome differences between the two sets of samples. In addition, the label-free proteomic analysis provided an additional explanation of the differences between groups T and C. Bioinformatic analysis, combined with the proteomics data, significantly enhances our understanding of the HSR mechanism of A. niger. In particular, the bioinformatic analysis suggested distinct metabolic patterns between group T samples and group C samples under heat stress conditions, which can aid subsequent metabolomics studies. Further metabolomics studies are needed to investigate detailed metabolite changes to confirm the HSR mechanism of A. niger.
ACKNOWLEDGMENTS
This research was supported by the National Natural Science Foundation of China (project codes 31470542 and 31570374) and the Natural Science Foundation of Hebei Province, P. R. China (project codes C2014407059 and 2015407059).
CONFLICT OF INTEREST
None declared.
AUTHOR CONTRIBUTION
Xiangyu Deng: conceptualization, data curation, formal analysis, investigation, methodology, project administration, resources, software, supervision, validation, writing-original draft, writing-review and editing. Bin Du: conceptualization, investigation, project administration, resources, supervision. Fengmei Zhu: conceptualization, investigation, project administration, resources, supervision. Yanan Gao: investigation, resources, software, supervision, validation. Jun Li: conceptualization, funding acquisition, investigation, project administration, resources, supervision.
ETHICS STATEMENT
None required.
APPENDIX 1
| Protein name | Accession no. | p-Value | Ratio |
|---|---|---|---|
| 60S ribosomal protein L6 | A0A100II13 | 1.78E−05 | 0.562 |
| Cytidylyltransferase | A0A100IA25 | .0019 | 0.725 |
| Cdc48-dependent protein degradation adaptor protein | A0A100IMV1 | .0006 | 0.482 |
| tRNA(M5U54) methyltransferase | A0A124BY30 | .00084 | 0.708 |
| cAMP-dependent protein kinase regulatory subunit | A0A117E2A2 | .0038 | 0.759 |
| Eukaryotic translation initiation factor 3 subunit A | A0A117DUM5 | .00065 | 0.668 |
| S-(hydroxymethyl) glutathione dehydrogenase | A0A100IUU9 | .0199 | 0.745 |
| Serine/threonine-protein phosphatase | A0A117DY47 | .00058 | 0.756 |
| Casein kinase II subunit beta | A0A100I9Q1 | .0067 | 0.562 |
| Alpha, alpha-trehalose-phosphate synthase | A0A100IQ14 | .00019 | 0.684 |
| Serine proteinase | A0A100IE06 | .0122 | 0.766 |
| Heat shock protein | A0A100IN38 | .00029 | 0.683 |
| Regulator of G protein signaling domain protein | A0A124BY58 | .025 | 0.724 |
| Proteasome maturation factor Ump1 | A0A100IKA7 | .0076 | 0.633 |
| Cell division cycle protein 48 | A0A124BW77 | .00036 | 0.704 |
| YagE family protein | A0A100I816 | .0378 | 0.643 |
| Nucleoside diphosphate kinase | A0A100IMC3 | .005 | 0.758 |
| Rho GDP-dissociation inhibitor | A0A100INZ0 | .000308 | 0.569 |
| Coproporphyrinogen III oxidase | A0A100ICH3 | .0047 | 0.584 |
| Serine palmitoyltransferase 2 | A0A124BY35 | .0013 | 0.641 |
| Actin-related protein 2/3 complex subunit 1A | A0A117E328 | .00296 | 0.747 |
| Snf1 kinase complex beta-subunit Gal83 | A0A117DZG7 | .00041 | 0.710 |
| Glutaredoxin | A0A100IHH4 | .0022 | 0.753 |
| Flap endonuclease 1 | A0A100IPI4 | 7.36E−05 | 0.589 |
| RNA annealing protein Yra1 | A0A124BXK7 | .000317 | 0.399 |
| Genome maintenance protein MGM101 | A0A117E2B3 | .0065 | 0.739 |
| Translocation protein | A0A100ILT5 | .0034 | 0.643 |
| Presequence translocase-associated motor subunit Pam17 | A0A100I369 | .0214 | 0.711 |
| Prefoldin subunit 6 | A0A100IKZ0 | .0067 | 0.719 |
| Tubulin-specific chaperone Rbl2 | A0A124BZ06 | 2.51E−05 | 0.640 |
| Nascent polypeptide-associated complex subunit alpha | A0A124BX09 | 2.31E−05 | 0.613 |
| 60S acidic ribosomal protein P2 | A0A100IL88 | .00028 | 0.543 |
| Regulatory protein SUAPRGA1 | A0A100IKZ5 | .00049 | 0.722 |
| Flocculation suppression protein | A0A100IKV5 | .0087 | 0.747 |
| RNA polymerase II Elongator subunit | A0A100IH59 | .00094 | 0.474 |
| 40S ribosomal protein S2 | A0A100ISE5 | .0027 | 0.603 |
| Retrograde regulation protein 2 | A0A100IIV8 | .036 | 0.577 |
| C6 finger domain protein | A0A124BV29 | .0356 | 0.752 |
| 40S ribosomal protein S28 | A0A117E3C1 | .0007 | 0.518 |
| Transcription elongation factor S-II | A0A117E2R0 | .0048 | 0.668 |
| Hsp90 co-chaperone Cdc37 | A0A100IBI0 | 4.71E−05 | 0.735 |
Note
- The protein name, alternate ID and accession number were from the Uniprot database. The ratio of the column indicated the ratio of the protein quantitative results in the T and C groups.
| Pathway name | ID | Number of DEPs | Background number | p Value |
|---|---|---|---|---|
| Metabolic pathways | ang01100 | 137 | 782 | 1.16E−10 |
| Ribosome | ang03010 | 34 | 98 | 5.52E−09 |
| Protein processing in endoplasmic reticulum | ang04141 | 23 | 64 | 9.86E−07 |
| Biosynthesis of secondary metabolites | ang01110 | 59 | 328 | 1.55E−05 |
| RNA transport | ang03013 | 21 | 80 | .00014 |
| Galactose metabolism | ang00052 | 9 | 22 | .00099 |
| N-Glycan biosynthesis | ang00510 | 9 | 24 | .00162 |
| 2-Oxocarboxylic acid metabolism | ang01210 | 11 | 40 | .00395 |
| Porphyrin and chlorophyll metabolism | ang00860 | 7 | 18 | .00451 |
| Various types of N-glycan biosynthesis | ang00513 | 7 | 19 | .00572 |
| Purine metabolism | ang00230 | 16 | 76 | .00576 |
| Spliceosome | ang03040 | 16 | 76 | .00576 |
| Other glycan degradation | ang00511 | 4 | 6 | .00794 |
| Citrate cycle (TCA cycle) | ang00020 | 8 | 28 | .01101 |
| Endocytosis | ang04144 | 13 | 62 | .01247 |
| Oxidative phosphorylation | ang00190 | 15 | 77 | .01323 |
| Starch and sucrose metabolism | ang00500 | 12 | 57 | .01561 |
| Pyruvate metabolism | ang00620 | 8 | 32 | .02054 |
| Biosynthesis of antibiotics | ang01130 | 34 | 238 | .02121 |
| Proteasome | ang03050 | 8 | 33 | .02363 |
Note
- The number of DEPs column indicates the number of differentially expressed proteins enriched in this KEGG pathway. The background number column indicates the total number of proteins involved in this KEGG pathway under heat stress conditions. The ID from the KEGG database.
- Abbreviation: TCA, tricarboxylic acidcycle.
| Protein name | Accession no. | Alternate ID | MF result |
|---|---|---|---|
| Cytochrome P450 61 | A0A100I288 | ABL_00141 | Yes |
| WD domain protein | A0A100I2Y8 | ABL_00329 | |
| Similar to An01g06420 | A0A100I370 | ABL_00399 | |
| Caffeine-induced death protein Cid2 | A0A100I3D3 | ABL_00452 | |
| Endopolygalacturonases | A0A100I4L3 | ABL_00795 | Yes |
| Uncharacterized protein | A0A100I4U1 | ABL_00859 | |
| Phosphatidylinositol 4-kinase type II subunit alpha | A0A100I5B9 | ABL_00995 | Yes |
| Beta-galactosidase (EC 3.2.1.23) | A0A100I7G1 | ABL_01506 | Yes |
| DUF803 domain membrane protein | A0A100I8A3 | ABL_01356 | Yes |
| Uncharacterized protein | A0A100I8J8 | ABL_01790 | |
| Cell wall protein (Fragment) | A0A100I9B8 | ABL_02002 | |
| Centromere/kinetochore protein Zw10 | A0A100IA46 | ABL_02155 | |
| PAP2 domain protein | A0A100IAM1 | ABL_02302 | |
| Alpha-1,6-mannosyltransferase subunit | A0A100IB80 | ABL_02446 | Yes |
| Peptidyl-tRNA hydrolase 2 | A0A100IBB0 | ABL_02482 | Yes |
| Sugar transporter | A0A100ID32 | ABL_02908 | Yes |
| Nuclear protein Qri2/Nse4 | A0A100IDU0 | ABL_03131 | |
| Alpha-1,6-mannosyltransferase subunit | A0A100IDU9 | ABL_03125 | Yes |
| Integral membrane protein | A0A100IEK7 | ABL_03129 | |
| Uncharacterized protein | A0A100IJJ7 | ABL_05078 | |
| C6 transcription factor | A0A100IKC9 | ABL_05017 | Yes |
| Nucleoside diphosphatase | A0A100IKH7 | ABL_05575 | Yes |
| Rhamnogalacturonate lyase A | A0A100IKQ4 | ABL_05670 | Yes |
| Carboxypeptidase (EC 3.4.16.-) | A0A100ILU3 | ABL_06225 | Yes |
| Similar to An03g03490 | A0A100IMQ8 | ABL_06732 | |
| Peroxisomal membrane protein Pmp47 | A0A100IN48 | ABL_06577 | |
| Secreted lipase | A0A100IN59 | ABL_06681 | Yes |
| Mannosylphosphorylation protein | A0A100IN87 | ABL_06986 | |
| Transcription factor SipA3 | A0A100IN99 | ABL_07015 | |
| Uncharacterized protein | A0A100IND5 | ABL_07044 | |
| OPT oligopeptide transporter | A0A100INQ3 | ABL_07205 | |
| Similar to An11g09480 | A0A100INV3 | ABL_07314 | |
| Uncharacterized protein | A0A100IP18 | ABL_07404 | Yes |
| Heat shock Hsp30-like protein | A0A100IP71 | ABL_07177 | |
| Similar to An12g06000 | A0A100IPA0 | ABL_07538 | |
| Extracelular serine carboxypeptidase | A0A100IPA5 | ABL_07541 | Yes |
| Glycosyl hydrolase family 43 protein | A0A100IQ58 | ABL_07746 | Yes |
| 1-(5-phosphoribosyl)-5-[(5-phosphoribosylamino) methylideneamino] imidazole-4-carboxamide isomerase (EC 5.3.1.16) (5-proFAR isomerase) (Phosphoribosylformimino-5-aminoimidazole carboxamide ribotide isomerase) | A0A100IQ93 | ABL_08050 | Yes |
| Short chain dehydrogenase | A0A100IR96 | ABL_08376 | |
| RING finger ubiquitin ligase | A0A100IRE2 | ABL_08603 | |
| Similar to An13g01520 | A0A100IT82 | ABL_09548 | |
| Uncharacterized protein | A0A100ITC5 | ABL_09626 | |
| Carboxypeptidase Y | A0A100ITF4 | ABL_09655 | |
| Transmembrane 9 superfamily member | A0A100IU63 | ABL_10030 | |
| Uncharacterized protein | A0A100IUC6 | ABL_10167 | |
| Alpha-amylase | A0A100IUD4 | ABL_10224 | |
| GPI-anchor biosynthesis protein | A0A100IUI8 | ABL_10265 | |
| Amine oxidase (EC 1.4.3.-) | A0A100IUL5 | ABL_10344 | |
| ATP synthase subunit alpha | A0A100IUM3 | ABL_10325 | |
| Uncharacterized protein | A0A117DUN0 | ABL_00268 | |
| Isoamyl alcohol oxidase | A0A117DVP7 | ABL_01121 | |
| Beta-1,6-glucanase | A0A117DVW2 | ABL_01196 | |
| PHD finger domain protein | A0A117DWI9 | ABL_01711 | |
| Proteasome subunit beta type (EC 3.4.25.1) | A0A117DX69 | ABL_02137 | |
| Extracellular alpha-glucosidase | A0A117DZ97 | ABL_02512 | |
| Signal peptide peptidase | A0A117DZD7 | ABL_03839 | |
| MBOAT family protein | A0A117DZK1 | ABL_04003 | |
| Similar to An14g02280 | A0A117E0S6 | ABL_05581 | |
| Copper-transporting ATPase | A0A117E0X3 | ABL_05808 | |
| Extracellular cellulase CelA/allergen Asp F7-like | A0A117E1I3 | ABL_06779 | |
| Allantoin permease | A0A117E1L5 | ABL_06889 | |
| Xyloglucan-specific endo-beta-1,4-glucanase A | A0A117E1L6 | ABL_06886 | |
| Tripeptidyl peptidase A | A0A117E271 | ABL_07771 | |
| alpha-1,2-Mannosidase (EC 3.2.1.-) | A0A117E298 | ABL_07876 | |
| Integral membrane protein | A0A117E3L3 | ABL_09106 | |
| Amidohydrolase 2 | A0A117E3M4 | ABL_10004 | |
| Similar to An12g10400 | A0A117E4P7 | ABL_10097 | |
| Uncharacterized protein | A0A124BUQ6 | ABL_00297 | |
| Mitochondrial carrier protein | A0A124BV04 | ABL_00775 | |
| Phosphatidate cytidylyltransferase (EC 2.7.7.41) | A0A124BWC1 | ABL_02796 | |
| Similar to An15g07560 | A0A124BWS8 | ABL_03489 | |
| Cell wall protein PhiA | A0A124BXN4 | ABL_05613 | |
| SNARE domain protein | A0A124BXX7 | ABL_06434 | |
| Similar to An03g04840 | A0A124BY20 | ABL_06829 | |
| Carboxylic ester hydrolase (EC 3.1.1.-) | A0A124BYN7 | ABL_08774 | |
| Carboxylic ester hydrolase (EC 3.1.1.-) | A0A124BYX3 | ABL_09572 | |
| Phospholipase C PLC-C | A0A124BYX9 | ABL_09584 |
Note
- The protein name, accession number and alternate ID were from the Uniprot database. The MF column indicated the proteins that acquired molecular function information. The alternate ID column represents the ID of the protein-codinggenes.
Open Research
DATA AVAILABILITY STATEMENT
The dataset generated and analyzed during the current study is available in the Zenodo repository at http://doi.org/10.5281/zenodo.3608375 (Table S1: KEGG pathway enrichment).


