Determination of heat transfer coefficients in wood-based panel finishing
Bestimmung der Wärmeübergangskoeffizienten in der Veredelung von Holzwerkstoffplatten
Abstract
enWood-based panels such as fiberboard, have become indispensable materials in everyday life - from furniture to outdoor paneling. Despite the widespread use of Industry 4.0 methods across all industry sectors, their application in the wood-based panel sector has been very limited so far. This study highlights the untapped potential of Industry 4.0 in the wood-based panel sector by using digital methods to improve finishing of wood-based panels with resin-impregnated papers in a short-cycle hot press by thermal modelling. For an accurate temperature estimation, precise heat transfer coefficients are of great importance. Currently, no data for these heat transfer coefficients are available in literature. We used experimental data in combination with a digital thermal model to determine the heat transfer coefficients of the system by using an optimization algorithm. In this work, we describe the experimental setup used, the extensive measurement campaigns conducted and how the digital model was validated and adjusted to allow the optimization algorithm to produce accurate estimations of the system′s heat transfer coefficients. In conclusion, our study underscores the potential of Industry 4.0 methodologies in the underrepresented field of wood-based panel manufacturing by utilizing a combination of experimental and modern digital methods.
Translation abstract
deHolzwerkstoffplatten wie zum Beispiel Faserplatten sind aus dem Alltag nicht mehr wegzudenken - vom Möbelbau bis zu Außenverkleidungen. Trotz des weit verbreiteten Einsatzes von Industrie 4.0-Methoden in anderen Industriezweigen ist deren Anwendung im Bereich der Holzwerkstoffproduktion bisher sehr beschränkt. Diese Studie zeigt das ungenutzte Potential von Industrie 4.0 im Holzwerkstoffsektor auf, indem sie digitale Methoden wie thermische Modellierung zur Verbesserung des Kurztaktveredelungsprozesses mit harzimprägnierten Papieren verfolgt. Für eine genaue Temperaturvorhersage sind möglichst exakte Wärmeübergangskoeffizienten wichtig. Derzeit sind diese allerdings nirgends in der Literatur verfügbar. Wir verwenden experimentelle Daten in Kombination mit einem digitalen thermischen Modell, um die Wärmeübergangskoeffizienten des Systems mithilfe eines Optimierungsalgorithmus zu bestimmen. In diesem Beitrag beschreiben wir den verwendeten Versuchsaufbau, die durchgeführten Messkampagnen und wie das digitale Modell validiert und angepasst wurde, um möglichst genaue Schätzungen des Optimierungsalgorithmus zu ermöglichen. Zusammenfassend unterstreicht unsere Studie das Potenzial von Industrie 4.0-Methoden in dem bislang unterrepräsentierten Bereich der Holzwerkstoffherstellung durch die Kombination von experimentellen und modernen digitalen Methoden.
1 Introduction
The United Nations food and agriculture organization has official numbers saying that globally 527 million cubic meters of wood-based panels were produced in 2022 1. Many of these wood-based panels undergo finishing processes in short-cycle presses, involving the application of veneers or resin-impregnated papers to the panel surface 2. While there are no definitive numbers to be found, with over 1 billion m2 of resin-impregnated papers used in production in 2016 alone, it can be assumed that a large number of these presses are currently employed in this way 2. This means that a small increase in resource or energy efficiency in the wood-based panel finishing process might lead to noticeable improvements for the industry sector as a whole. In order to save energy in wood-based panel production and finishing, the pressing time should be reduced as much as possible, without compromising product quality 3.
We propose the use of modern digital methods related to the so called fourth industrial revolution to achieve a higher resource and energy efficiency in wood-based panel finishing 4.
The determining parameters of the finishing process of wood-based panels in short-cycle presses are machine contact pressure, heating temperature of the top and bottom heating platens, pressing time per panel and the material parameters of the panel and impregnated paper. It is hypothesized by industrial experts that the most common product defects like blowholes, warping of panels and surface fissures are caused by the thermal conditions within the press, making temperature predictions important for increased production efficiency 2.
Fortunately, production temperature is a significant factor in final product properties and quality across industrial manufacturing processes, from metallurgy and additive manufacturing to wood-based panel production 5-7. A large amount of research has already been done on methods for its prediction and can now be employed in the area of wood-based panel finishing 8-11.
While temperature is a physical property that can be measured directly and with relative ease, the placement of sensors is often not possible in already established machinery, in harsh operating conditions or inaccessible areas 5. Here, so called soft or virtual sensors can provide an alternative. These ‘sensors’ are mathematical, digital models providing temperature estimations based on physics, empirical knowledge and historical or live data 12.
However, the prediction of temperature in wood-based materials based only on the basics of heat transfer remains challenging, not least because many crucial simulations input parameters cannot be determined easily 13.
In the context of predicting process temperatures, the accuracy of the thermophysical material properties like heat capacity, thermal conductivity and heat transfer coefficients is crucial for an accurate simulation 14, 15.
The thermal state of a production process is – among other properties – defined by heat transfer coefficients of the various production components in interaction with each other and the environment. Heat transfer coefficients are defined at the boundaries of two components and are almost impossible to determine with theory alone 5, 14. Note that we are using the term ‘heat transfer coefficient’ for both solid-fluid as well as solid-solid transitions, Table 1.
Heat transfer coefficient |
Component 1 |
Component 2 |
Press status |
|---|---|---|---|
|
wood-based panel → |
ambient air |
open |
|
press surface → |
ambient air |
open |
|
wood-based panel → |
press surface |
open |
|
press (internal) → |
heating platen |
open |
|
wood-based panel → |
press surface |
closed |
|
press (internal) → |
heating platen |
closed |
Their values depend on many factors, such as temperature, pressure, contact time, contact surface texture and profile, surface roughness, surface hardness, contact geometry and - in fluid-solid contacts - flow conditions 16.
Due to this highly specific nature of heat transfer coefficients, they cannot be found in literature for new or under-explored production processes. This makes accurate thermal modeling for these processes very difficult.
While it is impossible to find useful heat transfer coefficients for wood-based panel finishing in short-cycle presses in literature, we can estimate them ourselves with the help of experimental data. To this end, we developed an experimental setup for temperature measurements in a laboratory size press and a thermal model of the short-cycle press, giving us the data, we need to estimate heat transfer coefficients with the help of the model.
In this paper we will introduce both the experimental setup and the thermal model. We will detail the non-linear optimization algorithms used for parameter estimation and present the results. The paper will conclude with a summary of our findings and their implications and give an outlook over the next steps to be taken.
2 Materials and methods
2.1 Laboratory press
The laboratory sized hydraulic piston press located at our industrial partner′s facilities is routinely used for test-pressing but has not been used in experiments for temperature measurements before. It is a much smaller version of the production press with a surface area of roughly 0.5 m x 0.5 m, making handling of the used wood-based panels and access to individual parts of the machinery far easier than in a full-scale press.
The press is comprised of several layers, Figure 1. Heating platens supply heat at the top and bottom. The platens are in direct contact with the press (which also has an internal structure of components that is of no further interest to this paper). Wood-based panels and resin-impregnated papers are put into the press manually and pressed with given settings of heating platen temperatures, pressing force and pressing time. After pressing, the panels need to be removed manually.
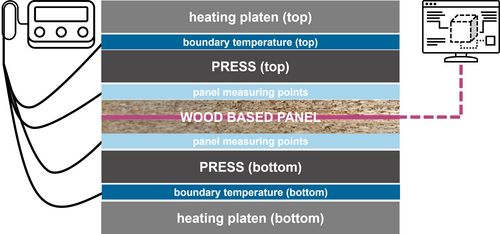
Figure 1. Schematic overview of a wood-based panel being pressed (closed status). Panel measuring points in light blue indicate the location of thermocouples for panel surface temperature measurements. The two dark blue bars indicate the location of the thermocouples for boundary condition temperatures. Temperatures within the wood-based panel can only be accessed by simulation, as indicated by the pink lines.
Bild 1. Schematische Darstellung einer Holzwerkstoffplatte beim Pressen (geschlossener Zustand). Hellblaue Messpunkte der Platte zeigen die Position der Thermoelemente für die Messung der Plattenoberflächentemperatur an. Die beiden dunkelblauen Balken zeigen die Position der Thermoelemente für die Randbedingungstemperaturen an. Die Temperaturen innerhalb der Holzwerkstoffplatte können nur durch Simulation ermittelt werden, wie durch die rosa Linien angezeigt.
2.2 Experimental procedure
For temperature measurements within the laboratory press, we employed a setup of 16 type-K thermocouples. One thermocouple each was fixed to the center of the top and bottom heating platen. The temperatures of these thermocouples were used as boundary conditions for our simulation.
The remaining thermocouples were fixed to the wood-based panel′s top and bottom surfaces with thermoresistant tape, Figure 2. The pattern was chosen to reflect both the temperature in the center of the panel as well as in the corners. It has previously been shown in our experiments, that there is no lateral temperature distribution. Due to this, we utilized average temperatures for the panel surface top and bottom for our parameter estimations.
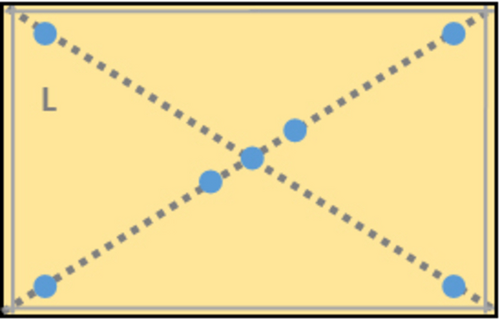
Figure 2. Pattern of thermocouples (blue dots) on the surface of wood-based panels used in our experiments.
Bild 2. Muster von Thermoelementen (blaue Punkte) auf der Oberfläche der in unseren Experimenten verwendeten Holzwerkstoffplatten.
In order to properly depict the real production process, the panels could only be pressed once, meaning the 14 thermocouples had to be removed and applied to a fresh panel after every single measurement.
To ensure similar conditions for all measurements, all wood-based panels were conditioned in a controlled climate chamber at 20.8 °C and 58 % relative humidity until shortly (at most 30 minutes) before pressing. For good heat transfer, heat conducting paste with a thermal conductivity of 12.5 W⋅m−1⋅K−1 was applied to all thermocouples.
For the 20 measurements featured in this work, the same heating temperatures, pressing times and pressing forces were used. These parameters were chosen to be representative of a typical pressing process in wood-based panel finishing with Texp = 190 °C – 210 °C, pexp = 280 N⋅cm−1 – 400 N⋅cm−1, texp = 18 s – 120 s, but cannot be disclosed in detail for reasons of confidentiality 2.
2.3 Model
To improve predicted temperatures in thermal models, a combination of first-principle modeling for well-known heat transfer phenomena (heat conduction, heat convection) with experimental data can be used to determine model parameters to improve future simulation outputs. This can be done by using non-linear optimization methods to determine boundary conditions or material parameters for the specific application from experimental measurements on a test stand 5.
as a function of time , position and a number of fixed parameters and variable parameters .
with absolute temperature T, time t, thermal conductivity λ, position x and heat flux from convective sources . The boundary conditions are generally added as fixed temperatures and , where is the measured temperature at the bottom heating platen, and is the temperature at the top heating platen, with the extension of the press in direction, in our case the height of the press.
with and the surface temperatures of adjacent component surfaces and the heat flux over the component transition. Initial guesses for the values of had to be estimated roughly with input from tabulated values 16, 17.
We introduced a total number of six heat transfer coefficients for all layer transitions in the open and closed press, Figure 3.
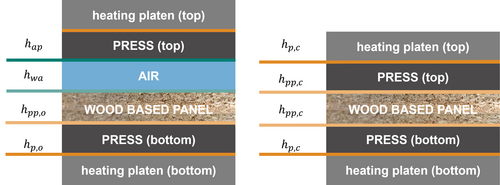
Figure 3. Visualization of the introduced heat transfer coefficients between all press layers in the open (left) and closed (right) press positions.
Bild 3. Visualisierung der eingeführten Wärmeübergangskoeffizienten zwischen allen Pressebenen in der geöffneten (links) und geschlossenen (rechts) Pressposition.
For the parameter estimation we employed both a gradient based (least squares) and simplex (Nelder-Mead) optimization algorithm. The objective functions and the corresponding non-linear optimization used were:
With residuals of variable parameters , measured temperatures and the sum function for the simplex formulation.
The described method was applied to 20 measurements in comparison with the simulation based on rough guesses for initial heat transfer coefficients and boundary conditions taken directly from each measurement. The parameter estimation had an ending condition if heat transfer coefficients changed per loop. We thus gained one set of six heat transfer coefficients for each measurement.
3 Results and discussions
The results of temperature predictions plotted directly against real measurement data, and the resulting error is depicted, Figure 4. Measurement data is depicted in green (dark green for the top surface of the wood-based panel, light green for the bottom surface), including error bars, since the average temperature of all sensors on the surface was used. The predicted temperatures are shown in blue (again dark blue for the top surface, light blue for the bottom surface). Simulated data also shows the temperature in the wood-based panel′s center, where no measurements can be done. The simulation results before the introduction of heat transfer coefficients deviate from the measurement data, Figure 4.
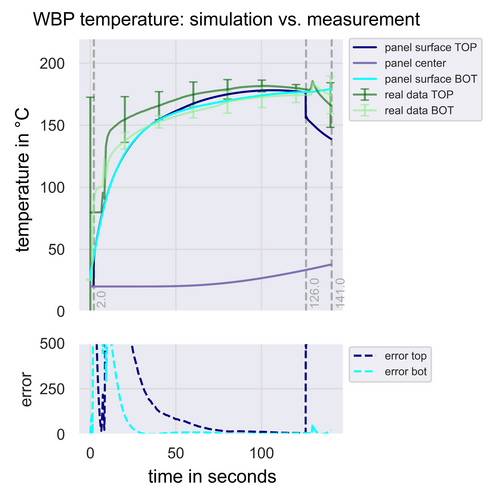
Figure 4. Visual comparison of averaged measured temperatures in green with predicted temperatures in blue. In this graph, no heat transfer coefficients have been introduced yet. On the bottom, the error between simulation and measurement is also depicted for the top and bottom temperatures.
Bild 4. Visueller Vergleich der gemittelten gemessenen Temperaturen in grün mit den vorhergesagten Temperaturen in blau. In dieser Grafik wurden noch keine Wärmeübergangskoeffizienten eingeführt. Unten ist außerdem der Fehler zwischen Simulation und Messung für die oberen und unteren Temperaturen dargestellt.
As described in our methods, we initially intended to use a least squares algorithm for the minimization, as it had worked well for the first few parameter estimations we attempted, and then compare results with the simplex based Nelder-Mead algorithm. However, when trying to apply the least squares formulation to all 20 measurements, we soon encountered difficulties: Often, the algorithm would not deviate from the initial guess, suggesting a local minimum and the gradient-based algorithms inability to “get out” of this minimum and find the desired global minima. The ODE-solver applied to solve the differential equation within our simulation also encountered problems of stiffness here.
So instead, we utilized a combination of the Nelder-Mead simplex algorithm with a weighted least squares algorithm, following other authors’ examples 18. For this, we first applied the Nelder-Mead algorithm, using a rather larger step size and larger break condition to determine the general area of the global minimum quickly. We then used these results of the Nelder-Mead algorithm as initial guess for the weighted least squares algorithm with a smaller step size and break condition. This yielded satisfactory performance and results for all 20 measurements we investigated.
For the set of 20 evaluated measurements with the same pressing parameters, we found the averaged heat transfer coefficients, Table 2, Figure 5. When considering the standard deviation and 95 % - confidence intervals, it is important to keep in mind that we are working with experimental data. Even though the experimental setup was designed with the utmost care, it is impossible to rule out certain systematic errors.
Heat transfer coefficient |
Average value in W⋅m−2K |
|
95 % CI |
|---|---|---|---|
|
360.89 |
305.78 |
220.78 – 496.32 |
|
62.19 |
33.03 |
47.07 – 76.86 |
|
9.58 |
39.71 |
-8.28 – 27.44 |
|
2.27 |
1.30 |
1.67 – 2.84 |
|
58.99 |
25.39 |
45.47 – 69.12 |
|
24.12 |
18.74 |
16.70 – 33.02 |
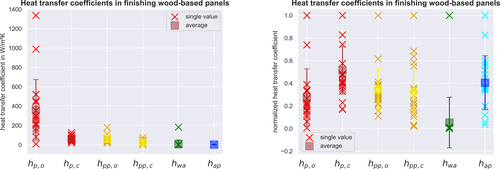
Figure 5. Values for all heat transfer coefficients of all measurements marked by X, averages as square boxes with standard-deviation error bars. (a) shows absolute values, (b) shows values normalized.
Bild 5. Werte für alle Wärmeübergangskoeffizienten aller mit X markierten Messungen, Durchschnittswerte als quadratische Kästchen mit Standardabweichungsfehlerbalken. (a) zeigt absolute Werte, (b) zeigt normalisierte Werte.
I n this instance we attribute every deviation between measurement and simulation data to only a change in heat transfer coefficients. This will not be completely accurate, meaning that other phenomena (like heat absorbed for chemical reactions within the wood-based panel) are also being thrown into the heat transfer coefficient estimation.
Given these caveats, the coefficients are of the expected magnitude. For example, literature values for heat transfer coefficients for free convection of gases range between 3 W⋅m−2⋅K−1 – 25 W⋅m−2⋅K−1, making our 95 % CI of [16.70 W⋅m−2⋅K−1, 33.02 W⋅m−2⋅K−1] for plausible for the heat transfer coefficient between the smooth press surface and the ambient air 16.
Results show the estimated heat transfer coefficients by transition in absolute and normalized values, Figure 4. Each X denotes one single value of the heat transfer coefficient for one of our 20 measurements used. The squares and error bars of the same color indicate the average of the 20 heat transfer coefficients found for the transition, Table 2.
For temperature predictions of our model, this means a much higher accuracy going forward. The predictions went from a large error for the complete simulation time window, to a very small error in the active pressing time in the interval, Figure 6. For the opening and closing of the press, the error is arguably better, but still very high. The reasons for this are most likely complex, linked to either modeling inaccuracies, inadequacies of the experimental setup or a combination of both. However, since the most heat in the process is transferred in the active pressing interval, and our predictions here are now accurate, it is prudent to say the model is useful in its current form.
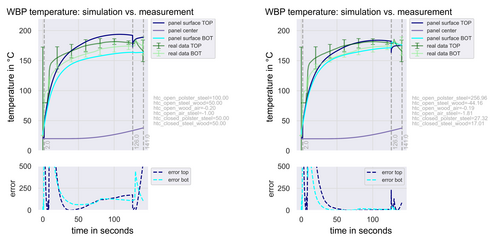
Figure 6. Comparison of predicted temperature for the initial guess of heat transfer coefficients (a) and the final estimation of heat transfer coefficients in (b), with the corresponding error functions below.
Bild 6. Vergleich der vorhergesagten Temperatur für die anfängliche Schätzung des Wärmeübertragungskoeffizienten in (a) und die endgültige Schätzung des Wärmeübertragungskoeffizienten in (b), mit den entsprechenden Fehlerfunktionen unten.
The determination of these heat transfer coefficients increases the accuracy of temperature predictions in our simulation, the benefit of which was extensively described in the introduction. It also deepens our understanding of thermal behavior and heat fluxes within the studied short-cycle press, bolstering the empirical knowledge of our industrial project partner with theoretical inputs. This understanding in turn can guide the optimization of the process, improving energy efficiency and production capacity.
Moreover, the publications of the heat transfer coefficients could help other researchers working on the accurate modeling of the finishing of wood-based panels without them needing to replicate our extensive measurement campaigns. This too can lead to improvements in the production of wood-based panels throughout the industry.
4 Conclusions and outlooks
In this paper, an approach to increase energy efficiency in the finishing of wood-based panels with resin-impregnated papers in a short-cycle press was introduced. The thermal model created for temperature predictions, the experimental setup of the laboratory press and the parameter estimation procedure to get accurate parameters for this process for the first time were described.
Squares optimization did not suit the problem, but were able to establish a combination of a simplex Nelder-Mead algorithm with a weighted least-squares algorithm in order to gain the best results.
With the method thus established, we will continue to apply it to a larger number of measurement data with varying process parameters (heating platen temperature, pressing force, pressing time) to gain an insight into their influence on the heat flux and thermal behavior of the press and wood-based panel. With enough accurate estimations it will be able to quantify this influence and extrapolate it for temperature predictions of our model depending on process parameters. With the recently obtained experimental data from a full-size production press, the method will be applied there and might be able to utilize it in comparison to the laboratory press results to work on a scale-up/scale-down of the thermal behavior of the differently sized presses.
Finally, we will continue to highlight the opportunities given by advanced digital methods in the wood-based panel industry, where publications on similar methodologies are limited at best and nonexistent for many subtopics.
Acknowledgements
This work was supported by the cooperative doctoral school NextGeneration Smart Industrial Concept! We particularly thank our industrial partners FunderMax GmbH and Kompetenzzentrum Holz GmbH, for enabling our analysis of their production process and supplying access to their laboratory facilities, as well as their technical input.
Conflict of Interests
The authors declare no financial or commercial conflict of interests.
Open Research
Data Availability Statement
Data sharing not applicable due to confidentiality agreements.


