Evaluation of acoustic changes in and the healing outcomes of rat eardrums with pars tensa and pars flaccida perforations
Yaoqian Liu and Cuiping Wu contributed equally to this study.
Funding information: National Natural Science Foundation of China, Grant/Award Numbers: 81770998, 82071040, 82071042; Natural Science Foundation of Shanghai, Grant/Award Number: 20ZR1442300
Abstract
Objectives
To systematically explore the differences in acoustic changes and healing outcomes of tympanic membranes (TMs) with pars flaccida perforation (PFP) and pars tensa perforation (PTP).
Methods
We created PFPs and PTPs of various sizes in Sprague–Dawley rats, and evaluated TM umbo velocity and hearing function using laser Doppler vibrometry and auditory brainstem response (ABR) measurement before and immediately after perforation. Two weeks later, hearing was reevaluated and TMs were investigated by immunohistochemical staining.
Results
Small PFPs and PTPs did not significantly affect umbo velocity and hearing function. Large PFPs increased umbo velocity loss at low frequency (1.5 kHz) and elevated ABR thresholds within 1–2 kHz. Large PTP caused significant velocity loss at low frequencies from 1.5 to 3.5 kHz and threshold elevations at full frequencies (1–2 kHz). Two weeks after the perforation, the hearing function of rats with healed PFPs recovered completely. However, high-frequency hearing loss (16–32 kHz) persisted in rats with healed PTPs. Morphological staining revealed that no increase in the thickness and obvious increase in collagen I level of regenerated par flaccida; regenerated pars tensa exhibited obvious increase in thickness and increased collagen I, while the collagen II regeneration was limited with discontinuous and disordered structure in regenerated pars tensa.
Conclusion
The hearing loss caused by large PFP limits at low frequencies while large PTP can lead to hearing loss at wide range frequencies. PFP and PTP have different functional outcomes after spontaneous healing, which is determined by the discrepant structure reconstruction and collagen regeneration.
1 INTRODUCTION
Tympanic membrane (TM) perforation is the common ear disease caused by ear trauma or otitis media.1-3 In TM perforation, the normal TM structure is destroyed and the mechanobiological characteristics are seriously affected, triggering changes in the vibrational responses to sound waves4-6 and wideband conductive hearing loss of variable severity.7, 8
The TM can be divided into the pars tensa (PT) and pars flaccida (PF). PF and PT structure and composition differ greatly. The PT is thinner and larger than the PF in humans and various other mammals.9 The main microstructural difference is seen in the middle lamina propria. The lamina propria of the PT is mainly composed of two crossed layers of compact collagen fibers. The orientation of the collagenous fibers significantly affected sound wave transmission and dissipation by reinforcing transversal vibrations and damping longitudinal displacements.10 Thus, the mistuned resonances average out, ensuring strong overall umbo vibration that provides good sound transmission into the middle-ear ossicles.11 Different from PT, the lamina propria in the PF is more dispersed, with loosely packed collagen bundles, vessels, nerve endings, and mast cells. Besides, the main PT fibers are composed of Type II collagen (CII), while those of the PF are Type I collagen (CI).11, 12 CII shapes and mechanically strengthens the TM; CI allows the tissue to resist force.12 The differences in microstructural and collagenous characteristics between the PT and PF suggest the diverse roles that they play in sound transmission.13 We hypothesized that pars tensa perforations (PTPs), which is associated with disordered fiber arrangement and CII functional impairment, might also be associated with lower TM vibrational output and acoustic transmission than pars flaccida perforations (PFPs).
TMs with PTPs exhibited decreases in TM velocity and hearing loss and this worsened as PTP size increased.4, 5, 7, 8, 14, 15 Most PTPs healed spontaneously, with recovery of acoustic transmission mainly seen at low rather than high frequencies.16, 17 However, the effects of PFPs on sound transmission and healing have rarely been reported and remained controversial. Here, we systematically explored the differences of TMs with PTPs and PFPs in acoustic changes and healing capacities. The effect of perforation size on acoustic transmission was also taken into account. The acoustic changes were measured via laser Doppler vibrometry (LDV) and auditory brainstem response (ABR) recording immediately after PTP and PFP. LDV measures the umbo velocity and thus yields quantitative information on eardrum vibrational output.11 ABR records auditory central response and is used to evaluate auditory function in response to auditory stimuli.18 Healing capacities including structural and functional recovery were determined by histological stains and ABR threshold evaluations performed 2 weeks later.
2 MATERIALS AND METHODS
2.1 Ethics statement
All procedures were approved by the Institutional Animal Care and Use Committee of Shanghai Sixth People's Hospital, affiliated with Shanghai Jiao Tong University (permit number: 2020-0285).
2.2 Animals
Healthy 9-week-old male Sprague–Dawley rats (Rattus norvegicus) were divided into two experimental groups: an ABR group (n = 43 ears) and an LDV group (n = 24 ears). Each group was then subdivided into small PTP, large PTP, small PFP, and large PFP subgroups. The rats were reared in a quiet, comfortable environment and only animals with transparent healthy TMs were included.
2.3 Surgery
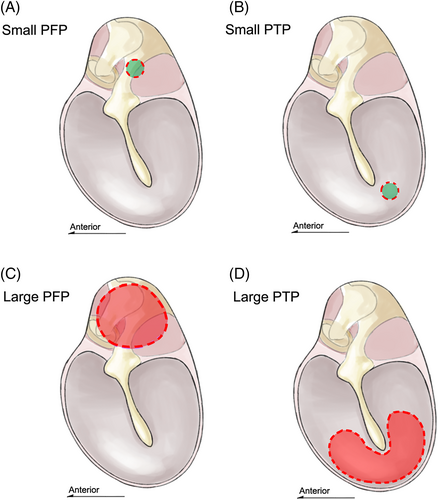
In the ABR group, the rats were anesthetized with 1% (wt/vol) sodium pentobarbital (50 mg/kg intraperitoneally [IP]) and we used a half-dose of 1% (wt/vol) sodium pentobarbital (25 mg/kg IP) to enhance anesthesia if initial anesthesia was inadequate, and 2% (wt/vol) xylazine (6.6 mg/kg IP) to induce muscle relaxation if cramps developed during surgery. LDV group rats were anesthetized and then sacrificed to obtain fresh temporal bones, which were soaked with saline to prevent desiccation of TM. Perforations were made referred to a similar study with a needle attached to a 1-ml syringe19 (Figure 1): small perforations (approximately 0.25 mm2 in area; 10% of the PF) in the PT or PF or large perforations (approximately 2.5 mm2 in area; ≥90% of the PF) in the PT or PF were created. We used a periodontal probe to measure the perforation diameter during surgery. We also measured lesion sizes on photographs using ImageJ software (ver. 1.8.0; National Institutes of Health).
2.4 Laser Doppler vibrometry
LDV (CLV-2534-4; Polytec) measurements were performed pre- and post-perforation. TMs exhibiting abnormal umbo vibrations before perforation were excluded. A function/arbitrary waveform generator (33210A, 10-MHz; Agilent Technologies) produced signals, which drove a speaker (MF1; Tucker–Davis Technologies) to produce sinusoidal pure tones at 1–10 kHz. Sound intensity was monitored at 80 dB using a microphone (ER-7C series B microphone system; Etymotic Research) with a probe tube close to the TM. A reflector (50-mm-diameter viscous polystyrene microbeads; 3M Innovation Center) was attached to the umbo of the malleus, and the temporal bone was fixed to ensure that the spatial angle between the laser beam and reflector beads was approximately 60°. The constant sound pressure magnitude [P(f)] was input into the input channel of the data acquisition board (sampling rate = 51.2 kHz; 24 bits, NI-9234; National Instruments). Umbo velocity data were collected via output channel and processed using an in-house LabVIEW program (written by Dr Liujie Ren, ENT Institute, Eye & ENT Hospital of Fudan University, Fudan, China). All measurements were repeated five times and mean velocity magnitudes [V(f)] were calculated. The umbo-velocity transfer function [H(f)] was then computed using the following equation: H(f) = V(f)/P(f).
2.5 Auditory brainstem responses
ABR thresholds were determined immediately pre- and post-perforation, and 2 weeks after perforation. TMs exhibiting abnormal ABR thresholds before perforation were excluded. A RZ6/BioSigRZ system (Tucker–Davis Technologies) was used to control the stimuli and monitor responses. A speaker (MF1; Tucker–Davis Technologies) was employed to generate tone-burst (TB) stimuli. The TB parameters were as described previously,20 that is, 10-ms duration and 0.5-ms rise/fall time presented at 21.1/s. The sounds were delivered through a coupler tip sealed to the ear canal. The resulting biological signals were recorded by a recording electrode system. The subdermal recording electrode was fixed at the vertex. The reference and grounding electrodes were placed posterior to the external auditory canal. The evoked responses were amplified 20-fold by the PA4 preamplifier (Tucker–Davis Technologies) and repeated 800 times. The stimuli decreased from 90 to 0 dB SPL in steps of 5 dB. The lowest stimulus that could evoke an ABR wave III, repeated three times, was defined as the ABR threshold. Tests were performed at 1, 2, 4, 8, 16, and 32 kHz.
2.6 Morphology
Rats were sacrificed following the ABR test 2 weeks after perforation. The TMs were dissected, preserved in 4% (vol/vol) paraformaldehyde, decalcified, dehydrated in alcohol gradient baths, fixed, embedded in paraffin, cut into 5-μm sections, and subjected to hematoxylin–eosin (HE) and immunohistochemical staining. Monoclonal antibodies to CI (rabbit, 10 μg/ml, bs-10589R; Bioss Inc.) and CII (rabbit, 5 μg/ml, ab34712; Abcam) were used to detect the main collagens of the PT and PF, respectively. Stained images were collected using a microscope and imaging system (DM3000; Leica), and the mean TM thickness was determined using ImageJ (ver. 1.8.0) at three sites evenly spaced along the perforated TM cross-section, and at similar sites of normal and regenerated TMs.21
2.7 Statistical analysis
Quantitative variables are expressed as mean ± standard deviation. Paired two-way (perforation location and frequency) analysis of variance was used to compare the PTP or PFP groups (after perforation) with the control groups (before perforation), followed by post hoc testing (Sidak multiple comparisons) at each test frequency. The unpaired Student's t test was used to compare the unpaired PTP and PFP groups at each test frequency. Statistical significance was set at p < .05. All statistics were derived using GraphPad software (ver. 8.0.1; GraphPad Software Inc.) and figures were prepared using MATLAB (ver. 2020b; MathWorks).
3 RESULTS
3.1 Effects of PTPs and PFPs on umbo velocity
We evaluated umbo velocity before and after PFP and PTP. Figure 2A illustrates the velocities before and after small PFP or PTP creation. The umbo responses of the two creations were both characterized by a velocity loss “valley” and negative velocity loss “peak” compared to the controls. Two-way ANOVA suggested that small PFPs and PTPs did not significantly affect velocity [F (1,172) = 1.101, p = .2954 for small PFPs; F (1,178) = 2.498, p = .1158 for small PTPs]. We found no significant difference in velocity change between the small PFP and PTP groups at 1–10 kHz (t test, p > .05 at 1–10 kHz) (Figure 2B).
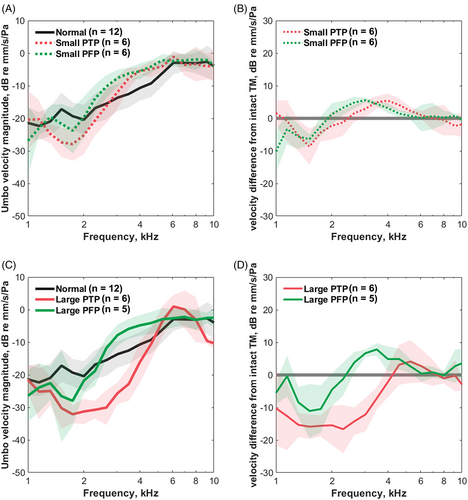
The umbo responses before and after large PFP and PTP creation are shown in Figure 2C. The umbo responses caused by large perforations were similar to those described in small perforation groups (with a “valley” and a “peak”) but showed more obvious velocity loss. The effect of large PFPs on velocity was non-significant [two-way ANOVA; F (1,162) = 0.9035, p = .433] and only a slight decrease in velocity was observed at 1.5 kHz in the post-hoc pairwise tests (Sidak multiple comparisons, p = .012). However, ANOVA suggested an overall significant effect of large PTP on velocity [F (1,176) = 96.03, p < .001] and post hoc pairwise tests indicated a significant decrease in velocity after large PTP at 1.5–3.5 kHz (Sidak multiple comparisons, p < .001). The large PTP groups had more significant velocity loss than the large PFP groups at 2.3–4 kHz (t test, p = .004 at 2.3 kHz, p < .001 at 2.6–3.5 kHz, p = .008 at 4 kHz) (Figure 2D).
3.2 Effects of PTP and PFP on hearing thresholds
We measured ABR thresholds before and after the creation of PFPs and PTPs. Figure 3A shows the ABR thresholds before and after the small PTP or PFP. Both groups exhibited non-significant ABR threshold elevations compared to the controls [two-way ANOVA; F (1, 36) = 4.089, p = .0507 for small PFPs; F (1, 36) = 2.538, p = .120 for small PTPs]. The threshold shift did not differ significantly between the two groups (t test; p > .05 at 1–32 kHz) (Figure 3B).
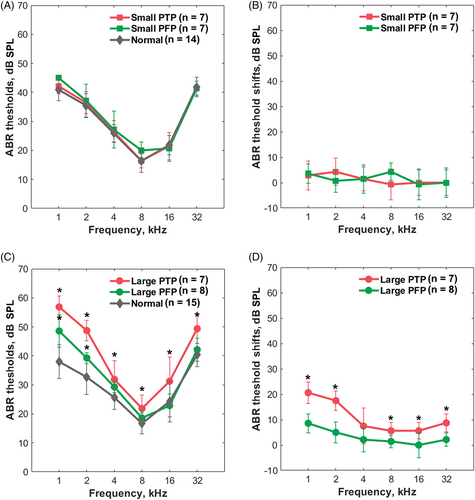
The ABR thresholds before and after creation of large PFPs and PTPs are shown in Figure 3C. Significant ABR threshold elevations at 1–2 kHz in large PFP group were suggested by the two-way ANOVA and post hoc comparison [F (1, 36) = 28.04, p < .001; Sidak multiple comparisons, p < .001 at 1 kHz, p = .010 at 2 kHz]. A more significant effect of large PTPs was revealed by two-way ANOVA [F (1,42) = 300.3, p < .001] and the post hoc comparison indicated that the ABR thresholds increased significantly at all recording frequencies (Sidak multiple comparisons, p < .01 at 1–32 kHz). Figure 3D shows that a large PTP was associated with a greater ABR threshold shifts than a large PFP (0–8.5 dB and 5.6–20 dB, respectively, for large PFP and large PTP groups). Significant group differences were evident at 1, 2, 8, 16, and 32 kHz (t test; p < .01 at 1, 2, 8, and 32 kHz, p = .03 at 16 kHz).
3.3 Functional and structural recovery of TMs with PTPs or PFPs
We evaluated the functional and structural recoveries of TMs 2 weeks after PFP and PTP. As shown in Figure 4A, the ABR thresholds had fully recovered in PFP group, and thus did not differ significantly from those before perforation at any frequency [two-way ANOVA, F (1, 30) = 0.2217, p = .641]. Two weeks after large PTP, as shown in Figure 4B, the ABR thresholds remained elevated at high frequencies compared with those before perforation. Significant differences in threshold between the recovered and normal groups were revealed by two-way ANOVA [F (1,42) = 18.02, p = .001] and significant threshold increases of the large PTP were indicated at 16–32 kHz by the post hoc test (Sidak multiple comparisons, p < .001 at 16 kHz and p = .001 at 32 kHz).
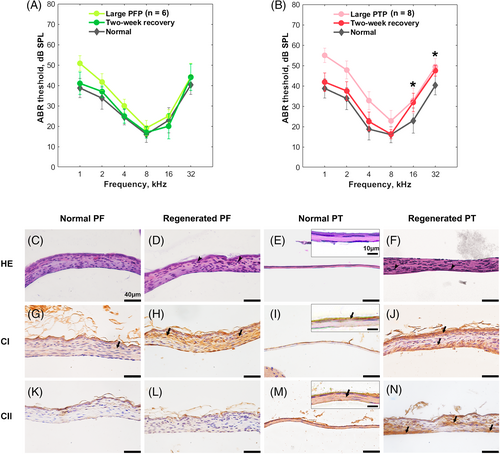
The results of HE staining are shown in Figure 4C–F. No significant difference was observed between the thicknesses of regenerated and normal PF groups (42.1 ± 4.1 μm and 41.2 ± 2.6 μm, respectively for regenerated and normal PF groups) (t test, p = .60). However, the regenerated PT was significantly thicker than the normal PT (41.6 ± 16.6 μm and 7.0 ± 2.9 μm, respectively for regenerated and normal PT groups) (t-test, p < .01). Proliferating epithelial cells and fibroblasts were observed in regenerated PTs and PFs, especially in PTs. Immunohistochemical staining (Figure 4G–J) showed that CI was abundant in the normal PF and weakly expressed in the epithelial layer of the normal PT. After regeneration, large increases in disordered CI fiber were evident in the connective tissues of the PT and PF. Figure 4K–N manifested CII labeling in the lamina propria of normal PTs, but not normal PFs. Two weeks after perforation, limited CII fibers were regenerated in healed PTs. Regenerated CII layer performed discontinuously and curly, surrounded by dispersed CII fibers among the connective tissue; While CII was still not observed in regenerated PFs.
4 DISCUSSION
Small PFPs and PTPs exerted little effect on the vibrational responses to sound or hearing of rats. In contrast, large PFPs clearly affected the low-frequency (1.5 kHz) umbo velocity, increasing the ABR threshold at low frequencies (1–2 kHz). Large PTPs significantly affected TM wideband vibration (1.5–3.5 kHz) and elevated the wideband ABR threshold (1–32 kHz). Two weeks after perforation, large PFPs and PTPs healed spontaneously. The hearing of rats with regenerated PFPs recovered fully; CI was completely regenerated. However, the regenerated PT was thickened and the CII fibers were disordered, associated with poor hearing recovery at high frequencies.
To the best of our knowledge, this is the first study to explore the effects of large PFPs on low-frequency TM hearing. Previously, Qin et al.19 found that neither small nor large PFPs significantly affected mouse hearing above 5.6 kHz. However, the effect on lower frequencies was not studied. Consistent with our results, other studies have reported decreased low-frequency TM velocities after PFP.19, 22 Low-frequency acoustic transmission requires normal ossicular coupling.23 A PFP reduces the pressure differential across the TM and thus impairs coupling.24, 25 Therefore, a large PFP may significantly affect low-frequency sound transmission. Unlike a large PFP, we found that a large PTP affected rat hearing at both low and high frequencies. Consistent with our findings, Lerut et al.14 described the hearing loss pattern after the PTP as an “inverted V-shape,” where high- and low-frequency damages were both significant in humans. Collagen stiffness in the radial direction is the determinant of acoustic transmission at high frequencies according to finite-element models.26, 27 It suggested that a PTP not only damages the normal ossicular coupling but also effect collagen stiffness of the TM. CII, as the main radial collagen type of the PT, provides the TM with sufficient stiffness.13 The radial arrangement of CII fibers also lead to denser fibers and more stiffness at umbo area of the TM.10 These characters determine that the CII can provide enough stiffness to drive the umbo vibration at high frequencies. Thus, damage to the PT, especially the CII fiber, leads to high-frequency hearing loss after PTP.
Two weeks after perforation, PF and PT perforations were resealed by regenerated tissues, suggesting that both the PT and PF heal well. For perforated PF, it is reported that the regeneration started at early stage and performed less epithelial proliferation compared to regenerated PT.28 In the present study, we observed that the proliferation of epithelial layer was slight and the thickness of regenerated PF was similar to that of normal PF. Regenerated CI fibers were distributed evenly over the regenerated PF. Although the fibers were slightly disordered, the low-frequency hearing loss recovered completely 2 weeks after PFP. Thus, recovery of the pressure differential across the TM required for low-frequency sound transmission does not depend on microstructural reconstruction of the PFP.
For perforated PT, the epithelial layer proliferates first and forms the sealed epithelial bridge over the lesion. Subsequently, the mucosal layer tissue and the lamina propria start to regenerate. In some cases, the TM can heal even without the middle lamina propria.29 Consistent with previous studies,17, 30, 31 we found that regenerated PT tissue, charactered by epithelial proliferation, was much thicker than that of the normal eardrum. TM thickness affected TM dynamics to a greater extent at high than low frequencies.27 Both a previous study and our results demonstrate that the thickened TM is associated with high-frequency hearing loss.17 Meanwhile, the collagen layer in the regenerated PT was discontinuous. CII fibers regeneration was inadequate and the fibers were dispersed throughout the thickened connective tissue. The density and arrangement of CII fibers affect the stiffness of the TM, and thus high-frequency sound transmission, as discussed before. CII disturbances in PT scars persisted for 3 months in gerbil,17 which is corresponding to high-frequency hearing loss 8 weeks after PTP in human.31, 32 Thus, TM thickening and disturbance of the CII fiber layer may explain the non-recovery of high-frequency hearing after PTP repair.23, 33
We found that large PTPs significantly decreased the umbo velocities between 1.5 and 3.5 kHz, whereas large PFPs slightly decreased the umbo velocity at only 1.5 kHz. Thus, PF played only minor roles in eardrum wave transmission and umbo vibrational output. The umbo velocity is very sensitive to changes in TM structural and mechanical characteristics,34, 35 but does not accurately reflect the hearing threshold.36 A combination of umbo velocity and audiometry measurements yields more reliable information on how TM perforations affect TM vibration and acoustic transmission.19, 37-39
5 CONCLUSION
In the present study, we showed that the PF is involved in low-frequency sound transmission, and explained why functional recovery differs after PTPs and PFP regenerate. We show that not only TM thickening, but also poor regeneration of disturbed CII fibers, play key roles in the suboptimal recovery of high-frequency hearing. Our study will aid future investigations of PF acoustic function and promote more effective TM repair after PTP; reconstruction of the CII fiber layer is of prime importance.
ACKNOWLEDGMENTS
This study was funded by the general programs of the National Natural Science Foundation of China (grant nos: 82071042, 81770998, and 82071040) and the Natural Science Foundation of Shanghai (grant no: 20ZR1442300). The authors would like to thank Dr Liujie Ren for his technological support on LDV measurement and Textcheck (http://www.textcheck.com) for English language editing.
CONFLICTS OF INTEREST
The authors declare no conflicts of interest.


