Evaluation of a pictorial method to obtain subject-specific inertial properties in equine limb segments
Funding information: McPhail endowment at Michigan State University; Universiteit Antwerpen, Grant Number: IOF SBO ID 34424; Fonds Wetenschappelijk Onderzoek, Grant Numbers: 1252113N and V428711N
Abstract
Data describing segmental masses and moments of inertia (MOI) of limb segments are required for inverse dynamic calculations. In horses, these values are usually calculated using regression equations that have been developed from a limited number of horses representing a small number of breeds. The objective of the present study was to evaluate the performance of a scaling method and a pictorial method for estimating of the values of segmental masses, lengths, and MOI in the equine limb segments by comparing their output with the standard technique involving direct measurements. Limbs of 30 horses of various breeds and sizes were disarticulated post mortem. Segmental masses, lengths, and MOI were determined using a standard method based on weighing the segments, measuring their length with calipers, and estimating the MOI from the rotational frequency of a trifilar pendulum. The scaling method used a jack-knifing procedure to avoid the need for two data sets. The pictorial method was based on digitization of two orthogonal photographs to determine segmental volumes, which were combined with published values for average segment densities to determine the inertial parameters. Scaling method and pictorial method provided comparable estimation of segmental messes and lengths, but the scaling method performed better in estimating segmental MOI. The scaling method worked well enough in the majority of horses but there were a few horses in which it was less effective. The pictorial method sometimes showed a bias correctable by regression equations but it may not warrant the additional effort unless for specific cases.
1 INTRODUCTION
The horse (Equus caballus) is a popular model for locomotor studies, and there has been a surge of interest in equine gait analysis over the past 40 years (van Weeren, 2002). As a species, the horse shows great diversity in size, conformation, and temperament. Clayton, Buchholz, and Nauwelaerts (2013) collected data on variety of horse breeds and showed that an approximate doubling of height (0.93–1.77 m) was accompanied by an almost sixfold increase in mass (117–666 kg). In addition to the large range of sizes, conformational characteristics differ greatly between breeds; for example, the long, gracile limbs of the racing breeds are quite different from the relatively short, stout limbs of the draft breeds.
Biomechanical studies of equine locomotion that are based on solving the equations of motion require knowledge of segmental masses, lengths, and moments of inertia (MOI; Crompton, Li, Alexander, Wang, & Gunther, 1996; Schneider & Zernicke, 1992). However, few studies have published normative data for segmental proportions and inertial properties of the equine limbs.
Methods used to estimate segment inertial parameters in individual people cannot always be used in large, unpredictable animals. For example, a range of imaging techniques, including 3D-scanning (Jensen, 1978; Norton, Donaldson, & Dekker, 2002), magnetic resonance imaging (Mungiole & Martin, 1990), gamma-ray scanning (Zatsiorsky, 1983), and dual energy X-ray absorptiometry (Wicke & Dumas, 2008), provide subject-specific data in people. However, these methods have not been applied in horses due to expense, lack of availability of large enough scanners, the need for suitable restraint which may involve general anesthesia, and the need to perform complex, time-consuming, and expensive procedures, particularly during clinical evaluations.
Accurate and reproducible estimates of human limb segment parameters can be obtained by having the subject lie in different limb positions on a board over a force plate to determine the center of pressure location (Pataky, Zatsiorsky, & Challis, 2003) or by performing whole body 3D-scans to measure external shapes of the segments (Norton et al., 2002). Neither of these techniques is practical for this purpose in horses.
Prediction equations that calculate segmental inertial parameters based on dissection of cadavers (Chandler, Clauser, Mcconville, Reynolds, & Young, 1975) use easily-obtained morphometric data, such as body weight and segment lengths, to estimate segmental masses and inertial parameters. Regression models, based on linear combinations of measures such as height, weight, or segment length, have been used to predict inertial parameters in live animals (Clayton et al. 2002; Dutto, Hoyt, Clayton, Cogger, & Wickler, 2004; Minetti, Ardigo, Reinach, & Saibene, 1999). This is the method that has been used most extensively in horses to report equine segmental masses and centers of mass (COM), though most of these studies have been based on small sample sizes that were limited to a single breed. The only data describing full inertial properties of all equine body segments were based on five ponies (van den Bogert, 1989) and six Dutch Warmbloods (Buchner, Savelberg, Schamhardt, & Barneveld, 1997). In Thoroughbreds, Sprigings & Leach (1986) and Kubo Sakai, Sakuraoka, and Ishii (1992) published full body data describing segmental masses and COM locations, with the latter study including measurements of segmental volumes and calculations of average segmental densities.
Many studies of equine locomotion are based on analysis of breeds other than ponies, Dutch Warmbloods or Thoroughbreds and may include horses of mixed or unknown breeds. These studies have used the published cadaver-based data and simply scaled it to individual horses of other breeds. The main drawback to this procedure is that errors may become significant when applying the models to subjects outside the population from which they were derived (Pataky et al., 2003).
Given the diversity that exists in the equine population, it would be useful to have a method of measuring the inertial parameters of the limb segments in individual horses in vivo to facilitate more accurate kinetic analyses including calculation of joint moments and powers. In a previous study, we reported sagittal-plane limb segmental data from a population of 38 horses that differed in size and conformational type (Nauwelaerts, Allen, Lane, & Clayton, 2011). The limb segments were weighed to measure their mass, suspended from a string with the long axis oriented horizontally to determine the COM location, and rotated on a trifilar pendulum to calculate the MOI. The present study builds upon that work comparing the mass and MOI of the equine limb segments reported by Nauwelaerts et al. (2011) with the values obtained using two alternative methods: A scaling method based on a jack-knifing procedure and a pictorial method based on two photographs. The aim was to evaluate the potential value of the scaling and pictorial methods for determination of segmental inertial properties in the sagittal plane of individual horses in vivo.
2 METHODS
The subjects were 30 horses of mixed breeds. Body mass was recorded in the live, standing horse (217–766 kg, mean 474 kg). After euthanasia, one forelimb and one hind limb were removed by sharp dissection of the extrinsic musculature. The limbs were disarticulated into segments which were frozen immediately. Since only cadaver material was used ethical approval was not required but informed consent of the owners was obtained.
Details of the limb removal and distarticulation procedures have been reported in Nauwelaerts et al. (2011). Briefly, the forelimb was removed by first severing the pectoralis, subclavius, and serratus ventralis muscles close to their attachments to the ribs and sternum, then severing the remaining extrinsic muscles around the periphery of the scapula and humerus. The segments were disarticulated by cutting horizontally through the soft tissues and around the bony protuberances at the level of the articular surface of each joint (glenohumeral, humeroradial, intercarpal, metacarpophalangeal, distal interphalangeal).
The hind limb was removed by disarticulation of the coxofemoral joint after incising the soft tissues starting dorsal to the greater trochanter and continuing cranially to the tuber coxae and caudally to the tuber ischium. Medially, the incision followed the line of the sacrum toward the coxofemoral joint, and then continued cranially toward the tuber coxae. The joint capsule and the ligament of the femoral head were incised to disarticulate the coxofemoral joint. The remaining extrinsic muscles were severed close to the pelvis to remove the entire hindlimb. The femorotibial, tarsocrural, metatarsophalangeal, and distal interphalangeal joints were disarticulated by severing the soft tissues horizontally at the level of the articular surface and, if necessary, cutting around any boney protuberances. Removal of the hoof was accomplished by cutting through the hairline at the coronet and severing the underlying soft tissues to disarticulate the distal interphalangeal joint, so that the distal sesamoid (navicular) bone and distal phalanx remained with the hoof segment.
2.1 Segmental masses
In the standard method, each limb segment was weighed using a Valor 5000 scale (Ohaus) which measures with a precision of 1 g. Segmental masses obtained by this method were considered the standard to which the other methods were compared.
In the scaling method, the mass of each limb segment was estimated as a percentage of body mass using the data from Nauwelaerts et al. (2011). The mass of the limb segment in the individual horses were then calculated by jack-knifing the data set. This involved removing the data for each horse, one at a time, from the data set, then recalculating the segmental mass ratio based on data from the remaining horses. The calculated ratio was multiplied by the total mass of the horse that had been removed to estimate the segmental mass of that horse while avoiding circular reasoning.
In the pictorial method, two orthogonal photographs of each disarticulated segment were taken with the bone axis vertical and a scale placed adjacent to the segment for calibration of linear measurements. The photographs were loaded into a custom Matlab routine. After manual selection of its proximal and distal ends, the software divided the segment along its length into 10 slices of equal height. The proximal and distal periphery of each segment was digitized manually in the two views and then the values were interpolated to obtain 10 ellipsoid disks per slice (100 disks per segment). The volume of each ellipsoid disk was calculated from measurements of the width (mediolateral dimension) and depth (craniocaudal dimension) at the proximal and distal extremities from the digitized outline, multiplied by the disk height which was one one-hundredth of the total segmental length. Segmental mass was calculated as the volume multiplied by the segmental densities reported by Kubo et al. (1992).
2.2 Segmental lengths
In the standard measurement method, segmental lengths were measured between the segment extremities, usually represented by the articular surfaces, using electronic calipers with a precision of 1 mm (Swiss Precision Instruments).
The scaling method used a jack-knifing procedure similar to that described for measuring segment mass. Regression equations were used to obtain segment lengths from the masses estimated by the scaling method omitting the individual subject for which the length was being determined, then recalculated the value based on data for the remaining horses.
In the pictorial method, the two orthogonal photographs of each disarticulated segment were loaded into a custom Matlab routine. After manual selection of the proximal and distal ends of the segment, and scaling of the picture by selecting a known length on the scale bar, the segment length was calculated.
2.3 Moment of inertia
The standard method for measuring the MOI used the data of a trifilar pendulum (Nauwelaerts et al., 2011). The pendulum has two parallel plates; the top plate is fixed in position but the lower plate rotates freely around three long, flexible steel cables attached equidistant from the center of the plates. The MOI of the empty pendulum was calculated based on the dimensions and weight of the lower plate. The segment that was being tested was placed on the lower plate of the pendulum with its COM aligned above the middle of the plate and the segmental sagittal plane parallel to the plate of the pendulum. The pendulum was set in motion, the period of free rotational vibration was recorded and the MOI of the segment-pendulum system was calculated (Nauwelaerts et al., 2011). The difference between MOI of the segment–pendulum system and the empty pendulum was used to calculate the segmental MOI. Since the segment is placed in this position only, only sagittal plane moments of inertia are determined.
In the scaling method, MOI calculated by the standard method were used in a jack-knifing procedure as described for the segmental masses. The MOI of each limb segment in the individual horses was calculated by removing that horse's data from the data set then jack-knifing the remaining data to recalculate the segmental MOI for the individual horse based on data for the remaining horses.
In the pictorial method, the MOI was calculated separately for each of the 100 ellipsoid disks, then the individual values were summed together to determine the overall MOI. The MOI was then expressed in reference to the COM position in accordance with the parallel axis theorem (Eichler, Kronfelt, & Sahm, 2001).
2.4 Statistics
Estimates of segment mass, segment length, and MOI for the scaling method and the pictorial method were compared to the measurements from the standard method using a Bland-Altman approach in MedCalc version 17.6 software. Bias and p-values of biases, intra-class correlations (ICC), and % errors were reported for each segment and each method.
3 RESULTS AND DISCUSSION
We compared the estimates from the scaling method and the pictorial method with the actual measurements made on each segment. In general, the scaling method did not show any systematic errors, while the pictorial method often demonstrated a clear bias in the data. The results are summarized in Tables 1-3, in which the rows represent the 11 limb segments, and the columns, from left to right, give the bias of the data compared to the actual measurements, the p-value of this bias, the ICC and the percentage error. These numerical parameters are represented visually in the scatterplots (Figures 1-4) to compare the three methods of obtaining inertial properties.
| Segment masses (kg) | Bias scaling vs. measured | p-value bias | ICC | % error | Bias pictorial vs. measured | p-value bias | ICC | % error |
|---|---|---|---|---|---|---|---|---|
| Scapula | .99 | 0.83 | 8 | .11 | 0.89 | 10 | ||
| Brachium | .99 | 0.81 | 12 | −0.901 | .01 | 0.89 | 10 | |
| Antebrachium | .99 | 0.86 | 7 | .85 | 0.94 | 7 | ||
| Metacarpus | .98 | 0.74 | 13 | −0.088 | .002 | 0.93 | 10 | |
| Pastern fore | .99 | 0.85 | 10 | .05 | 0.82 | 12 | ||
| Hoof fore | .99 | 0.79 | 13 | −0.229 | .002 | 0.88 | 21 | |
| Thigh | .99 | 0.81 | 10 | −2.623 | .0009 | 0.93 | 10 | |
| Crus | .99 | 0.89 | 6 | .30 | 0.84 | 8 | ||
| Metatarsus | .99 | 0.80 | 9 | .17 | 0.85 | 9 | ||
| Pastern hind | .99 | 0.81 | 11 | .053 | 0.79 | 13 | ||
| Hoof hind | .99 | 0.74 | 13 | −0.228 | .0001 | 0.80 | 28 |
|
Segmentlengths (mm) |
Bias scaling vs. measured | p-value bias | ICC | % error | Bias pictorial vs. measured | p-value bias | ICC | % error |
|---|---|---|---|---|---|---|---|---|
| Scapula | .91 | 0.58 | 5 | 35.1 | .004 | 0.47 | 9 | |
| Brachium | .57 | 0.65 | 7 | 20.0 | .006 | 0.74 | 8 | |
| Antebrachium | .52 | 0.61 | 5 | −18.8 | .006 | 0.82 | 6 | |
| Metacarpus | .61 | 0.64 | 4 | .52 | 0.75 | 3 | ||
| Pastern fore | .97 | 0.25 | 6 | .36 | 0.56 | 4 | ||
| Hoof fore | 5.4 | .01 | 0.36 | 8 | −8.3 | .0009 | 0.53 | 13 |
| Thigh | .80 | 0.60 | 8 | 47.9 | .0003 | 0.73 | 14 | |
| Crus | .62 | 0.74 | 4 | −17.6 | .0005 | 0.85 | 3 | |
| Metatarsus | .86 | 0.70 | 4 | −21 | <.0001 | 0.87 | 5 | |
| Pastern hind | .55 | 0.62 | 5 | .28 | 0.70 | 3 | ||
| Hoof hind | .58 | 0.53 | 5 | 10.2 | <.0001 | 0.83 | 13 |
|
Segment MOIs (kg. m^2) |
Bias scaling vs. measured | p-value bias | ICC | % error | Bias pictorial vs. measured | p-value bias | ICC | % error |
|---|---|---|---|---|---|---|---|---|
| Scapula | .70 | 0.76 | 24 | 0.080 | .0004 | 0.89 | 24 | |
| Brachium | .65 | 0.78 | 26 | 0.041 | .0034 | 0.71 | 45 | |
| Antebrachium | .77 | 0.87 | 23 | −0.040 | <.0001 | 0.90 | 49 | |
| Metacarpus | .82 | 0.86 | 15 | 0.0055 | <.0001 | 0.84 | 79 | |
| Pastern fore | .26 | 0.82 | 5 | −0.0004 | .0003 | 0.71 | 34 | |
| Hoof fore | .48 | 0.40 | 11 | .39 | 0.58 | 34 | ||
| Thigh | .91 | 0.74 | 18 | 0.21 | <.0001 | 0.95 | 19 | |
| Crus | .41 | 0.83 | 28 | 0.014 | .0022 | 0.68 | 65 | |
| Metatarsus | .77 | 0.74 | 52 | −0.023 | <.0001 | 0.90 | 196 | |
| Pastern hind | .37 | 0.85 | 8 | −0.0003 | .036 | 0.69 | 30 | |
| Hoof hind | .46 | 0.68 | 9 | .237 | 0.78 | 39 |
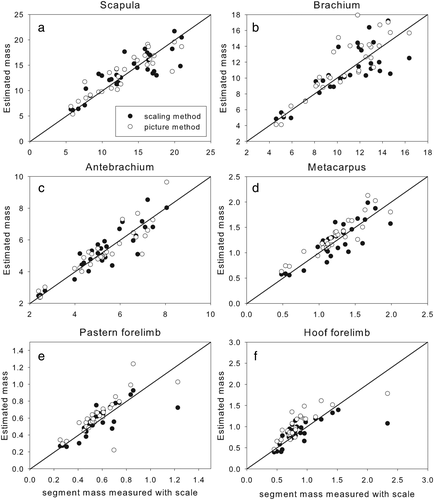
Graphs showing forelimb segment masses measured with a scale versus estimated using the scaling method (black dots) and the pictorial method (white dots)
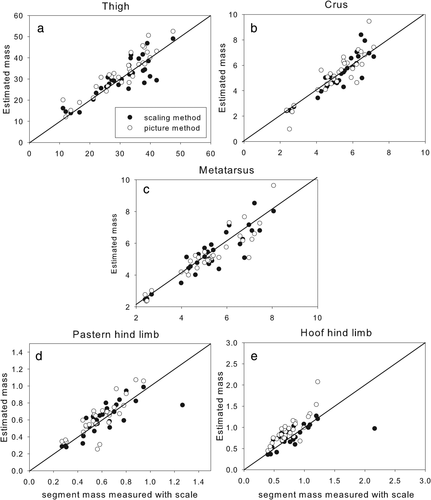
Graphs showing hind limb segment masses measured with a scale versus estimated using the scaling method (black dots) and the pictorial method (white dots)
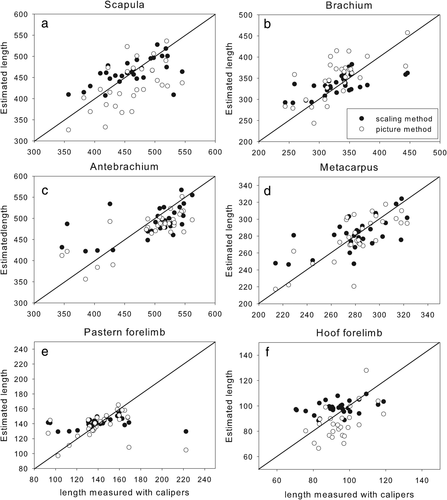
Graphs showing forelimb segment lengths measured with calipers versus estimated using the scaling method (black dots) and the pictorial method (white dots)
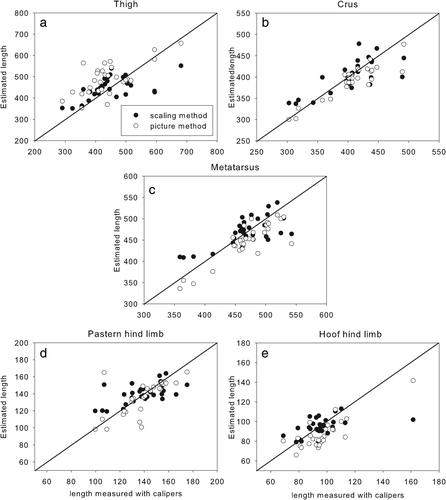
Graphs showing hind limb segment lengths measured with calipers versus estimated using the scaling method (black dots) and the pictorial method (white dots)
3.1 Segment masses
There was no systematic bias in the mass estimates of the scaling method (see p-values Table 1, third column). Relative errors were in the same range for both methods. The measured segmental masses were highly correlated with the scaling method and even slightly higher with the pictorial method, but the latter method showed a bias for the brachium (Figure 1b), the metacarpus (Figure 1d), the pasterns (Figures 1e and 2d), the hooves (Figures 1f and 2e), and the thigh (Figure 2a). The pictorial method overestimated the mass by 0.90 kg in the brachium, 88 g in the metacarpus, and 2.6 kg in the thigh. Rather than being a flaw in the pictorial method, however, these overestimations of mass by the pictorial method might actually reflect an underestimated mass in the reference data since van den Bogert (1989) reported that blood loss during disarticulation of the segments decreased segmental masses by 10%. The biases for the brachium, metacarpus, and thigh showed that their masses were over-estimation by around 10% of the average mass of the data set. If this were true, it could even suggest that the pictorial method is better at estimating the true masses of these segments. However, blood loss is unlikely to explain the differences in pastern and hoof masses, which also tended to be overestimated by the pictorial method. We used average segmental densities provided by Kubo et al. (1992) which reports density for the pastern and hoof as one segment. Buchner et al. (1997) reported densities for these two segments separately, with pastern density being higher, and hoof density slightly lower than the values we used. Since the difference amounted to only 5%, however, it seems unlikely that this explains the overestimation. Even though the pictorial method captures the contours of the segment adequately, the flat disc method does not work well when the joint surfaces at the segmental extremities are irregular, especially when the segment is small, as in the hoof and pastern.
When van den Bogert (1989) took a similar approach to obtaining inertial properties using the outlines of pictures, he concluded that the method performed poorly in estimating the scapula, brachium, and thigh masses. Since we obtained better results for these segments, it is possible that the problem was not in the elliptic zone model approach but rather the fact that his pictures were taken on live horses. These three segments are surrounded by large muscle masses, including the extrinsic limb musculature, that are difficult to include in photos of the live horse. Since we removed the segments from the body before tracing the contours, we did not encounter this particular problem.
Data from the pictorial method fall within the higher range of the data cloud from the scaling method. The scaling method did not show a bias but the data had more variation (e.g., pastern mass Figure 1e). In that sense, the pictorial method is better at individualizing the segments masses, but a correction factor accounting for the bias should probably be included to make the estimates more precise.
3.2 Segment lengths
Segment length estimates show a similar pattern to segment masses. There was no bias in the scaling data except for the length of the fore hoof for which percentage errors were acceptable but ICC were fairly low (Table 2). The lowest ICCs were found in the pastern and the hoof of the forelimb. The lengths estimated by the scaling method for both these segments have a much lower range in magnitude than the actual measurements, causing the lengths to be overestimated in the smaller segments. Even though the pictorial method had a consistent underestimation of 8 mm for the fore hoof, it did capture the full range of lengths and had a higher ICC. The lengths of the scapula (Figure 3a), brachium (Figure 3b), and thigh (Figure 4a) were overestimated while the lengths of the antebrachium (Figure 3c), crus (Figure 4b), and metatarsus (Figure 4c) were underestimated. This might be an effect of the way the program worked. The pictures were taken in two orthogonal planes with the segments upright. It is possible that when the segmental extremities were digitized, the points selected were different from those chosen in the caliper method.
The pictorial method overestimated the length of the hind hoof (Figure 4e) and underestimated the length of the fore hoof (Figure 3f). Since both hooves are so similar in shape, this seems to be a random effect rather than a methodological issue.
3.3 Moment of inertia
Both the scaling and pictorial methods were only capable of providing a rough estimate of the MOI, but the percentage error was particularly high in the pictorial method (Table 3). A bias was present in all segments estimated by the pictorial method, except for the hooves (Figures 5 and 6). Since the mass estimate of the hooves had the highest percentage error, it is a little surprising that the segments with the worst estimations of the MOI by the pictorial method are the metacarpus and the metatarsus (Figure 5 and 6). Correcting the metatarsal data for its large bias (0.023), brings the error down to 34%. The bias may be caused by the irregular shape of the proximal end of this segment, which includes the calcaneus. This has a relatively large effect on the MOI since it is so far from the COM. The MOI estimates for this segment might be improved by using more than 10 outline measurements to represent its shape.
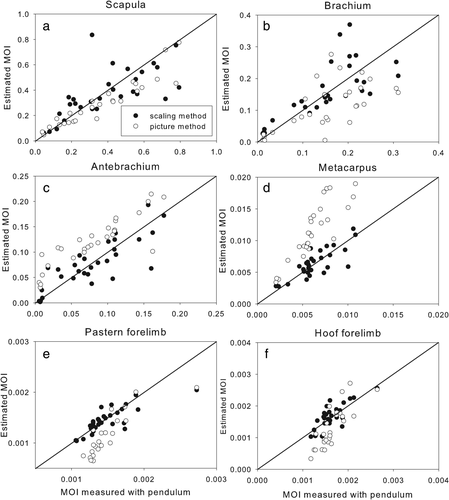
Graphs showing forelimb segment moments of inertia in the sagittal plane measured with a trifilar pendulum versus estimated using the scaling method (black dots) and the pictorial method (white dots)
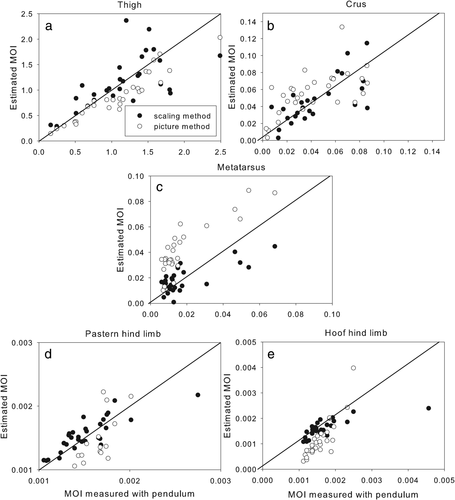
Graphs showing hind limb segment moments of inertia in the sagittal plane measured with a trifilar pendulum versus estimated using the scaling method (black dots) and the pictorial method (white dots)
4 CONCLUSION
This study has shown that the scaling method and the pictorial method work equally well at estimating segmental length and masses, but the scaling method performs better when estimating the segmental MOI. This is contrary to the statement that, regardless of whether density is assumed to be uniform or not, the use of geometric models is superior to inertial estimates obtained from regression equations (Wicke & Dumas, 2009). For most horses, the scaling method works well enough. Only when the horse mass distribution deviates significantly from the average as dictated by the scaling relationships, the pictorial method works better, especially if estimates are corrected for bias, which could be done by simple linear corrections using linear regression equations. However, the pictorial method does not seem to be worth the extra effort unless total body mass is unavailable or the horse has special features that require detailed individualization. In the latter case, it might be useful to obtain data on density gradients within the segments, to improve the MOI estimated by the pictorial method. In addition to cases of horses with special features, the pictorial method may be of use in case the total weight of the animal is unknown, as would be the case in wild animals or in captive animals in zoo-like environments. When absolute values are less critical, the pictorial method can provides rough estimates of inertial properties to be used as relative comparative values.
ACKNOWLEDGMENTS
Funding for this study was provided by the McPhail endowment at Michigan State University. The authors thank Jasmine Lane, Whitney Allen, Katherine O'Connor, Britt DeNuzio, and Claus Toftgaard Jørgensen for their work on this study. Shannon Griffin from the necropsy lab at the Diagnostic Center for Population and Animal Health and Narelle Stubbs were both a tremendous help in obtaining and removing limbs from the cadavers.
AUTHOR CONTRIBUTIONS
S.N.: contributed to concept/design of the study, acquisition of data, data analysis/interpretation, drafting of the manuscript, critical revision of the manuscript and approval of the article. H.C.: contributed to design of the project, data interpretation, critical revision of the manuscript and approval of the article.


