Scale diversity in bigeye tuna (Thunnus obesus): Fat-filled trabecular scales made of cellular bone
Funding information: ONR MURI, Grant Number: N000141410533; NSF, Grant Number: GRF 2014162421 (to DKW)
Abstract
Tunas of the genus Thunnus possess many morphological and physiological adaptations for their high-performance epipelagic ecology. Although Thunnus anatomy has been studied, there are no quantitative studies on the structure of their scales. We investigated the scales of bigeye tuna (Thunnus obesus) from ten regions of the body using micro computed tomography (µCT)-scanning and histology to quantitatively and qualitatively compare regional scale morphology. We found a diversity of scale sizes and shapes across the body of bigeye tuna and discriminant function analysis on variables derived from µCT-data showed that scales across the body differ quantitatively in shape and size. We also report the discovery of a novel scale type in corselet, tail, and cheek regions. These modified scales are ossified shells supported by internal trabeculae, filled with fat, and possessing an internal blood supply. Histological analysis showed that the outer lamellar layers of these thickened scales are composed of cellular bone, unexpected for a perciform fish in which bone is typically acellular. In the fairing region of the anterior body, these fat-filled scales are stacked in layers up to five scales deep, forming a thickened bony casing. Cheek scales also possess a fat-filled internal trabecular structure, while most posterior body scales are more plate-like and similar to typical teleost scales. While the function of these novel fat-filled scales is unknown, we explore several possible hypotheses for their function.
1 INTRODUCTION
Species in the genus Thunnus are large, schooling, regionally endothermic fishes that inhabit the open ocean, where they regularly migrate long distances to utilize seasonal abundances of food in different areas (Block et al., 2011; Carey & Teal, 1966). Thunnus spp. also support some of the most economically important global fisheries (Havice & Campling, 2010). The seven species in the genus Thunnus have been the subject of study due to their migratory life history habits (Block et al., 2005; Itoh & Tsuji, 2003; Madigan et al., 2014), morphological adaptations to continuous swimming (Bernal, Dickson, Shadwick, & Graham, 2001; Graham, Koehrn, & Dickson, 1983; Kishinouye, 1923; Potthoff, 1975; Westneat, Hoese, Pell, & Wainwright, 1993), and endothermic physiology (Brill, Dewar, & Graham, 1994; Carey & Teal, 1966, 1969; Carey, Teal, Kanwisher, & Lawson, 1971; Graham & Dickson, 2004; Holland, Brill, Chang, Sibert, & Fournier, 1992). Despite this continued biological interest in Thunnus spp. and the important role that teleost fish surface structure may play in locomotion by interfacing with the fluid environment (Burdak, 1986; Lauder et al., 2016; Wainwright, Lauder, & Weaver, 2017), there is little detailed information on the structure of skin and scales in any Thunnus species.
In teleost fishes, most scales occur as single ossified plates that overlap to create an imbricating pattern on the surface of the body. These bony scales are covered with a layer of epidermis and mucus (Sire & Akimenko, 2004), both of which provide an important immune function for fishes (Shephard, 1994; Xu et al., 2013; Zaccone, Kapoor, Fasulo, & Ainis, 2001). Scales differ substantially among species (Roberts, 1993; Wainwright et al. 2017) and may show considerable variation among regions of the body within the same species (Dapar, Torres, Fabricante, & Demayo, 2012; Wainwright & Lauder, 2016). These differences can include scale shape, the presence of spines or other projections, the presence of ctenii (small interlocking spines that form as separate ossifications), and other traits such as radii (gaps in the ossification of scales) and circuli (growth rings on the surface of scales). Scales in most teleost species are composed of acellular lamellar bone (lacking osteocytes), which includes plywood-like ossified layers of connective tissue (Sire & Huysseune, 2003; Zylberberg, Bereiter-Hahn, & Sire, 1988). Scales also grow outward from a central focus and thicken as an individual fish grows (Park & Lee, 1988; Schönbörner, Boivin, & Baud, 1979). After initial scale development in teleosts (which happens in post larval stages), scale size increases with fish growth, but scale number does not increase (Taylor, 1916). Scales are replaced if they are lost, and these replacement scales quickly grow to match the size of neighboring scales (Sire & Akimenko, 2004).
Teleost scales are biologically important in a number of ways. Although specific functions have not been conclusively proven, scales likely provide protection against predators and parasites (Browning, Ortiz, & Boyce, 2013; Vernerey & Barthelat, 2014), and serve as calcium stores (Parenti, 1986). Experimental studies on fish scale function have mostly focused on possible armor-like functions and the ability of scales to resist puncture while organized into a flexible protective surface (Bergman, Lajeunesse, & Motta, 2017; Browning et al., 2013; Duro-Royo et al., 2015; Ghosh, Ebrahimi, & Vaziri, 2014; Song, Ortiz, & Boyce, 2011; Vernerey & Barthelat, 2014). However, it has also been hypothesized that scales influence the hydrodynamics of swimming fish surfaces (boundary layer flow in particular) by either directly interacting with the water, or by maintaining an epidermis and mucus layer that interacts with flow next to the fish (Burdak, 1986; Daniel, 1981; Wainwright & Lauder, 2016).
The scales of scombrid fishes are not well studied, although it is well known that that many scombrid genera have a distinctive structure made of enlarged scales, called the corselet, on the anterior half of the body and posterior to the gill opening (see tuna diagram in Figures 1 and 2 [Collette & Nauen, 1983]). Corselet morphology and presence has been qualitatively described for different genera and species in the scombrid group (Collette, 1978; Collette & Nauen, 1983; Kishinouye, 1923) but only general descriptions of corselet scale morphology exist. Collette describes corselet scales as “enlarged” compared to scales posterior on the body and provides descriptions of scales and corselets for each of the different groups in his classification of tunas and mackerels (Collette, 1978). In Kishinouye's (1923) description of Thunnus morphology, scales are described as filled with “dentritic lumen,” although this observation is not elaborated on. Corselet scales from Thunuus spp. are also embedded under a thick epidermis, and while all fishes have an epidermal layer on their scales, tuna epidermis covering the corselet appears to be thicker compared to most other teleost fishes (Kishinouye, 1923). In a paper including a list of teleost species with acellular and cellular bone (although without any figures or other evidence), Kölliker (1857) describes corselet scales from Thunnus species as being made of cellular bone—whereas most other perciform fishes have acellular bone. These previous comments on Thunnus spp. scales describe interesting features (dentritic lumen, cellular bone) in need of elaboration and further study. Given the multiple adaptations Thunnus spp. have to their pelagic lifestyle and endothermic physiology (Block & Stevens, 2001), it is reasonable to hypothesize that their scales may show specializations compared to the typical teleost scale pattern. By studying these modifications, we may gain insight into both how the skin of tuna functions and what features of teleost scales and skin are functionally important.
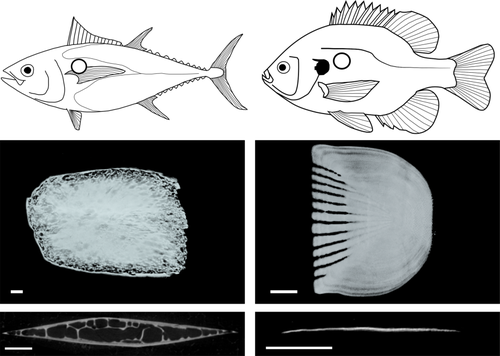
Micro-CT scan surface reconstructions and cross-sections for bigeye tuna (Thunnus obesus; left panels) and bluegill (Lepomis macrochirus; right panels). Images are from scales sampled from the anteriordorsal region of the body (location indicated by a circle on the fish images above). The tuna scale shows a modified morphology without many of the typical teleost scale features present in bluegill, such as radii (gaps in the anterior part of the scale) and circuli (concentric growth lines on the scale's surface). Bigeye tuna scales in this location have a thickened structure with top (lateral) and bottom (medial) ossified plates that join at the edges with trabeculae connecting these plates. The bluegill scale shows a typical teleost scale configuration of a single thin plate of bone without a central cavity (bottom right image). Scales are oriented anterior to the left, and cross-sections are results of cutting each scale dorso-ventrally. Scale bars: 1 mm
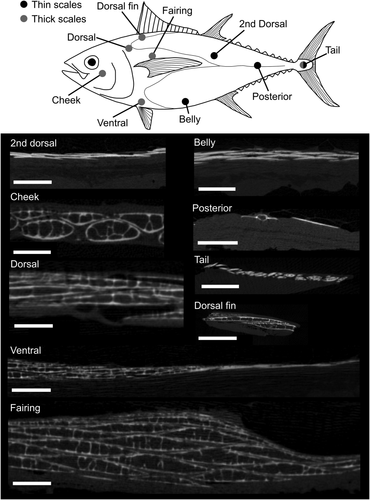
Drawing of bigeye tuna indicating the presence of thick or thin scales at different regions sampled (above) and micro-CT scan cross-sections of skin samples from each region (images below: cross-sections are perpendicular to long axis of the scales). The corselet is the region between the thin line that curves around the pectoral fin and the gill opening. Scale bars: 2 mm. The modified thickened scales are visible in the cheek, dorsal, ventral, fairing, dorsal fin, and tail regions, although there are large size differences among these scales. The second dorsal, belly, posterior, tail, and ventral regions show the more typical teleost condition of thin plate-like scales. The fairing region has multiple overlapped thickened scales. Note that the tail and ventral regions show both thick and thin scales
In this study, we investigate the morphology of scales in bigeye tuna (Thunnus obesus, Lowe, 1839) at ten regions of the body in five individuals of similar size. We use micro computed tomography (µCT) scanning and histological methods to image and quantify the morphology of scales in this species, and we present both qualitative and quantitative results on the diversity of scales that we find in bigeye tuna. Our results document the presence of considerable scale structure variation across the body and the occurrence of remarkable thickened scales composed of cellular bone with distinctive internal morphological features (trabeculae and lipid inclusions) not known from other teleost species (Figure 1). These results contribute new information about the skin and body surface to the suite of known specializations for pelagic life that characterize Thunnus species (Graham & Dickson, 2004).
2 MATERIALS AND METHODS
2.1 Specimen acquisition and sampling
We obtained five bigeye tuna (Thunnus obesus, Lowe, 1839), mean fork length 78.7 cm (1.87 cm standard deviation), from Tropic Fish Hawaii, LLC (Honolulu, Hawaii). Based on their fork length, these fish are approaching maturity (Nootmorn, 2004). Bigeye tuna was chosen as the focus of this study due to the availability of multiple individuals of similar size. Each fish had the internal organs and gills removed at the time of measurement, and all fish were of the same age class (based on their small range of fork lengths). The skin of each fish was sampled at nine different regions of the body (Figure 2) by excising a 4 × 4 cm region of skin with scales intact from each sampling location. In two individuals, it was difficult to find intact scales on one side of the body due to damage during capture, so some samples were taken from different sides of the body. In total, 45 samples of skin and scales (9 samples from each of 5 individuals) were frozen at −20° C prior to µCT scanning. After sampling we discovered that there are two distinct scale types (termed “thick” and “thin”) at the tail region (Figure 3), and we thus treated these different types as distinct regions in our measurements and analyses below, creating a total of ten regional locations instead of the original nine we sampled (see Figure 2 for regions). For brevity, we will refer to these regions throughout the manuscript using the names we give them in Figure 2: cheek, dorsal, fairing, ventral, belly, dorsal fin, 2nd dorsal, posterior, tail thin, and tail thick regions.

CT-scan cross-sections perpendicular to the long axis of the scale from cheek, posterior, and tail regions (regions from Figure 2). Anterior is coming out of the page, and the lateral body surface is towards the top. Scale bars: 500 μm. Cheek scales are thickened with ovoid dorsoventral cross-sections and trabeculae present. Posterior scales are thin and similar to typical teleost scales. Tail scales are small in cross-section (only 200–500 μm in width compared to 1.5–2 mm for cheek and posterior scales) and the tail region has both thick and thin scales. Tail region thickened scales have an open structure in their interiors, although they are thinner than other thickened scales (ex: 200 μm thick compared to 1.5 mm thick for thickened cheek scales). The thin and thick scales from the tail were treated as different regions in our analysis (see methods)
The fairing is a ridge on the lateral side of bigeye tuna (and other Thunnus species) that starts at the leading-edge origin of the pectoral fin and continues down the length of the corselet down the body. The fairing ridge allows the leading edge of the pectoral fin to sit against it when the pectoral fins are held against the body—this streamlines the body by creating a ridge and pocket that the pectoral fins fit into that smooths the external body surface (Kishinouye, 1923; Walters, 1962).
2.2 µCT scanning
We used a Bruker Skyscan 1173 µCT-scanner to obtain CT-data for each sample. All samples were scanned using voltages between 45 and 50 kV, currents between 150 and 180 µA, exposures between 900 and 1,100 milliseconds, and with voxel sizes between 13 and 29 μm. Scans were reconstructed into image stacks with NRecon v1.6.9 (Bruker micro CT; Kontich, Belgium) and analyzed with Mimics v16.0.0.235 (Materialise, Leuven, Belgium) to create three-dimensional models and measure morphology. From each sample of tuna skin with multiple overlapping scales, a single scale was isolated digitally in Mimics by segmenting it from adjacent scales to create a surface model for measurements. Because two scale types were recognized in the tail region (thick and thin scales, described below), one scale from each of these types was segmented and analyzed for each tail sample.
For each segmented scale, we measured six variables: scale bone volume, surface area, height, length, thickness, and total scale layer thickness. Scale aspect ratio was also calculated and included as a seventh variable (explanation below). Creating a surface model of each scale allowed for bone volume and surface area to be calculated in Mimics, and it is important to note that these variables only measured the bony elements of scales, not the internal volume or internal surface area. Height was measured as the maximum dorso-ventral height of each scale on the surface model generated in Mimics. Length was quantified as the maximum anteroposterior length. Scale aspect ratio was calculated by dividing the height of each scale by the length of the same scale to give a general metric of scale shape. Scale thickness was measured in cross-sectional views (as seen in Figures 1 and 2) in Mimics software (version 16) and is the largest value of scale thickness along the medial-lateral axis. Finally, total scale layer thickness is the thickness of the entire scale layer, which spans multiple overlapping scales. All µCT data has been uploaded to both the Harvard Dataverse (https://doi.org/10.7910/DVN/LJASQK) and to Open Science Framework (https://osf.io/fuw7k/) and is available for download.
2.3 Statistical analysis
We used the seven variables that we measured (length, height, thickness, bone volume, surface area, scale aspect ratio, and total scale layer thickness) to study morphological differences between the ten regions we sampled on the body of bigeye tuna. All statistics were performed in R version 3.3.1 (R Development Core Team, 2016). First, we used the package “psych” (Revelle, 2016) to create a correlation matrix using all seven of our variables, in order to determine which variables show similar patterns. We eliminated variables that were highly correlated with each other (details in the results below) to generate a smaller pool of variables, which included bone volume, scale aspect ratio, and total scale layer thickness. To test for morphological differences among body regions, we used a multivariate analysis of variance (MANOVA) using body regions as the independent variable and our three morphological variables as dependent variables. To visually display the results of our MANOVA, we implemented a discriminant function analysis using the “MASS” package in R (Venables & Ripley, 2002) with body region as the independent variable and our three morphological variables as dependent variables. We then performed one-way analysis of variance (ANOVA) tests on bone volume, scale aspect ratio, and total scale layer thickness independently using body region as the independent variable each time. Each ANOVA was followed by a Tukey HSD post-hoc test to test for pairwise differences among regions in a morphological variable (either bone volume, aspect ratio, or total scale layer thickness, depending on the test).
2.4 Histology
Skin and scales from two bigeye tunas were used for histological analysis to investigate the internal structure of scales and determine scale composition. First, hematoxylin and eosin were used to stain 5-micron-thick sections of paraffin embedded, decalcified (using formic acid) tissue from two regions of bigeye tuna: a region dorsal to the fairing just dorsal to the insertion of the pectoral fin, and a posterior region ventral to the second dorsal fin and dorsal to the anal fin (locations shown in Figure 5). These two regions were chosen for histological analysis to clarify the structure of two distinct scale regions identified by µCT: the thickened scale area on the fairing in comparison to posterior body regions with thinner scales (scale morphology is described in detail below). For one individual, 60 sections (30 from each of the two regions), each 250 microns apart, were examined with hematoxylin and eosin staining. Three sections from a second individual, each 50 microns apart, were fixed and stained with osmium tetroxide (detailed below).
Hematoxylin and eosin stained sections showed what appeared to be fat inside the thickened scales from the anterior part of the body (Figure 5), and to confirm this we fixed and stained a second series of samples from the thickened scale region with osmium tetroxide (Figure 6). Osmium tetroxide fixation preserves lipids in biological tissues (which can otherwise be removed by solvents during standard embedding procedures [Wigglesworth, 1957]), and lipid inclusions then can be positively identified by their black color in subsequent paraffin sections (Figure 6). We first fixed all samples in 4% paraformaldehyde, washed samples with distilled water, decalcified samples (with Fisher Cal-ex CS510-1D), washed them again in water, then stained and fixed lipids in the samples by placing samples in a 0.5% osmium tetroxide bath.
3 RESULTS
3.1 µCT-observations
Bigeye tuna have large, thickened scales on parts of their bodies (Table 1, Figures 1 and 2, supporting information Video 1). These thickened scales (Figure 4) are markedly different from the typical flattened scales of most other teleosts (including bigeye tuna scales from other regions of the body) which are composed of bony laminae with a solid internal structure (Figure 1). The thickened scales of T. obesus are present mostly posterior to the gill opening around the pectoral fin, and make up the corselet (Figure 2) while other parts of the body have smaller, thinner scales of lamellar bone (Table 1, Figure 2; Collette & Nauen, 1983; Kishinouye, 1923). The thickened scales of bigeye tuna are 0.7–1.2 mm thick, which is thicker than both typical teleost scales (0.06–0.2 mm thick [Bergman et al. 2017; Wainwright & Lauder, 2016]) and scales on the posterior part of the body of bigeye tuna (0.09–0.27 mm thick, Table 1). Some parts on the head of bigeye tuna are scale-less (such as the dorsal side of the head) but the body of the tuna (posterior to the opercle) is covered in scales.
| Mean | SE | Mean | SE | Mean | SE | |
|---|---|---|---|---|---|---|
| length | length | height | height | thickness | thickness | |
| Region | (mm) | (mm) | (mm) | (mm) | (mm) | (mm) |
| Cheek | 28.21 | 1.51 | 4.20 | 0.15 | 1.19 | 0.15 |
| Dorsal | 10.52 | 1.47 | 8.37 | 0.76 | 0.72 | 0.07 |
| Fairing | 14.63 | 0.63 | 6.68 | 0.35 | 0.93 | 0.06 |
| Ventral | 4.54 | 0.94 | 3.36 | 0.47 | 0.27 | 0.07 |
| Dorsal fin | 3.89 | 0.46 | 2.57 | 0.36 | 0.24 | 0.04 |
| Belly | 2.84 | 0.21 | 3.31 | 0.19 | 0.14 | 0.02 |
| 2nd dorsal | 3.46 | 0.46 | 3.20 | 0.2 | 0.12 | 0.02 |
| Posterior | 2.98 | 0.13 | 2.00 | 0.07 | 0.15 | 0.01 |
| Tail thin | 4.83 | 0.65 | 0.95 | 0.09 | 0.09 | 0.01 |
| Tail thick | 3.95 | 0.53 | 0.38 | 0.05 | 0.14 | 0.01 |
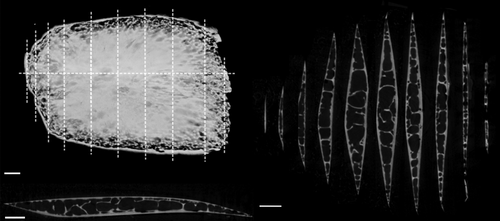
CT-scan surface rendering and cross-sections of a scan of an isolated scale from the dorsal region (Figure 2). Anterior is to the left and dorsal is at the top of both the top-left image and right-side cross-sections. Anterior to the left and dorsal is into the page for the bottom left cross-section. The surface rendering in the top left shows weaker ossification at the edges of the scale, especially at the posterior margin. To the right, 10 dorso-ventral cross-sections are shown of this single scale from the dorsal region of the bigeye tuna. The lines on the surface rendering show where cross-sections were taken. A single anteroposterior cross-section is shown in the bottom left—there is asymmetry with the anterior side being thicker than the posterior. The cross-sections show the trabeculae present in the internal part of the scale. Scale bars: 1 mm
In bigeye tuna, thickened scales have an ossified exterior layer of lamellar bone that forms the exterior and interior sides of the scale and surrounds an internal cavity made of bony trabeculae surrounded by fat cells (Figures 1 and 4: described in more detail below). Furthermore, these scales do not have the typical growth lines (circuli) or gaps in the ossification of their anterior fields (radii) apparent in other teleost scales (visible in the bluegill scale shown in Figure 1). The thickened scales of the corselet have spindle-shape dorsoventral cross-sections, trabeculae crossing their interiors, an asymmetrical anteroposterior cross-section, and weak ossification at their edges, especially at the posterior edge (Figure 4). Thickened scales also occur on the cheek (exterior to the adductor mandibulae muscles) and tail (exterior to the hypural plate) regions of bigeye tuna (Figure 2). Scales at the cheek are elongate in anterior-posterior axis of the body and are thicker (mean thickness: 1.2 mm, Table 1) and larger (mean length: 28.2 mm, Table 1) than scales elsewhere on the body. At the tail region, however, scales of two types are present: thickened scales with an internal cavity, and thin, plate-like scales (Figure 3). Both of these scale types in this region are relatively small (mean length: 4.4 mm, Table 1), while also being elongated in a direction parallel to the anterior-posterior axis of the body. Overall, the morphology of thickened scales across the body is qualitatively diverse in both size and shape (Figure 2, Table 1). Transitions between thick and thin scales can be seen in images from the sampling regions labeled ventral and tail (Figure 3).
3.2 µCT-measurements
A correlation matrix was calculated for the seven measured variables (bone volume, surface area, height, length, scale thickness, total scale layer thickness, aspect ratio) to determine the degree of inter-correlation among all pairs of variables. The size-related variables (bone volume, surface area, height, length, thickness) were all highly correlated with one another (R = 0.69–0.95; excluding height: R = 0.91–0.95). We elected to use scale bone volume to represent these five variables because we believe it best represents size of a scale and energy invested for growth. Total scale layer thickness and scale aspect ratio were not as highly correlated to bone volume as other variables (r = .77 for total scale layer thickness; r = –.29 for aspect ratio), so we elected to include these two variables along with bone volume in our multivariate analyses.
We used a MANOVA with bone volume, total scale layer thickness, and scale aspect ratio as our dependent variables, and the region of the body as the independent variable to test for the effect of body position on scale morphology. Results from the MANOVA indicate that there are significant differences in scale morphology among different body regions (Wilks lambda, degrees of freedom = 9, Wilks approximation = 0.00309, F = 25.7, p < .0001) (MANOVA results are displayed with a discriminant function analysis, explained below; Figure 8). We then used multiple ANOVAs to test which of the three variables (bone volume, total scale layer thickness, and aspect ratio) differ among scales from different regions of the body (Figure 9). We found significant differences among body regions in bone volume (degrees of freedom = 9, F value = 25.3, p < .0001), total scale layer thickness (degrees of freedom = 9, F value = 30.4, p < .0001), and scale aspect ratio (degrees of freedom = 9, F value = 55.8, p < .0001).
In addition, we display the results of the MANOVA with a discriminant function analysis in Figure 8, which creates multivariate, orthogonal axes that best separate the given groups, in this case the ten sampled regions. Scale aspect ratio loads heavily on the first linear discriminant axis, which is responsible for 55.6% of the variation in the data set. Both bone volume and total scale layer thickness load heavily on the second linear discriminant axis, which is responsible for 38.0% of the variation in the data. Scales from the fairing, cheek, and dorsal regions have large bone volumes and occur in the thickest layers compared to other regions. Scales from the cheek, tail thin, and tail thick regions all have the highest aspect ratios (elongate in the anteroposterior axis), however tail thin and thick regions both have scales with small volumes that occur in thin layers in the skin. Scales from the belly and 2nd dorsal regions have the smallest aspect ratios (taller in the dorsoventral axis).
3.3 Histological results
The hematoxylin and eosin stained sections show the presence of adipocytes inside the thickened scales as transparent globular structures (Figure 6a). The presence of fat inside the thickened scales was confirmed with an osmium tetroxide fixation and stain of lipids (Figure 6b). A layer of fat cells is also present beneath the dermis in body regions with thin scales (Figure 5). The presence of subdermal fat cannot be confirmed beneath the corselet because our sections are not deep enough.
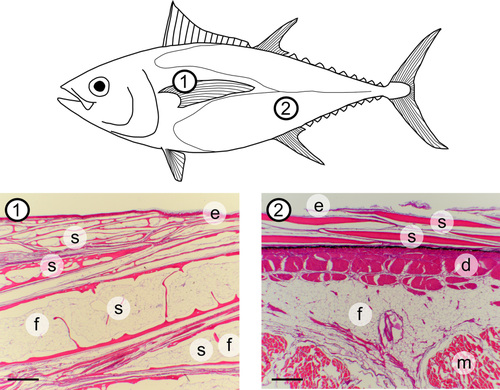
Histological sections from two regions of the body of a bigeye tuna, stained with hematoxylin and eosin. Region 1 is near the fairing region (Figure 2) and shows thickened, modified scales, while region 2 is ventral to the 2nd dorsal area (Figure 2) and shows more typical teleost scale morphology from further posterior on the body. There are many scales present in region 1, and we label four of them. Labels: e, epidermis; s, scale; d, dermis; m, muscle; f, fat. Scale bars: 500 μm
Histological sections also reveal both arterioles and venules among the fat cells (Figure 7), which might serve to deposit or mobilize lipids in the scale interior. These arterioles and venules are consistent with the size and morphology of the same structures in other vertebrate taxa (Bloom & Fawcett, 1975; Patt & Patt, 1969). Also, lacunae (30–50 µm in diameter) are present in the external bone of the thickened scales (Figure 7e,f), and likely correspond to locations where the circulatory system penetrates the bony scale exterior. Within the lamellar bone covering each thickened scale (as well as the trabeculae: Supplementary Figure 1), smaller lacunae (about 10 µm in diameter) contain osteocytes and reflect the presence of bone (Figure 7e,f). These small lacunae and osteocytes are consistent with those seen in other vertebrate taxa (Atkins et al., 2014; Bloom & Fawcett, 1975; Patt & Patt, 1969). Thin scales occur on body regions other than the corselet (Figure 2) and are plate-like with a lamellar structure. These scales also have small lacunae containing osteocytes at scale margins, indicating the presence of cellular bone (Figure 7g,h).
4 DISCUSSION
Analysis of scale morphology in bigeye tuna shows that this species has modified scales compared to typical flattened ctenoid and cycloid scales in many other teleosts (Figure 1, supporting information Video 1). These thickened scales are composed of bony outer shells filled with fat and braced by trabeculae. In addition, the bone of both thick and thin scales is made of cellular bone. Arterioles and venules are also visible among the fat cells inside the thick scales. These thickened, fat-filled scales occur on the cheek, at the base of the caudal fin, and as part of the corselet (posterior to the gill opening).
On much of the posterior regions of the body, bigeye tuna have thin plate-like scales that are superficially similar to the scales of most perciform fishes (Parenti, 1986; Sire & Akimenko, 2004), and these scales are also composed of cellular bone at their margins. Bigeye tuna have remarkably diverse scales among the ten sampled regions of their body. Skin samples from different regions differ with respect to their scale volume, total scale layer thickness, and scale aspect ratio, indicating that they vary in size, shape, and the extent of overlap between scales (Figure 2). In general, larger scales are located in more anterior body regions, while smaller scales are found on the posterior half of bigeye tuna.
The thickened, fat-filled scales of the corselet and cheek are remarkable in their morphology, but no data on scale function in tuna are available. Hypotheses of the function of these modified thickened scales and of variation in scale morphology across the body are thus necessarily somewhat speculative. Despite this, if we restrict ourselves to first principles of the composition and structure of the modified scales, we can confidently state a few functional implications using hypothetical comparisons. First, thickened scales will protect the body surface from damage more so than smaller flattened scales or no scales. Second, fat-filled scales will increase buoyancy compared to scales of the same size but made entirely of bone. Third, fat-filled scales will provide better thermal insulation by decreasing conductance across the skin compared to similar-sized bone scales, or no scales. Subdermal fat (Figure 2) would provide additional thermal insulation—another endothermic fish, the opah, is described as having an exceptionally thick subdermal layer of fat around their body (Wegner, Snodgrass, Dewar, & Hyde, 2015). Although we can be confident in the action of these physical mechanisms, we do not know if these mechanisms have large enough effects on bigeye tuna to be functionally important. Further studies including experimental measurements of scale thermal and material properties, and studies comparing scale morphology across taxa in resolved scombrid trees (Miya et al., 2013; Santini, Carnevale, & Sorenson, 2013) would inform potential functions of thickened scales in protection, buoyancy, and thermal insulation. Although Thunnus spp. have the largest and most well-developed corselets (where we see the modified scales), non-endothermic scombrid genera such as Sarda are also described as having corselets (Collette & Nauen, 1983; Kishinouye, 1923), although there are no publications discussing details of their scale morphology.
Previous studies have suggested that corselets reduce drag in tuna swimming by tripping the boundary layer from laminar to turbulent to delay boundary layer separation (Blake, 2004; Fierstine & Walters, 1968; Walters, 1962; Webb, 1975). Although no study has experimentally examined flow over this region during swimming, we believe this is an unlikely function of the corselet because both the enlarged scales of the corselet and the smaller scales posterior to the corselet are coated in both epidermis and mucus. Covering scales with epidermis and mucus has an effect of smoothing the topography of the scales in fishes (Wainwright & Lauder, in press; Wainwright et al., 2017), which would make it difficult to trip the boundary layer from laminar to turbulent. Furthermore, the end of the corselet (Figure 2: fairing) does not create the type of roughness element (a sharp drop or bump) that is required to trip a boundary layer from laminar to turbulent. To support this, the cross-section of skin from the ventral region (Figure 2) illustrates the gradient of scale morphology at the edge of the corselet – this smooth transition is unlikely to trip the boundary layer.
The thickened scales of the corselet also give form to the fairing, which is a ridge that is dorsal to the pectoral fin and runs posteriorly down the body to the edge of the corselet—it allows the pectoral fin to be adducted against the body with its thickened leading edge against the ridge of the fairing, streamlining the contours of the body and pectoral fin (Kishinouye, 1923; Walters, 1962). This fairing is constructed using the thickened scales of the corselet (fairing region, Figure 2) where more scales are layered on top one another, and where scales are thinner in the depression for the pectoral fin, ventral to the fairing ridge. In this way, the corselet scales may contribute indirectly to drag reduction by providing streamlining for adducted pectoral fins. However, scales are not required for creating fairing-like structures, as similar structures are seen near the pectoral fins of beaked whales (Dalebout et al., 2003; Mead, Walker, & Houck, 1982). Therefore, it is difficult to assign a purely drag reductive role to the modified scales we have described, because as beaked whale morphology shows, construction of a fairing does not require scales.
Thunnus spp. have often been described as having a specialized undulatory swimming mode, called thunniform swimming (Breder, 1926; Webb, 1975) which is characterized by low amplitude bending in the head and body and higher amplitude bending in the peduncle and tail. Although thunniform swimming is often cited as a specialized case of swimming kinematics where lateral head amplitude (yaw) during swimming is exceptionally low, one study shows that the lateral head amplitude of thunniform swimmers is no different than carangiform swimmers (Donley & Dickson, 2000). Similarly, another study comparing midline kinematics of tunas to other species shows little difference in the ratio of head-to-tail amplitude in lateral bending between tunas and other fishes (Lauder & Tytell, 2006). Although one may propose that the thickened scale layer of the corselet creates higher stiffness in the anterior body reflective of thunniform swimming, kinematic data do not show any reduced lateral movement in the anterior body for swimming tuna, and thus do not support either the idea that thickened scales contribute to higher body stiffness at the head, or that thunniform swimming has smaller head oscillation amplitude than other swimming categories.
The function of the cellular bone and circulatory system elements (Figure 7) within thickened scales is unknown, but both anatomical features suggest a higher metabolic rate in these scales (compared to scales without either feature) and that calcium and lipids may be mobilized for metabolic needs. Although a circulatory system is known to be present on the surface of fish skin and on the surface of scales in teleost fishes (Farrell, Eliason, Clark, & Steinhausen, 2014; Rummer, Wang, Steffensen, & Randall, 2014), the circulatory elements identified inside bigeye tuna thick scales are, to our knowledge, unique among teleost fishes. Circulatory control of deposition and mobilization inside thickened scales would allow for control of lipid use with growth or during migratory periods with limited feeding where additional energy may be needed (as in salmonids [e.g., Penney & Moffitt, 2015]). Fat deposition in the scales and below the skin in tuna could also function as a reservoir for gamete production. Analyzing the fat content of thick scales in bigeye tunas under stress, starvation, or spawning conditions could determine if interior lipids are mobilized to meet metabolic needs, and determining what lipids are being stored would inform potential metabolic or buoyancy-related functions (Phleger, 1998).
The presence of cellular bone in both thickened and thin bigeye tuna scales warrants further investigation, as current comparative data suggest that “basal” teleosts and teleosts with ganoid scales have cellular bone in their scales, while most perciform fishes possess acellular bone (Meunier, 1981; Meunier & Brito, 2004; Parenti, 1986). Previous work indicates that tunas have cellular bone (our histological work confirms this for bigeye tuna), while the closely related mackerels (Scomber spp.) have acellular bone (Kölliker, 1857; Meunier, 2011). Most teleosts have acellular bone not only in their scales, but also in their body skeleton, yet we know little about the functional implications of having cellular versus acellular bone in fishes (Cohen et al., 2012; Moss, 1961; Shahar & Dean, 2013). It has long been thought that acellular bone is a derived condition in fishes, with euteleosts having a skeleton of acellular bone compared to cellular bone in more basal taxa (Meunier, 2011; Parenti, 1986). However it has also been shown that many euteleosts have cellular bone in parts of their skeleton (Hughes, Bassett, & Moffat, 1994) and that there are many transitions from acellular to cellular bone throughout teleosts (Kölliker, 1857; Kranenbarg, van Cleynenbreugel, Schipper, & van Leeuwen, 2005; Meunier & Huysseune, 1992; Moss, 1961, 1965; Sire, Huysseune, & Meunier, 1990).
In fishes, the function of acellular versus cellular bone has not been determined, although some hypotheses have been tested and found to have little support. For example, studies have found that acellular bone has similar material properties to cellular fish bone (Cohen et al., 2012; Dean & Shahar, 2012; Horton & Summers, 2009), acellular bone can remodel itself despite lacking enclosed cells (Atkins et al., 2014; Kranenbarg, et al., 2005), and cellular bone does not appear to be more prevalent in freshwater fish species, which may need to draw on calcium stores more often than saltwater fishes (Moss, 1965). Perhaps the presence of cellular bone in the large scales of bigeye tuna assists in rapid scale growth or remodeling, as well as rapid mobilization and deposition of calcium. Large, pelagic, fast-growing fishes may have higher needs for calcium and bone remodeling, especially during long migrations, necessitating cellular bony scales. One study has demonstrated bone resorption in fin spines of Atlantic bluefin tuna (Thunnus thynnus) (Santamaria et al., 2015) and more work on different bones of other scombrid species could determine if tunas have specializations for increased bone remodeling or resorption, compared to Scomber spp. (close relatives with acellular bone). Curiously, the osteocytes in the bone of the thin scales of Thunnus appear to be concentrated near scale margins, where remodeling and growth would also be concentrated (Figure 7g,h). However, there is no apparent pattern to osteocyte distribution in the thickened scales (Figures 6 and 7). Leatherback turtle (Dermochelys coriacea, Vandelli 1761) bones have a similarly modified growth pattern, perhaps due to high growth rates, large adult sizes, and endothermy (Rhodin, 1985) and the modified bone structure seen in bigeye tuna could be a reflection of some of these characteristics as well.
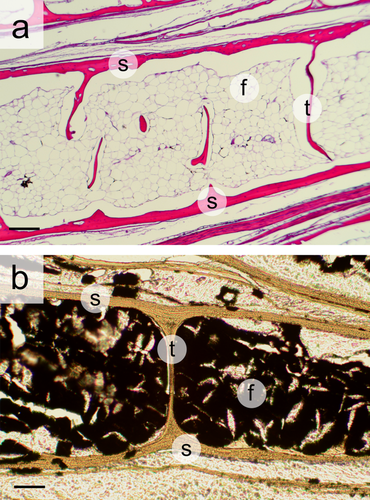
Histological sections of bigeye tuna scales. (a) Hematoxylin and eosin stained section showing details of fat deposition inside a thickened scale. Globular fat cells are visible inside the scale. The top (lateral surface) and bottom (medial surface) of the scale are both labeled “s,” and portions of the internal bony trabeculae are visible “t.” (b) Osmium tetroxide stained section of an individual scale to confirm the presence of fat (stained black) inside the scale. The top and bottom of the scale are labeled “s,” and an entire bony trabeculae labeled “t.” Labels: s, outer bone of scales; f, fat; t, trabeculae. Scale bars: 200 μm in (a) and 100 μm in (b)
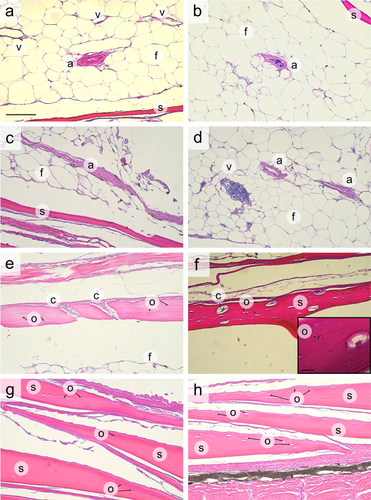
Histological sections stained with hematoxylin and eosin showing details of internal structure in the thickened (a–f) and thin (g, h) scales of bigeye tuna. (a) The fat-filled region of a single fairing scale, with an arteriole “a” and three venules “v” visible inside the scale. (b) An arteriole showing the lumen and blood cells. (c) A transverse section of the wall of an arteriole inside a scale. (d) Two cross-sections of arterioles and a venule showing blood in its interior. (e) The cellular bone wall of a thickened scale, with larger lacunae carrying circulatory elements labeled with “c” and smaller lacunae containing osteocytes labeled with “o.” (f) Osteoctyes and larger lacunae in the lamellar bone of a thickened scale. (g) Thin scales with lacunae containing osteocytes (labeled “o”). (h) More thin scales showing cellular bone. Labels: s: scale wall; a: arteriole in adipose tissue; f: fat; v: venules; c: circulatory element in lacunae; o: osteocyte in lacunae. Scale bar: 100 μm (for all panels, in (a) only). Scale bar for (f) inset: 15 μm
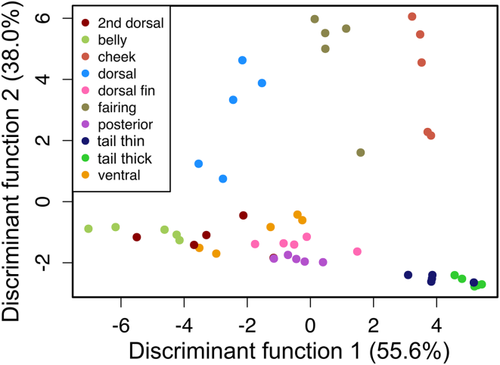
Discriminant function analysis using region of the body as the dependent variable and volume, skin thickness, and scale aspect ratio as independent variables. Scale aspect ratio loads most heavily on the first discriminant function, which is responsible for 55.6% of the variation in the data. Both volume and total scale layer thickness load heavily on the second discriminant function, which is responsible for 38.0% of the variation. Color denotes different body regions from which scales were sampled (Figure 2)
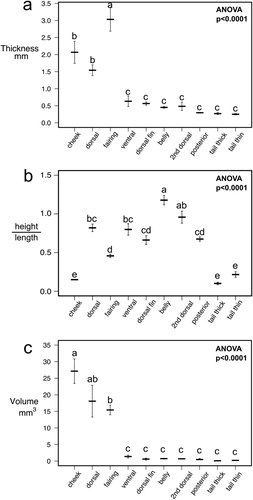
(a) Thickness of the scale layer, (b) scale aspect ratio, and (c) scale bony tissue volume compared across different body regions of bigeye tuna. Dark bars are means and error bars are +/– 1 standard error for one scale sampled per region for five bigeye tuna. ANOVA results are shown on each graph and lowercase letter labels indicate significant groupings using a Tukey HSD test. If a letter is shared between regions, there is no significant difference between them in the measured variable
We have discovered considerable diversity in simple measures of size and shape among scales from different regions of the body of bigeye tuna and a remarkable trabecular structure in thickened anterior scales. Generally, larger scales occur on the cheek and corselet of bigeye tuna, while smaller scales occur posteriorly on the body. The larger scales of the cheek and corselet, along with some smaller scales at the base of the tail, have a distinct bony shell made of cellular bone and an internal structure of fat cells, trabeculae, and circulatory elements. These scales represent an interesting departure from normal teleost scales which consist of flat sheets of acellular bone, and the function of these modified scales represents an intriguing area for future research.
ACKNOWLEDGMENTS
We would like to acknowledge William Goldsmith for his expertise on tunas, Cathy MacGillivray and the Harvard Department of Stem Cell and Regenerative Biology's Histology-Immunohistochemistry Core for aid with histology, Toby Arakawa for his assistance in obtaining specimens, Ryan Hulett for his microscopy expertise, Dan Madigan for proofreading, and the comments of two anonymous reviewers. This work was supported by ONR MURI Grant N000141410533 monitored by Dr. Bob Brizzolara and NSF GRF 2014162421 awarded to DKW.
AUTHOR CONTRIBUTIONS
DKW and GVL conceived the research. DKW and SI led data collection and DKW led the writing of the manuscript. All authors contributed to the manuscript and gave approval for publication.


