Identification of small extracellular vesicle subtypes in follicular fluid: Insights into the function and miRNA profiles
Abstract
The study of small extracellular vesicles (sEVs) heterogeneity is one of the main problems that must be solved, and the different sEV subtypes in follicular fluid are still unclear, limiting our understanding of their function. This study first separated sEV subtypes from follicular fluid using differential ultracentrifugation combined with iodixanol density gradient flotation and then evaluated their miRNA profile and effects on the proliferation and apoptosis of granulosa cells (GCs). We also performed Gene Ontology and Kyoto Encyclopedia of Genes and Genomes (KEGG) analysis of potential target genes of differentially expressed miRNAs (DEMs) and KEGG analysis of potential target genes of non-DEMs. Low-density sEVs (sEV_F6) were enriched in TSG101, while high-density sEVs (sEV_F8) were enriched in CD63. The miRNA profiles of sEV_F6 and sEV_F8 were heterogeneous, and the differential signaling pathways were mainly related to the adhesion and hypoxic stress pathways, while the same signaling pathways were mainly related to cell proliferation, apoptosis, cell cycle, and autophagy pathways. In addition, the highly expressed miRNAs in both subtypes were mainly related to cell proliferation and apoptosis. Both subtypes transferred their miRNAs into GCs and promoted the proliferation ability of the GCs and inhibited their apoptosis. The results showed for the first time that there are different subtypes of sEVs in follicular fluid and that the miRNA profiles of subtypes are heterogeneous.
1 INTRODUCTION
Cells communicate with neighboring or distant cells by secreting extracellular vesicles (EVs) to transfer proteins, lipids, and nucleic acids to recipient cells. “EVs” is a collective term for vesicles with membrane structures that are secreted by almost all types of cells. Cells secrete different types of EVs. EVs are mainly divided into three major categories based on the size, biological characteristics, and formation process: exosomes, microvesicles (MVs), and apoptotic bodies. (Shao & Im, 2018; Willms et al., 2018). Exosomes are formed by the endosome system and are released by cells through fusion of multivesicular endosomal compartments (MVBs) and the plasma membrane (Y. Lee et al., 2012). They have a relatively uniform size distribution, with a diameter of 30–150 nm (Gurunathan et al., 2019). MVs are formed by the emergence of cells with a diameter of 100–1000 nm, while membrane-encapsulated vesicles formed by cells during apoptosis, with a diameter of 500–2000 nm, are called apoptotic bodies (Gurunathan et al., 2019; Willms et al., 2018). EVs from different intracellular sources may have different functional characteristics (Kanada et al., 2015; Sedlik et al., 2014), and the mixed nature of EVs has led to an increasing number of studies reporting contradictory EV functions and clinical applications, making it important to address the heterogeneity of EVs. A previous study reported that different EVs released by immature dendritic cells (DCs) have different capabilities in orienting T helper cell responses(Tkach et al., 2017). The authors believe that all studies that claim that EVs play a key role in pathological/physiological systems should fully compare the functions of different EV subtypes.
The commonly used EV separation and purification methods include differential ultracentrifugation (Lobb et al., 2015; Théry et al., 2006), density gradient flotation (P. Li et al., 2017; Miranda et al., 2014), immunoaffinity capture (Zarovni et al., 2015), polymer precipitation (Zeringer et al., 2015), size-exclusion chromatography (Böing et al., 2014), ultrafiltration (Cheruvanky et al., 2007), and microfluidic separation (K. Lee et al., 2015), of which differential ultracentrifugation and sucrose/iodixanol density gradient flotation are still the most commonly used. Each technique has its unique advantages and disadvantages. Using differential ultracentrifugation and sucrose/iodixanol density gradient flotation, Théry et al. showed for the first time that different EV subtypes secreted via different intracellular mechanisms exist in exosomes (Bobrie et al., 2012). They also found that human DCs can secrete EVs of different sizes and intracellular origin, and defined new markers to characterize heterogeneous populations of EVs subtypes by proteomic comparison (Kowal et al., 2016).
Body fluids contain a large heterogeneous population of EVs. The large extracellular vesicles (lEVs) in plasma-derived EVs of tumor patients carry almost all circulating DNA in plasma (Vagner et al., 2018). The follicular fluid of some mammals, such as humans, bovines, pigs, and horses, contains EVs (da Silveira et al., 2012; da Silveira et al., 2014; Matsuno et al., 2017; Navakanitworakul et al., 2016). The concentration of EVs in follicular fluid decreases as the size of the follicle increases (Navakanitworakul et al., 2016). EV-mediated transport is a new communication mechanism between oocytes and follicular somatic cells. microRNA (miRNA) is one of the biologically active components of EVs. EVs can regulate the physiological functions of receptor cells by transferring miRNA. The miRNA carried by follicular fluid EVs is taken up by cultured granulosa cells (GCs), indicating that it can be used as a cell-cell communication pathway in follicles (da Silveira et al., 2014; Navakanitworakul et al., 2016). Small RNA sequencing (RNA-Seq) has shown that miRNA carried by small follicular fluid EVs is mainly related to cell proliferation, while miRNA carried by large follicular fluid EVs is mainly related to the inflammatory response(Navakanitworakul et al., 2016). As specific miRNAs in follicular fluid EVs are related to follicular development and oocyte maturation, these EVs can also be used as a potential diagnostic tool for assisted reproduction.(Giacomini et al., 2020).
EVs are a mixture of heterogeneous vesicles with different functions. Studies on follicular fluid EVs have all used a mixed preparation of sEVs obtained by centrifugation at 100,000g at least, but so far, there are no studies on whether follicular fluid sEVs have different heterogeneous subgroups. This study confirmed the existence of sEVs subtypes in follicular fluid. This study first separated sEV subtypes from follicular fluid using differential ultracentrifugation combined with iodixanol density gradient flotation and then evaluated their miRNA profile and effects on the proliferation and apoptosis of GCs. We also performed Gene Ontology (GO) and Kyoto Encyclopedia of Genes and Genomes (KEGG) analysis of potential target genes of differentially expressed miRNAs (DEMs) and KEGG analysis of potential target genes of non-DEMs. The results of this study will lay the groundwork for future research on the specific miRNA functions of different sEV subtypes.
2 MATERIALS AND METHODS
2.1 Reagents
Rabbit anti-β-actin was from Cell Signaling Technology, Inc. Rabbit anti-TSG101 antibody (ab125011), mouse anti-CD63 antibody (ab193349), rabbit anti-GRP94(GP96) antibody (ab13509) and rabbit anti-Actinin4 antibody (ab108198) were from Abcam. Goat anti-rabbit secondary antibody was from Beyotime Institute of Biotechnology. DAPI Staining Solution, QuickBlock™ Blocking Buffer and radioimmunoprecipitation assay buffer were from Beyotime Institute of Biotechnology. Direct-zol™ RNA Miniprep was from Zymo Research. Mir-X miRNA First-Strand Synthesis Kit and SYBR Premix ExTaq II were purchased from Takara Inc.
2.2 Follicular fluid collection and EV isolation
Bovine ovaries were provided by a local abattoir in Xi'An, China, as described by X. Wang et al. (2019). We selected ovaries without a corpus luteum (CL). We aspirated the follicular fluid of small follicles (3–5 mm) using sterile injection syringes, as previously described (Hung et al., 2015, 2017). Using a modified method, we diluted 30 ml of the follicular fluid with 1:1 phosphate-buffered saline (PBS) and centrifuged it at 300g for 30 min to form a cell pellet. Next, the supernatant was centrifuged at 2000g for 20 min, transferred to a new centrifugal tube for centrifugation at 12,000g for 45 min (10,000 rpm, 12k centrifugation speed-sedimented pellet = lEVs) (CR22GIII; Hitachi), and then centrifuged again at 110,000g in a P28S rotor for 90 min (24,700 rpm, 110k centrifugation speed-sedimented pellet = sEVs) (CP100WX; Hitachi). The 12k and 110k centrifugation speed = sedimented pellets were resuspended in PBS and re-isolated at the same speed, and the final pellet was resuspended with sterile PBS.
2.3 Cell culture and treatment of GCs
We aspirated the GCs of small follicles (3–5 mm) from ovaries without a CL using sterile injection syringes; we selected tightly structured, grayish GCs and discarded loosely structured, darkened GCs and cumulus-oocyte complexes under a stereomicroscope (Nikon). After centrifugation at 1000 rpm for 5 min, we cultured the GCs in McCoy's 5 A medium containing 10 ng/ml of insulin, 10 mM 4-(2-hydroxyethyl)−1-piperazineethanesulfonic acid (HEPES), 5 μg/ml of transferrin, 5 ng/ml of selenium, 0.1% bovine serum albumin (BSA), 30 ng/ml of androstenedione, 1% antibiotic-antimycotic solution, 30 ng/ml of follicle-stimulating hormone, and 10% fetal bovine serum (FBS), as previously described. After 24 h, we replaced the medium with fresh medium without FBS. After incubation with or without 100 μg/ml of EVs for 24 h, we used the cells for miRNA expression or apoptosis analysis. The cells were also plated either in 35 mm cell culture dishes at a density of 1 × 10⁶ cells/well for EV uptake analysis or in 96-well plates at a density of 2 × 10⁴ cells/well for cell proliferation analysis.
2.4 Iodixanol gradient separation
Density gradient separation was using a modified method (Kowal et al., 2016). Briefly, we prepared a buffer containing 0.25 M sucrose and TE buffer (10 mM Tris pH 8.0, 1 mM ethylenediaminetetraacetic acid [EDTA; pH 7.4]) and adjusted the pH to 7.4. Next, we diluted 60% of iodixanol stock solution (OptiPrep™ Density Gradient Medium; Sigma-Aldrich) with the configured buffer solution and configured 40%, 20%, 10%, and 5% of iodixanol working solution. We resuspended 110k pellets obtained by ultracentrifugation in 3 ml of of 40% iodixanol working solution and transferred them to a centrifuge tube (344059; Beckman Coulter). Subsequently, we carefully added 3 ml of 20% iodixanol, 3 ml of 10% iodixanol, and 2 ml of 5% iodixanol above the suspension using a 1 ml sterile syringe and centrifuged the tubes at 250,000g for 10 h at 4°C using the SW 41Ti (Optima XPN-100; Beckman Coulter). After centrifugation, we collected 11 fractions from the top of the tube: 1.5 ml was recovered for fraction 6 (sEV_F6) and fraction 8 (sEV_F8) and 1 ml for other fractions. Density was assessed using a DMA 4100 M refractometer (Anton Paar). Finally, we resuspended the recovered components in PBS, centrifuged them at 110,000 × g for 2 h in Type90Ti (Optima XPN-100; Beckman Coulter), resuspended the final pellet in 100 µL of sterile PBS, and stored it at –80°C until further analysis.
2.5 Western blot analysis
We lysed the cells obtained by centrifugation at 300g on a cell lysate (Beyotime Institute of Biotechnology) on ice for 30 min and centrifuged them at 13,000g for 15 min. We assayed the protein content of the cell lysate and EV preparations using Coomassie brilliant blue (TransGen Biotech). After adding 1/4 volume of 5 × SDS to the remaining sample, we boiled it at 100°C for 10 min and stored it at –80°C. The samples (5 μg of protein) were transferred to polyvinylidene difluoride (PVDF) membranes (Millipore) after being separated by 10% acrylamide sodium dodecyl sulfate polyacrylamide gel electrophoresis. Moderate blocking buffer (QuickBlock™ Blocking Buffer for Western Blot, Beyotime Institute of Biotechnology) was used to blocking the PVDF membranes. Next, the samples were incubated with the following primary antibodies overnight at 4°C: rabbit anti-β-actin (Cell Signaling Technology), rabbit anti-TSG101 antibody (Abcam), mouse anti-CD63 antibody (Abcam), rabbit anti-GRP94(GP96) antibody (Abcam), and rabbit anti-Actinin4 antibody (Abcam). The samples were then incubated with secondary antibodies (Beyotime Institute of Biotechnology) for 2 h. After adding a chemiluminescence reagent (BeyoECL Moon, Beyotime Institute of Biotechnology), we analyzed the PVDF membranes using the ChemiDocTM MP Imaging System (Bio-Rad Laboratories) with Image Lab™ software.
2.6 Nanoparticle tracking analysis
We diluted the sEVs to 800–1000 ml with PBS and mixed them well using a vortex mixer. The diluted samples were tested on the machine (Malvin Nanosight NS300), and injected three times for 30 s each time. We performed data analysis using NTA2.3 analysis software and analyzed the samples using manual shutter and gain adjustment. The shutter speed was 15 or 30 ms, the camera gain between 280 and 560, and the detection threshold above 2.
2.7 Transmission electron microscopy
We resuspended the EVs obtained by centrifugation in 20–30 μl of PBS, pipetted 10 μl of a sample, added it to a copper mesh for 1 min to precipitate, and then removed the floating liquid with filter paper. Next, we added 10 μl of 2% uranyl acetate dropwise to the copper mesh for 1 min to precipitate, removed the floating liquid with filter paper, and kept the copper mesh overnight at room temperature. Finally, the samples were observed under a transmission electron microscope (TEM, HT7700, 80 kV; Hitachi) at 80 kV (Z. Liu et al., 2018).
2.8 Small RNA sequencing
We performed small RNA-Seq on two EV subtypes: sEV_F6, and sEV_F8. First, we detected the RNA concentration and quality of RNA extracted from EVs using the Agilent 2100 bioanalyzer system (Agilent Technologies GmbH). After the quality inspection was passed, we performed small RNA-Seq using the BGISEQ-500 platform (BGISEQ UMI Small RNA Technology; BGI Group), which introduces a unique molecular identifier (UMI) when a library is constructed. The total RNA samples that passed the quality inspection were purified using magnetic beads to isolate small RNA in the range of the target fragment at the 3ʹ end. We attached the adaptor, added reverse-transcription (RT) primers with the UMI, hybridized them with the 3ʹ-end adaptor (hybridized the free adaptor fragments at the same time), and then attached the adaptor at the 5ʹ end to form an RT system. The RT primer was guided with the UMI, and one strand of complementary DNA (cDNA) was obtained. We used polymerase to amplify the cDNA and enriched cDNA containing both ends of the adapter to amplify the library yield. We took an appropriate amount of the amplified product for single-strand separation and circularization and subjected the circularized library to rolling circle amplification to generate DNA nanoballs (DNBs). After quality control, it was sequenced on the machine. We processed the 49 nt sequence obtained by sequencing through delinking, low quality, and decontamination to complete data processing for obtaining a credible backup analysis target sequence and to perform sequence length distribution statistics and common sequence statistics between samples. Next, we classified and annotated the cleaned-up target sequence to obtain information about the components and expression levels contained in the sample. We tested six samples in this study, and each sample produced, on average, 24.0 M data. The average alignment rate of the sample alignment genome was 91.63%. We detected 444 small RNAs.
2.9 GO and KEGG pathway analysis
Finding potential target genes of miRNA is necessary for subsequent analysis. For more accurate results, we used RNAhybrid, miRanda, and TargetScan to predict target genes and combined the free energy, score value, and other corresponding filter conditions for filtering. We used the DAVID website for GO analysis. According to the KEGG pathway annotation classification, we used the phyper function in R software to perform enrichment analysis. We calculated the p value and then performed false discovery rate correction on it. Generally, the function with Q-value ≤ 0.05 is considered significant enrichment.
2.10 Construction of a protein–protein interaction (PPI) network and candidate miRNA-hub gene regulatory network
We performed PPI network analysis on target genes enriched in the two pathways using the STRING website and also performed hub gene analysis using Cytoscape MCODE (node score cut-off = 0.2; max. depth = 100; k-core = 4). Next, we screened the miRNAs targeting these hub genes (relation score ≥ 2) in two significantly upregulated miRNA subgroups and constructed a miRNA–mRNA regulatory network using Cytoscape version 3.6.1.
2.11 Quantitative reverse-transcription polymerase chain reaction (RT-qPCR)
We extracted total RNA from the EVs using Direct-zol™ RNA Miniprep (Zymo Research) and reverse-transcripted it using the Mir-X miRNA First-Strand Synthesis Kit (Takara Bio). The reverse primer is a universal primer, and Table 3 lists the specific forward primer sequences. Next, we performed quantitative polymerase chain reaction (qPCR) using SYBR Premix ExTaq II (Takara Bio) and the CFX96 real-time system (Bio-Rad Laboratories).
2.12 EV uptake analysis
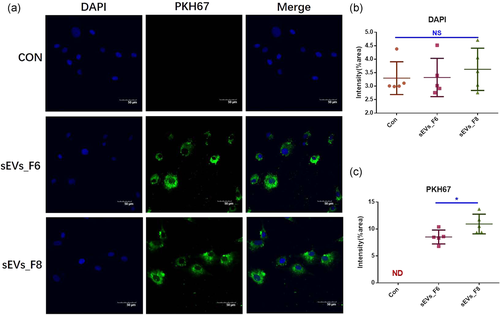
We treated GCs with 10 μg of PKH67-labeled EVs for 24 h using the PKH67 Fluorescent Cell Linker Kit (Sigma-Aldrich) according to the manufacturer's instructions. The GCs were then washed three times with PBS and incubated with 4′,6-diamidino-2-phenylindole (DAPI) staining solution (Beyotime Institute of Biotechnology). Finally, we analyzed the EV uptake using confocal microscopy (Olympus FV3000) and ImageJ software.
2.13 Cell proliferation and apoptosis assays
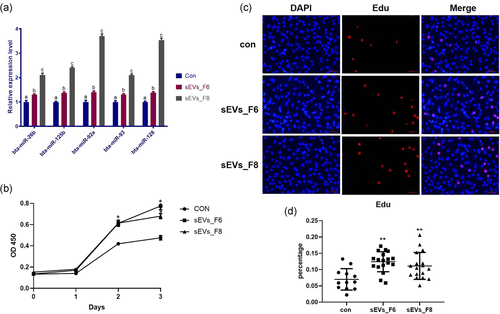
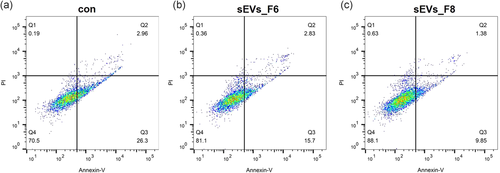
We evaluated the cell proliferation ability using a TransDetect Cell Counting Kit (TransGen Biotech) and a Cell-Light EdU Apollo 567 (RiboBio) according to the manufacturer's protocol. Cell count and fluorescence intensity analysis were performed with ImageJ software. After treating the GCs with EVs for 24 h, we evaluated the apoptosis quantity using the Annexin V–FITC Apoptosis Detection Kit (Jiangsu keyGen Biotech Co., Ltd.) according to the manufacturer's protocol. The status of cell apoptosis was assessed by flow cytometry. All data were analyzed using FlowJo software.
2.14 Statistical analysis
For each experiment, we used a different batch of ovaries and performed three replicates each time. The t-test and one-way analysis of variance were performed using SPSS Statistics version 20.0. Values were expressed as the mean ± standard error of the mean, and p < .05 or p < .01 was considered statistically significant.
3 RESULTS
3.1 Bovine follicular fluid contains EVs of different sizes
In this study, we analyzed EVs from follicular fluid isolated from bovine small follicles (3–5 mm). As previously described, 12k (12,000g) and 110k (110,000g) centrifugation speed-sedimented pellets were resuspended in PBS and recentrifuged; these pellets were named lEVs and sEVs, respectively (Figure 1a). There was no significant difference in the protein content between lEVs and sEVs (Figure 1b).
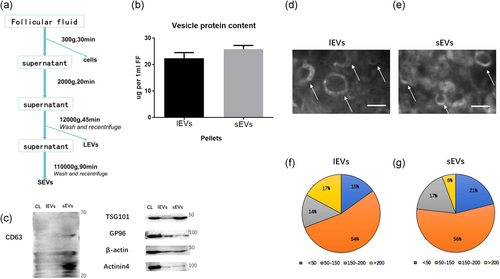
Next, we identified the expression of several protein markers using western blot analysis. CD63 and TSG101 were significantly overexpressed in sEVs, GP96 in lEVs, and β-actin and actinin4 only in the CL (Figure 1c). Electron microscopy results showed that isolated EVs have a typical cup-shaped morphology (Figure 1d,e), and the vesicle content in sEVs less than 150 nm was higher than that in lEVs (Figure 1f,g).
3.2 Iodixanol density gradient flotation separates sEV subtypes
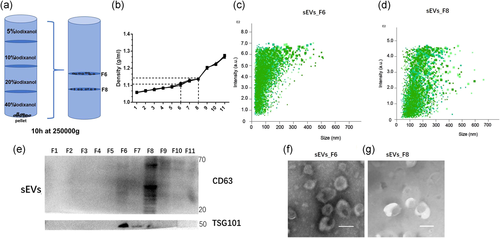
EV characterization and miRNA analysis are mandatory for cleaning EVs from other elements. We performed further separation and purification using iodixanol density gradient flotation to purify sEVs. We resuspended sEV pellets in 40% iodixanol. After preparing the density gradient (Figure 2), we centrifuged the pellets at 250,000g and recovered 11 fractions from top to bottom; the vesicles were mainly concentrated in sEV_F6 and sEV_F8 (Figure 2a) (Figure 2a). The density of sEV_F6 was 1.113 g/ml, while that of sEV_F8 was 1.146 g/ml, on average, of iodixanol (Figure 2b). Nanoparticle tracking analysis (NTA) and statistics showed that most vesicles in sEVs-F6 are 30–100 nm in diameter and in sEVs-F8 50–150 nm in diameter (Figure 2c,d). We used western blot analysis to quantify CD63 and TSG101 expression in two different fractions. CD63 expression was significantly higher in sEV_F8, and TSG101 expression was significantly higher in sEV_F6 (Figure 2e). Electron microscopy results showed that isolated sEVs have a typical cup-shaped morphology and that they are small and uniform in size (Figure 2f,g). Results indicated that iodixanol gradient flotation enhanced the quality of sEV subtypes.
3.3 Small RNA sequencing showed different expression levels of miRNA in sEVs subtypes
Using iodixanol density gradient flotation, we successfully separated two sEV subtypes with different sizes and densities and containing different marker proteins. Next, we performed miRNA sequencing analysis on two sEV subtypes. Most miRNAs were 20–24 nt long, in which the 22 nt length was most abundant (Figure 3a). The Venn diagram showed that of the 444 miRNAs we detected, 335 are expressed in two factions, with both factions having their own specific expressed miRNAs (Figure 3b). The fold-change and Q-value proved that the miRNA expression between sEV_F6 and sEV_F8 is significantly different (Figure 3c). The heat map showed that the DEMs and the number of overexpressed miRNAs in sEV_F6 are higher (the amount of expression in the heat map gradually increased from blue to red) (Figure 3d). Compared to sEV_F6, 76 miRNAs were significantly upregulated and 112 significantly downregulated in sEV_F8 (|log2(FC)| > = 1; Q-value < 0.001) (Table 1).
| DE miRNAs | Gene ID |
|---|---|
| sEVs_F6 | bta-miR-26c bta-let-7c bta-let-7d bta-let-7b bta-miR-151-5p bta-miR-7 bta-miR-34a bta-miR-16b bta-miR-15b bta-miR-497 bta-miR-16a bta-miR-125b bta-miR-449a bta-miR-204 bta-miR-574 bta-miR-127 bta-miR-3601 bta-miR-31 bta-miR-195 bta-let-7e bta-miR-139 bta-miR-342 bta-miR-125a bta-miR-30d bta-miR-224 bta-miR-3432a bta-miR-379 bta-miR-28 bta-miR-21-5p bta-miR-455-3p bta-miR-199b bta-miR-145 bta-miR-199a-5p bta-miR-193a-3p bta-miR-1271 bta-miR-103 bta-miR-30e-5p bta-miR-200a bta-miR-33a bta-miR-507b bta-miR-362-5p bta-miR-181b bta-miR-339a bta-miR-135a bta-miR-340 bta-miR-153 bta-miR-491 bta-miR-196b bta-miR-339b bta-miR-2387 bta-miR-12023 bta-miR-182 bta-miR-345-5p bta-miR-148c bta-miR-708 bta-miR-181d bta-miR-23b-3p bta-miR-29b bta-miR-96 bta-miR-500 bta-miR-206 bta-miR-29c bta-miR-769 bta-miR-2898 bta-miR-2320-5p bta-miR-495 bta-miR-223 bta-miR-331-3p bta-miR-141 bta-miR-2284t-3p bta-miR-1260b bta-miR-2904 bta-miR-27a-5p bta-miR-23b-5p bta-miR-1249 bta-let-7i bta-miR-26a bta-miR-26b bta-miR-98 bta-miR-374b bta-miR-3604 bta-miR-411a bta-miR-126-3p bta-miR-10174-3p bta-miR-99b bta-miR-30b-5p bta-miR-155 bta-miR-507-3p bta-miR-30c bta-miR-450a bta-miR-451 bta-miR-17-5p bta-miR-3613a bta-miR-181a bta-miR-151-3p bta-miR-30a-5p bta-miR-1 bta-miR-374a bta-miR-383 bta-miR-194 bta-miR-126-5p bta-miR-6120-3p bta-miR-30f bta-miR-2336 bta-miR-376b bta-miR-6119-5p bta-miR-450b bta-miR-411b bta-miR-505 bta-miR-411c-3p bta-miR-2285bfbta-miR-142-5p |
| sEVs_F8 | bta-miR-92a bta-miR-424-5p bta-miR-6123 bta-miR-93 bta-miR-660 bta-miR-128 bta-miR-19b bta-miR-10b bta-miR-2284y bta-miR-335 bta-miR-380-3p bta-miR-2284x bta-let-7a-3p bta-miR-2284ab bta-miR-423-5p bta-miR-1307 bta-miR-20a bta-miR-423-3p bta-miR-484 bta-miR-2299-3p bta-miR-425-3p bta-miR-152 bta-miR-2285av bta-miR-130a bta-miR-410 bta-miR-671 bta-miR-369-3p bta-miR-382 bta-miR-19a bta-miR-376a bta-miR-2284aa bta-miR-2483-3p bta-miR-2284w bta-miR-2285y bta-miR-138 bta-miR-11986b bta-miR-6522 bta-miR-6517 bta-miR-2285bc bta-miR-760-3p bta-miR-12031 bta-miR-2285ci bta-miR-2313-3p bta-miR-130b bta-miR-2284h-5p bta-miR-2285u bta-miR-132 bta-miR-767 bta-miR-188 bta-miR-2285aj-5p bta-miR-2285ak-5p bta-miR-2382-5p bta-miR-376d bta-miR-2285bz bta-miR-1197 bta-miR-2285m bta-miR-2285p bta-miR-2376 bta-miR-409b bta-miR-365-5p bta-miR-326 bta-miR-2382-3p bta-miR-323b-3p bta-miR-6536 bta-miR-3154 bta-miR-9851 bta-miR-2367-3p bta-miR-656 bta-miR-20b bta-miR-2285be bta-miR-124a bta-miR-346 bta-miR-124b bta-miR-2284m bta-miR-12015 bta-miR-2450a |
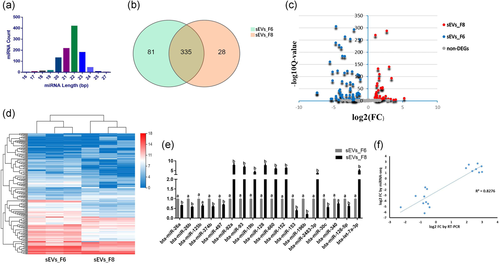
We analyzed the relative expression levels of eighteen randomly selected high- or low-expressed miRNAs by RT-qPCR (Figure 3e). The expression trend of the selected miRNA has a high consistency with the RNA-Seq analysis (Figure 3f).
3.4 GO and KEGG analysis of potential target genes of differentially expressed miRNAs
GO analysis included biological process (BP), cellular component (CC), and molecular function (MF) analyses and Table 2 lists the top five enriched GO items. For BP analysis, potential target genes of DEMs were mainly involved in cellular metabolism. For CC analysis, potential target genes were mainly located in the cytoplasm, the intracellular part, membrane-bound organelles, and intracellular membrane-bound organelles. For MF analysis, potential target genes mainly showed protein binding, catalytic activity, and transferase activity.
| Expression | Category | Term | Count | % | P value | FDR |
|---|---|---|---|---|---|---|
| sEV_F6 | GOTERM_BP | GO:0009987~cellular process | 890 | 44.01 | 4.31E − 20 | 7.84E − 17 |
| GOTERM_BP | GO:0044237~cellular metabolic process | 585 | 28.93 | 2.00E − 15 | 3.63E − 12 | |
| GOTERM_BP | GO:0044238~primary metabolic process | 617 | 30.51 | 8.05E − 14 | 1.46E − 10 | |
| GOTERM_BP | GO:0008152~metabolic process | 715 | 35.36 | 1.89E − 13 | 3.43E − 10 | |
| GOTERM_BP | GO:0044260~cellular macromolecule metabolic process | 436 | 21.56 | 2.01E − 12 | 3.66E − 9 | |
| GOTERM_CC | GO:0005737~cytoplasm | 664 | 32.83 | 3.61E − 26 | 5.17E − 23 | |
| GOTERM_CC | GO:0044424~intracellular part | 912 | 45.10 | 5.83E − 26 | 8.34E − 23 | |
| GOTERM_CC | GO:0043227~membrane-bounded organelle | 707 | 34.96 | 6.49E − 23 | 9.29E − 20 | |
| GOTERM_CC | GO:0043231~intracellular membrane-bounded organelle | 705 | 34.86 | 1.14E − 22 | 1.63E − 19 | |
| GOTERM_CC | GO:0043226~organelle | 765 | 37.83 | 2.45E − 17 | 3.51E − 14 | |
| GOTERM_MF | GO:0005515~protein binding | 724 | 35.80 | 4.46E-30 | 7.15E − 27 | |
| GOTERM_MF | GO:0005488~binding | 1178 | 58.25 | 1.25E − 19 | 2.01E − 16 | |
| GOTERM_MF | GO:0003824~catalytic activity | 582 | 28.78 | 1.57E − 6 | 0.0025 | |
| GOTERM_MF | GO:0016740~transferase activity | 212 | 10.48 | 1.12E − 5 | 0.017 | |
| sEV_F8 | GOTERM_BP | GO:0009987~cellular process | 643 | 46.23 | 6.01E − 19 | 1.07E − 15 |
| GOTERM_BP | GO:0044238~primary metabolic process | 439 | 31.56 | 5.89E − 11 | 1.05E-7 | |
| GOTERM_BP | GO:0044237~cellular metabolic process | 409 | 29.40 | 1.55E − 10 | 2.76E-7 | |
| GOTERM_BP | GO:0008152~metabolic process | 503 | 36.16 | 9.05E − 10 | 1.61E − 6 | |
| GOTERM_BP | GO:0044260~cellular macromolecule metabolic process | 305 | 21.93 | 1.25E-8 | 2.23E − 5 | |
| GOTERM_CC | GO:0044424~intracellular part | 690 | 49.60 | 7.29E − 29 | 1.03E − 25 | |
| GOTERM_CC | GO:0005737~cytoplasm | 500 | 35.94 | 6.36E − 25 | 8.99E − 22 | |
| GOTERM_CC | GO:0005622~intracellular | 730 | 52.48 | 6.39E − 21 | 9.05E − 18 | |
| GOTERM_CC | GO:0043231~intracellular membrane-bounded organelle | 515 | 37.02 | 3.43E − 18 | 4.85E − 15 | |
| GOTERM_CC | GO:0043227~membrane-bounded organelle | 515 | 37.02 | 5.25E − 18 | 7.43E − 15 | |
| GOTERM_MF | GO:0005515~protein binding | 498 | 35.80 | 3.46E − 19 | 5.43E − 16 | |
| GOTERM_MF | GO:0005488~binding | 824 | 59.24 | 1.26E − 14 | 1.98E − 11 | |
| GOTERM_MF | GO:0003824~catalytic activity | 415 | 29.83 | 3.90E − 6 | 0.006 | |
| GOTERM_MF | GO:0016740~transferase activity | 156 | 11.21 | 1.05E − 5 | 0.016 | |
| GOTERM_MF | GO:0042802~identical protein binding | 45 | 3.24 | 1.07E − 5 | 0.017 |
| Gene | Primers (5ʹ− 3ʹ) |
|---|---|
| bta-miR-125b | TCCCTGAGACCCTAACTTGTG |
| bta-miR-128 | TCACAGTGAACCGGTCTCT |
| bta-miR-19b | TGTGCAAATCCATGCAAAACTG |
| bta-miR-26a | GTTCAAGTAATCCAGGATAGGC |
| bta-miR-26b | CGGTTCAAGTAATTCAGGATAGGT |
| bta-miR-374b | CGGATATAATACAACCTGCTAAGT |
| bta-miR-497 | CAGCAGCACACTGTGGTTTGT |
| bta-miR-660 | TACCCATTGCATATCGGAGCT |
| bta-miR-92a | TATTGCACTTGTCCCGGCCT |
| bta-miR-93 | CAAAGTGCTGTTCGTGCAGGT |
| bta-miR-152 | TCAGTGCATGACAGAACTTGG |
| bta-miR-153 | GCGTTGCATAGTCACAAAAGTGATC |
| bta-miR-196b | TAGGTAGTTTCCTGTTGTTGGGA |
| bta-miR-2483-3p | GAAACATCTGGTTGGTTGAGAGA |
| bta-miR-30c | GCTGTAAACATCCTACACTCTCAGC |
| bta-miR-340 | GTCCGTCTCAGTTACTTTATAGCC |
| bta-miR-126-5p | GCGCATTATTACTTTTGGTACGCG |
| bta-let-7a-3p | GCGGCTATACAATCTACTGTCTTTC |
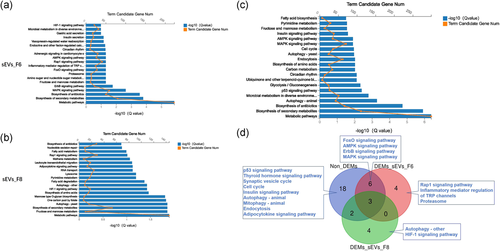
Except for metabolism-related pathways, the inflammatory mediator regulation of TRP channels, and proteasome, the potential target genes of upregulated miRNAs in sEV_F6 were significantly enriched in signal transduction pathways, such as the mitogen-activated protein kinase (MAPK), ErbB, Forkhead box O (FoxO), Ras-related protein 1 (Rap1), and 5ʹ adenosine monophosphate–activated protein kinase (AMPK) signaling pathways (Figure 4a). In addition, except metabolism-related pathways, the cellular process by which the potential target genes of upregulated miRNAs in sEV_F8 were significantly enriched was autophagy, and the signal transduction pathway was the hypoxia-inducible factor 1 (HIF-1) signaling pathway (Figure 4b).
3.5 KEGG analysis of potential target genes of non- differentially expressed miRNAs
Except for metabolism-related pathways, the cellular process by which the potential target genes of non-DEMs were significantly enriched were autophagy, the p53 signaling pathway, endocytosis, and the cell cycle. The organismal system was the insulin signaling pathway, and the signal transduction pathways were MAPK, AMPK, ErbB, and FoxO signaling pathways (Figure 4c). The Venn diagram showed that the signal transduction pathway specifically enriched for potential target genes of the highly expressed miRNA was the Rap1 signaling pathway in DEM_sEV_F6 and the HIF-1 signaling pathway in DEM_sEV_F8 (Figure 4d).
3.6 sEVs subtypes can deliver their miRNAs into granulosa cells
Next, we tested the EV uptake efficiency of GCs. The surface of the EVs was marked with PKH67. Both sEV_F6 and sEV_F8 were effectively absorbed by GCs (Figure 5).
3.7 Effects of sEV subtypes on granulosa cell proliferation and apoptosis
The miRNA expression in GCs significantly increased (Figure 6a). Both sEV_F6 and sEV_F8 significantly promoted GC proliferation (Figure 6b–d). After 24 h of treatment, we detected the apoptosis of GCs using flow cytometry. Results showed that both sEV_F6 and sEV_F8 significantly inhibited the apoptosis of GCs, especially the early stage of apoptosis (Figure 7).
3.8 Analysis of candidate miRNA-hub gene regulatory network
The hub genes of the Rap1 signaling pathway were IGF1, FGF18, FLT1, HGF, TEK, and CRK; Figure S1a–c shows the potential miRNA–mRNA regulatory network established. The hub genes of the HIF-1 signaling pathway were TCEB1, CUL2, EGLN3, HIF1A, and RBX1; Figure S1d–f shows the potential miRNA–mRNA regulatory network established.
4 DISCUSSION
In this study, we isolated EVs using differential ultracentrifugation and named the EVs obtained by centrifugation at 12,000g and 110,000g as lEVs and sEVs, respectively, as recommended by the International Society for Extracellular Vesicles (Lötvall et al., 2014; Théry et al., 2018). Four transmembrane protein family members CD63, TSG101 in ESCRT-I/ESCRT-II/ESCRT-III, and β-actin were selected to validate transmembrane proteins, with lipid or membrane protein-binding ability and promiscuous incorporation in the cytoskeleton of isolated EVs. We also validated the EV subtype-related proteins (GP96) Grp94 and Actinin4. Similar to previous studies, CD63 and TSG101 were significantly overexpressed in sEVs, while β-actin was significantly overexpressed in the CL. However, as lEV-related proteins GP96 and Actinin4, only Gp96 was significantly overexpressed in lEVs compared to sEVs, and Actinin4 was significantly overexpressed in the CL, probably because the protein expression of EVs is different in different species, tissues, and cells. In this study, the morphology of EVs observed by transmission electron microscopy had a typical cup-shaped structure, further indicating the existence of EVs in our isolated pellets. Although the results of particle size analysis showed that the vesicle content of sEVs less than 150 nm was higher than that of lEVs, there was still a significant size overlap. By comparing with lEVs and the CL, we successfully obtained a mixed sEV formulation. We then performed iodixanol density gradient flotation for further separation and purification of the isolated sEVs.
Iodixanol density gradients centrifugation is a classic means to separate vesicles according to the floatation speed and density. to achieve better purification of EVs, this study used different concentrations of OptiPrep iodixanol buffer to achieve different density distributions, and the vesicles meeting this density interval were screened out by the centrifugal balance method. The EVs we recovered were mainly concentrated in fractions F6 and F8. Although the occupied fractions F6 and F8 were different from those in previous studies, the densities were the same as those in previous studies (Kowal et al., 2016) indicating that although we used different centrifugation methods for OptiPrep iodixanol buffer concentration, different EVs still float up to the position corresponding to their own density. However, a previous study did not isolate two different fractions of F6 and F8. The reason probably was that although we used the same concentration of OptiPrep iodixanol buffer, the vesicle composition, and centrifugation method may somewhat affect the vesicle stratification results (K. Li et al., 2018). In this study, we isolated different sEV subtypes using iodixanol density gradient flotation and sequenced and analyzed their miRNAs.
CD63 expression was significantly higher in sEV_F8, while TSG101 expression was significantly higher in sEV_F6, indicating that in bovine follicular fluid EVs, CD63 may be the marker protein of sEV_F8, while TSG101 may be the marker protein of sEV_F6. The theory supporting this phenomenon may be that previous studies have shown that TSG101 shows high expression in CD9+ vesicles and low expression in CD63+/CD81+ vesicles (Jeppesen et al., 2019). CD63 is a marker protein of classical exosome, and TSG101 is a marker protein of arrestin-domain-containing protein 1 (ARRDC1)-mediated microvesicle (ARMM) (Q. Wang & Lu, 2017). Both classical exosomes and ARMMs are sEVs, but their biogenesis is different. Classical exosomes come from the multivesicular endosome, while ARMMs come from plasma membrane budding, which belongs to MVs. The vesicle size of ARMMs is smaller compared to classical exosomes, which is consistent with our particle size results, indicating that most of the EVs in sEV_F6 may be ARMMs, while most of the EVs in sEV_F8 may be classical exosomes.
We detected 444 miRNAs in six samples, and 335 of the two EV subtypes co-expressed miRNAs, in addition to their own specific expression. However, the expression levels of most of the specifically expressed miRNAs in the two EV subtypes were low, and most of the highly expressed miRNAs were concentrated in the set of co-expressed miRNAs in the two subtypes. The two different EV subtypes showed little difference in the types of miRNAs, but the expression levels significantly varied. We next randomly selected 18 high- or low- expressed miRNAs from the two subtypes and verified the expression using RT-qPCR, and the results showed good consistency with sequencing results. To strengthen the confidence in the validation of the RNA-seq results, we also performed statistical analysis of the other DEMs that underwent RT-qPCR verification, and we found that the relationship between RNA-Seq and RT-qPCR value was beyond the R squared value given in this study.
KEGG analysis of potential target genes showed that the potential target genes of upregulated miRNAs in sEV_F6 are significantly enriched in MAPK, ErbB, FoxO, Rap1, and AMPK signaling pathways, while the potential target genes of upregulated miRNAs in sEV_F8 are significantly enriched in autophagy and the HIF-1 signaling pathway. There are complex interactive networks between different pathways. The six signaling pathways regulate many cellular functions. The MAPK, ErbB, FoxO, and AMPK signaling pathways are mainly involved in cell proliferation, growth, autophagy, differentiation, the cell cycle, and apoptosis (Lake et al., 2016; Martins et al., 2016; Mihaylova & Shaw, 2011; Sanchez-Soria & Camenisch, 2010). In addition, Rap1 plays a vital role in cell division, adhesion, and migration (Jaśkiewicz et al., 2018), while the HIF-1 signaling pathway regulates cell hypoxia stress (Semenza, 2001). Therefore, in addition to the metabolism and biosynthesis pathways, the significantly high expression of miRNAs in sEVs_F8 may mainly regulate cell autophagy, and hypoxia stress through their potential target genes; while the significantly high expression miRNAs in sEVs_F6 may mainly regulate cell proliferation, apoptosis, survival, differentiation, cycle, and adhesion processes through their potential target genes.
KEGG analysis of potential target genes of non-DEMs showed that both EV subtypes participate in the MAPK, AMPK, ErbB, FoxO, p53 signaling pathways; autophagy; and the cell cycle through the miRNAs they carry to regulate cell proliferation, apoptosis survival, differentiation, autophagy, and cell cycle processes. Highly expressed miRNAs are mainly related to cell proliferation and apoptosis. We selected several miRNAs related to GC proliferation and apoptosis, including miR-26b, miR-125b, miR-92a, miR-93, and miR-128 (F. Lin et al., 2012; J. Liu et al., 2014; Maalouf et al., 2016; Sen et al., 2014). The results of this study confirmed this, the fact that both subtypes promote the proliferation of granulosa cells and inhibit their apoptosis, which was similar to the results of previous studies (Hung et al., 2017). However, the specific regulation of these cellular functions and corresponding pathways may differ depending on the different miRNAs carried by the two EV subtypes.
The target genes of the highly expressed miRNAs were specifically and significantly enriched in the Rap1 signaling pathway in sEV_F6 and the HIF-1 signaling pathway in sEV_F8, indicating that sEV_F6 may specifically regulate cell division, adhesion, and migration through the highly expressed miRNAs, while sEV_F8 may regulate cell hypoxia stress through the HIF-1 signaling pathway. Therefore, we next constructed miRNA–hub gene regulatory networks. Further studies are required to validate specific regulatory effects.
This study was the first to isolate the EVs subtypes of the follicular fluid by differential ultracentrifugation combined with iodixanol density gradient centrifugation and successfully isolate two subtypes of sEVs. The vesicles of low-density sEVs were TSG101+ and the vesicles of high-density sEVs were CD63+. The miRNA sequencing and KEGG analysis showed that the miRNA expression profiles and pathway enrichment of potential target genes of the two sEVs subtypes were significantly different.
The results indicated that the two sEV subtypes may perform different functions in receptor cells through the DEMs they carry. In spite of its limitations, this study definitely added to our understanding of sEV subtypes in follicular fluid and the heterogeneity of their miRNAs.
ACKNOWLEDGMENTS
This study was supported by grants from the National Major Project (No. 2016ZX08007002-003) and the General Program of National Natural Science Foundation of China (31873033).
CONFLICT OF INTERESTS
The authors declare that there ARE no conflict of interests.
AUTHOR CONTRIBUTIONS
Fusheng Quan: conceptualization, data curation, funding acquisition, project administration, supervision. Xiaomei Wang: conceptualization, methodology, software, investigation, writing—original draft, data curation. Kai Meng: validation, formal analysis, visualization, software. Hengqin Wang: validation, formal analysis, visualization. Ying Wang: resources, writing: review and editing. Yunqi Zhao: writing—review & editing. Jian Kang: writing— review & editing. Yong Zhang: supervision.
Open Research
DATA AVAILABILITY STATEMENT
The data that support the findings of this study are available from the corresponding author upon reasonable request.


