The correlation between CT features and insulin resistance levels in patients with T2DM complicated with primary pulmonary tuberculosis
Wei-Bin Yang and Hai-Lin Wang are co-first authors.
Abstract
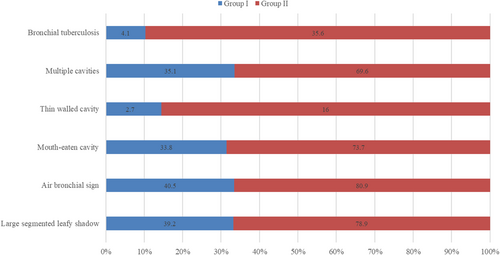
The aim is to investigate the correlation between computed tomography (CT) features and insulin resistance levels in patients with type 2 diabetes mellitus (T2DM) complicated with primary pulmonary tuberculosis (PTB). Nearly, 268 untreated PTB patients complicated with T2DM were divided into two groups according to the optimal cutoff value of HOMA-IR score for the Chinese population: HOMA-IR ≤ 2.69 (Group I: 74 patients), >2.69 (Group II: 194 patients). The basic characteristics and changes of CT manifestations were analyzed. In the two groups, the detection rate of large segmented leafy shadow was 39.2% and 78.9%; the air bronchogram sign detection rate was 40.5% and 80.9%; the discovery rate of mouth-eaten cavity was 33.8% and 73.7%; the thin-walled cavity detection rate was 2.7% and 16.0%; the rate of multiple cavities was 35.1% and 69.6%; and bronchial tuberculosis was found in 4.1% and 35.6%, respectively. The detection rates of lesions in Group II were significantly higher than in Group I (p < .05). HOMA-IR was found independently associated with large segmented leafy shadow, air bronchial sign, thin-walled cavity, and bronchial tuberculosis. The level of insulin resistance can effectively reflect the severity of PTB patients with T2DM. CT scan can directly provide image information in clinics. These two examinations can guide clinicians to accurately formulate subsequent treatment plans.
1 INTRODUCTION
According to the “Global Tuberculosis Report 2018” of the World Health Organization, tuberculosis (TB) is one of the most serious public health problems in the world and there were 10 million people who developed TB disease in 2017 (World Health Organization, 2018). Both TB and diabetes mellitus have become one of the top 10 causes of death contributing to the global burden of disease (Noubiap et al., 2019; World Health Organization, 2016; World Health Statistics, 2018). The risk of development of tuberculosis is greatly increased in the context of diabetes and treatment outcomes can be adversely affected because of poor glycaemic control (Baker et al., 2011; Huang, Jiang, Lai, Wu, & Chang, 2019; Salindri et al., 2016). The association between TB and diabetes mellitus (DM) has been studied for decades, and several studies have also researched the association between TB and insulin resistance (Mao et al., 2011; Philips, Visser, Nel, & Blaauw, 2017). However, the correlation between computed tomography (CT) image features and insulin resistance levels in type 2 diabetic patients (T2DM) with primary pulmonary tuberculosis (PTB) has not been thoroughly studied.
It was reported by Kim, Lee, and Kim (2017) that lymph node enlargement, involvement of all lobes and bilateral pulmonary involvement are significantly more common CT findings in TB patients with DM than without DM. Alkabab et al (Alkabab, Enani, Indarkiri, & Heysell, 2018) found that DM patients with HbA1c > 6.5% had significantly more cavitary lesions compared with patients with HbA1c < 6.4%. A recent study (Xia, Li, Shao, Zhang, & Huang, 2018) conducted by Xia et al on the correlation between CT imaging features and glycosylated hemoglobin (HbA1c) level for T2DM patients with PTB showed that the detection rate of lesions was positively related to the HbA1c level, suggesting the combination examination strategy (CT plus HbA1c) for guiding subsequent diagnosis or treatment. This study aimed to investigate the association between the level of insulin resistance and CT imaging features in T2DM patients with PTB.
2 MATERIALS AND METHODS
2.1 Study design and patients enrollment
Four hundred and ninty-seven patients, with the diagnosis of PTB and T2DM, who were admitted to the Fourth People's Hospital of Huai'an between January 2013 and March 2020 were retrospectively reviewed. The inclusion criteria were used in the selection of patients: (a) treatment-naïve before hospitalization in this hospital; (b) clinically diagnosed diabetes; and (c) fulfilling at least one of four points for diagnosis of TB (sputum smear positive, histologically confirmation using percutaneous lung biopsy or bronchoscopy and typical image manifestations). The exclusion criteria were as follows: (a) coinfected with other virus such as HIV and HBV; (b) coinfected with other pathogens that affect image manifestations; (c) diagnosed with tumors; and (d) inadequate clinical data.
The clinical data included age, gender, the time interval of T2DM and TB, fasting blood glucose, and blood insulin at the first diagnosis of DM and TB. According to Homeostatic Model Assessment for Insulin Resistance (HOMA-IR) score and optimal cutoff values proposed in previous studies (Gayoso-Diz et al., 2013; Xing, Yang, & Yang, 2004), patients included were divided into two groups: HOMA-IR ≤ 2.69 for normal resistance (Group I) and HOMA-IR > 2.69 for abnormal resistance (Group II).
2.2 Detection device and equipment
The fasting blood glucose was tested by glucose oxidase method using fully automatic chemistry analyzer (Beckman Coulter Inc, AU5800 series) and blood kit (Medicalsystem Biotechnology Co., Ltd). The serum insulin detection was tested by the chemiluminescence method using chemiluminescence immunoanalyzer (Abbott i2000SR).
CT equipment and methods: The CT examination was performed with a Germany SIMENS sprit spiral CT scanner. After patients inhale a deep breath, CT scan was started with the range from apex to both sides of the lower edge of the costophrenic angle. The scanning parameters were as follows: voltage: 125 kV; current: 250 mA; reconstruction layer thickness: 5 mm; reconstruction interval: 5 mm; thin layer reconstruction: 1 mm; image scanning and reconstruction matrix were 1024 × 1024, using standard algorithm.
2.3 Basis for diagnosis of tuberculosis and diabetes
According to Guidelines for the Prevention and Treatment of Type 2 Diabetes in China (2013 version; Xu et al., 2013), we used sputum test and bacterial culture to confirmed tuberculosis cases. As for T2DM, we used the following test as disease diagnosis criteria: (a) clinical symptoms of typical diabetes with randomized blood glucose results ≥ 11.1 mmol/L; (b) fasting blood glucose ≥ 7.0 mmol/L; and (c) 2-hr blood glucose results after oral glucose tolerance test (OGTT) ≥ 11.1 mmol/L.
2.4 Image analysis of tuberculosis
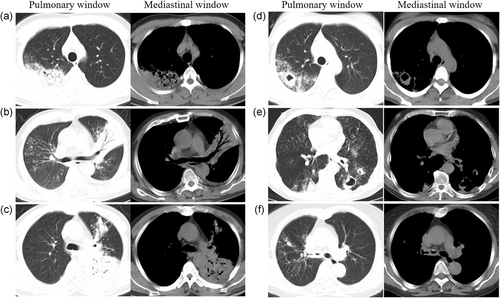
The CT images were recorded and examined by two radiologists and consensus was reached. The position, size, shape, cavity, calcification, bronchus, lymph nodes, and pleural effusion were observed. Pulmonary tuberculosis lesions showed classical features such as multiple forms, multiple sites, multiple calcifications and fewer masses, less accumulation, and less enhancement. The CT analysis of PTB lesions were as follows: (a) Large segmented leafy shadow: pathological tissues that caused by inflammation, edema, bleeding and so on would replace the gas in the alveolar space to produce flaky shadows. The lesion that appears as a larger segment of the lung has an increased density and uniform solid shadow. (b) Air bronchial sign: translucent bronchus and its branch shadows can be seen in the solid slices of the lobe. (c) The lobe center nodule shadow: The nodule is located in the center of the lobules of the lung and is not connected to the interlobular septum and pleura. The CT of the nodule appears as a shadow of 2–8 mm and the edges are blurred. (d) Small patch shadow: the CT findings showed that the lesions in the lungs were high density and the central density was higher than the periphery, and the edges were blurred. (e) Cavity: the lesions in the lungs, which are necrotic and liquefied are discharged through the drainage bronchus to form cavities. The X-ray performance of cavities is mainly as follows: (a) The thick-walled cavity: the thickness of the cavity wall is more than 3 mm and the shape irregular. There is a high-density solid zone around the cavity. The inner wall is smooth or uneven, and most of them are newly formed cavities. (b) The thin-walled cavity: the wall of the cavities is thin and the thickness is less than 3 mm. The shape of cavities with clear boundaries and smooth inner walls is circular, elliptical, or irregular. (c) Mouth-eaten cavity: multiple shadowy irregular worm-like small transparent areas can be seen in the shadow with high density. (d) The multiple cavity: the number of cavities is more than two. (e) Mediastinal lymphadenopathy: the maximum diameter of the lymph node is more than 15 mm. (f) Bronchial tuberculosis: the CT findings showed that the wall of the bronchus is thickened and the lumen is narrowed, the lesion has a long range and the inner wall is irregular.
2.5 Statistical methods
Statistical analyses were performed using SPSS 19.0 (SPSS Inc., Chicago, IL). Measurement data were presented as mean ± SD and the comparison between groups was analyzed by independent t test. Count data were presented as a percentage (%) and the comparison between groups was performed by the χ2 test. Spearman and pearson correlation analysis were applied for categorical and continuous data, respectively. Forward conditional linear or logistic multivariate analysis (input and output p value: .05 and .1) was used to capture independent associations for numeric or binary data, respectively. Receiver operating characteristic (ROC) curve analysis was performed using R 3.6.1. p Value less than .05 was considered as statistically significant.
3 RESULTS
3.1 Clinical characteristics for T2DM-PTB patients
A total of 268 patients between January 2013 and March 2020 were finally included. Due to HOMA-IR score optimal cut-off value proposed previously (Gayoso-Diz et al., 2013; Xing et al., 2004), all patients included were divided into two groups: HOMA-IR ≤ 2.69 (Group I, n = 74) and HOMA-IR > 2.69 (Group II, n = 194) (Table 1). There were no statistically significant differences in age (p = .567), gender (p = .142), and time interval between the first diagnosis of disease (T2DM, p = .636; PTB, p = .136, respectively) between these two groups.
| Demographic characteristics | Group I (n = 74) | Group II (n = 194) | p Value |
|---|---|---|---|
| Age, years, mean ± SD | 58.6 ± 12.6 | 57.5 ± 15.0 | .567 |
| Gender, male | 46/74 (62.2) | 139/194 (71.6) | .142 |
| FBG (mmol/L) | 8.4 ± 2.9 | 12.2 ± 3.7 | <.001 |
| FPI (pmol/L) | 35.0 ± 10.0 | 113.0 ± 66.5 | <.001 |
| Time interval between the first diagnosis of disease (months) | |||
| T2DM, mean ± SD | 69.1 ± 53.1 | 72.7 ± 56.0 | .636 |
| PTB, mean ± SD | 3.1 ± 2.9 | 2.6 ± 2.3 | .136 |
| Chest radiograph | |||
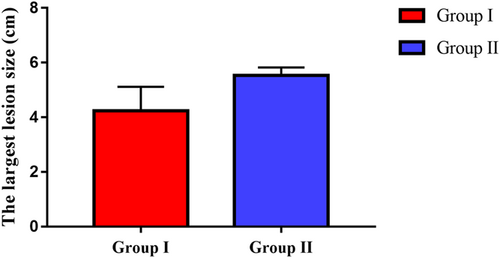
| The largest lesion size (cm), mean ± SD | 4.2 ± 3.8 | 5.5 ± 2.0 | <.001 |
| Number of pulmonary lobes involved, mean ± SD | 6.6 ± 5.0 | 6.8 ± 4.3 | .747 |
| Large segmented leafy shadow | 29/74 (39.2) | 153/194 (78.9) | <.001 |
| Small patchy shadow | 51/74 (68.9) | 150/194 (77.3) | .159 |
| Small nodules | 62/74 (83.8) | 158/194 (81.4) | .724 |
| Air bronchial sign | 30/74 (40.5) | 157/194 (80.9) | <.001 |
| Mouth-eaten cavity | 25/74 (33.8) | 143/194 (73.7) | <.001 |
| Thin-walled cavity | 2/74 (2.7) | 31/194 (16.0) | <.001 |
| Thick-walled cavity | 21/74 (28.4) | 71/194 (36.6) | .250 |
| Single cavity | 11/74 (14.9) | 33/194 (17.0) | .717 |
| Multiple cavities | 26/74 (35.1) | 135/194 (69.6) | <.001 |
| Calcification | 15/74 (20.3) | 31/194 (16.0) | .469 |
| Fibrosis | 27/74 (36.5) | 57/194 (29.4) | .303 |
| Lymph node enlargement | 7/74 (9.5) | 22/194 (11.3) | .827 |
| Pleural effusion | 12/74 (16.2) | 50/194 (25.8) | .107 |
| Bronchial tuberculosis | 3/74 (4.1) | 69/194 (35.6) | <.001 |
- Abbreviations: FBG, fasting blood glucose; FPI, fasting plasma insulin; T2DM, type 2 diabetes mellitus; PTB, pulmonary tuberculosis.
3.2 Comparison of CT imaging features in T2DM-PTB patients with different HOMA-IR levels
Figure 1 shows the predominant chest radiograph signs in pulmonary window and mediastinal window of CT. In these two groups, the detection rate of large segmented leafy shadow (Figure 1a) was 39.2% (29/74) and 78.9% (153/194) (p < .001); the discovery rate of air bronchial sign (Figure 1b) was 40.5% (30/74) and 80.9% (157/194) (p < .001); the mouth-eaten cavity (Figure 1c) detection rate was 33.8% (25/74) and 73.7% (143/194) (p < .001); the rate of thick-walled cavity (Figure 1d) was 28.4% (21/74) and 36.6% (71/194) (p = .250); the multiple cavities (Figure 1e) discovery rate was 35.1% (26/74) and 69.6% (135/194) (p < .001); and bronchial TB (Figure 1f) was found in 4.1% (3/74) and 35.6% (69/194) (p < .001), respectively (Figure 2). It was statistically significant that the largest lesion size (p < .001), large segmented leafy shadow (p < .001), air bronchial sign (p = .001), mouth-eaten cavity (p < .001), thin-walled cavity (p < .001), multiple cavities (p < .001), and bronchial tuberculosis (p < .001) were different between these two groups. The rates of several chest radiograph signs including large segmented leafy shadow, air bronchial sign, mouth-eaten cavity, thin-walled cavity, multiple cavities, and bronchial tuberculosis in Group II were significantly higher than in Group I (p < .05).
Furthermore, the largest size of lesions in Group II was significantly higher than in Group I (p < .001) (Figure 3).
3.3 Correlation analysis and ROC curves of IR and CT imaging features
The results of correlation analysis of IR and CT imaging features are shown in Table 2. It was statistically significant that the IR measurement results have a remarkable correlativity with the largest lesion size (r = .185, p = .002), large segmented leafy shadow (r = .450, p < .001), air bronchial sign (r = .434, p < .001), mouth-eaten cavity (r = .306, p < .001), thin-walled cavity (r = .192, p = .002), thick-walled cavity (r = .139, p = .023), multiple cavities (r = .210, p = .001), and bronchial tuberculosis (r = .411, p < .001). The natural logarithm of IR (ln(IR)) have a similar correlativity with those imaging features compared with IR, but slightly different in terms of numerical variables (i.e. the largest lesion size and the number of pulmonary lobes involved).
| Serum indexes | IR | ln(IR) | ||
|---|---|---|---|---|
| Chest radiograph | r value | p value | r value | p value |
| The largest lesion size | .185 | .002 | .220 | <.001 |
| Number of pulmonary lobes involved | .065 | .286 | .049 | .425 |
| Large segmented leafy shadow | .450 | <.001 | .450 | <.001 |
| Small patchy shadow | .087 | .153 | .087 | .153 |
| Small nodules | −.010 | .866 | −.010 | .866 |
| Air bronchial sign | .434 | <.001 | .434 | <.001 |
| Mouth-eaten cavity | .306 | <.001 | .306 | <.001 |
| Thin-walled cavity | .192 | .002 | .192 | .002 |
| Thick-walled cavity | .139 | .023 | .139 | .023 |
| Single cavity | .010 | .874 | .010 | .874 |
| Multiple cavities | .210 | .001 | .210 | .001 |
| Calcification | −.053 | .387 | −.053 | .387 |
| Fibrosis | −.007 | .903 | −.007 | .903 |
| Lymph node enlargement | .050 | .414 | .050 | .414 |
| Pleural effusion | .052 | .398 | .052 | .398 |
| Bronchial tuberculosis | .411 | <.001 | .411 | <.001 |
- Abbreviations: IR, insulin resistance; ln(IR), the natural logarithm of IR; PTB, pulmonary tuberculosis; T2DM, type 2 diabetes mellitus.
The natural logarithm of IR at multivariate analysis was independently associated with large segmented leafy shadow (p = .015), air bronchial sign (p = .003), thin-walled cavity (p = .001), and bronchial tuberculosis (p < .001) (Table 3).
| Correlation analysisa | Multivariate analysis | |||
|---|---|---|---|---|
| Chest radiograph | r Value | p Value | b Coefficient | p Value |
| The largest lesion size | ||||
| ln(IR) | .220 | <.001 | .246 | .691 |
| FBG | .287 | <.001 | .171 | .019 |
| FPI | .105 | .087 | .001 | .909 |
| Large segmented leafy shadow | ||||
| ln(IR) | .450 | <.001 | .593 | .015 |
| FBG | .549 | <.001 | .379 | <.001 |
| FPI | .259 | <.001 | – | .607 |
| Air bronchial sign | ||||
| ln(IR) | .434 | <.001 | .009 | .003 |
| FBG | .454 | <.001 | .313 | .049 |
| FPI | .278 | <.001 | – | .835 |
| Mouth-eaten cavity | ||||
| ln(IR) | .306 | <.001 | – | .103 |
| FBG | .364 | <.001 | .238 | <.001 |
| FPI | .178 | .003 | – | .142 |
| Thin-walled cavity | ||||
| ln(IR) | .192 | .002 | .867 | .001 |
| FBG | .062 | .309 | – | .949 |
| FPI | .202 | .001 | – | .941 |
| Thick-walled cavity | ||||
| ln(IR) | .139 | .023 | – | .292 |
| FBG | .171 | .005 | .087 | .011 |
| FPI | .082 | .180 | – | .498 |
| Bronchial tuberculosis | ||||
| ln(IR) | .210 | .001 | – | .900 |
| FBG | .327 | <.001 | .204 | <.001 |
| FPI | .084 | .170 | – | .741 |
| Bronchial tuberculosis | ||||
| ln(IR) | .411 | <.001 | 6.938 | <.001 |
| FBG | .384 | <.001 | −.349 | .002 |
| FPI | .315 | <.001 | −.057 | <.001 |
- Abbreviations: FBG, fasting blood glucose; FPI, fasting plasma insulin; IR, insulin resistance; ln(IR), the natural logarithm of IR; PTB, pulmonary tuberculosis; T2DM, type 2 diabetes mellitus.
- a Pearson correlation analysis was used for the largest lesion size and Spearman correlation analysis was used for others.
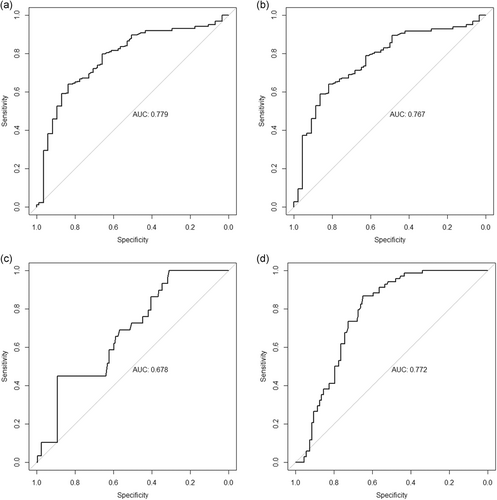
As shown in Table 4 and Figure 4, AUROC of isolated IR was 0.779 (95% CI, 0.719–0.839), 0.767 (95% CI, 0.707–0.827), 0.678 (95% CI, 0.585–0.772), and 0.772 (95% CI, 0.717–0.827) for the prediction of large segmented leafy shadow, air bronchial sign, thin-walled cavity, and bronchial tuberculosis, respectively.
| Chest radiograph | Large segmented leafy shadow | Air bronchial sign | Thin-walled cavity | Bronchial tuberculosis |
|---|---|---|---|---|
| IR | ||||
| AUROC (95% CI) | 0.779 (0.719–0.839) | 0.767 (0.707–0.827) | 0.678 (0.585–0.772) | 0.772 (0.717–0.827) |
| Cut-off values | 5.18 | 5.16 | 13.46 | 5.39 |
| Sensitivity/specificity (%) | 63/84 | 64/82 | 45/89 | 87/65 |
| Correctly classified (%) | 70 | 70 | 84 | 71 |
| PPV/NPV (%) | 89/52 | 88/53 | 33/93 | 46/94 |
| Positive/negative LR | 3.88/0.43 | 3.51/0.44 | 4.12/0.62 | 2.48/0.20 |
- Abbreviations: AUROC, area under the ROC curve; IR, insulin resistance; LR, likelihood ratio; NPV, negative predictive value; PPV, positive predictive value; PTB, pulmonary tuberculosis; ROC, receiver operating characteristic; T2DM, type 2 diabetes mellitus.
4 DISCUSSION
In this cross-sectional study, we explored the relationship between clinical characteristics and HOMA-IR score in patients with T2DM-PTB. We found that differences in imaging features were related to HOMA-IR score levels. Diabetic patients who did not have good controls of the disease tend to have a more complicated condition and even worse prognosis. The correlation analysis and ROC curve indicate that HOMA-IR value can be considered as a novel index for the evaluation of disease condition in T2DM-PTB patients. It should be noted that IR value is not normally distributed because of its formula (i.e. FPG*FINS/22.5). Therefore, IR should be transformed by logarithmic transformation when involved in the establishment of prediction models.
Previous studies showed that T2DM-PTB comorbidity had multiple lung segment involvement, and often involved the most common site of tuberculosis. In accordance with other studies, we found that the posterior segment of the upper tip and the dorsal segment of the lower lobe were the most common site of infection. Moreover, we did not find any difference in comparison of the number of bronchopulmonary segments affected in different group according to HOMA-IR score. The extent of lung lesions in patients with T2DM-PTB was not significantly related to the level of insulin resistance.
Another major finding in our study was that diabetic control status had impact on imaging features of T2DM-PTB comorbidity. Comparison of lesion morphology showed that the higher the level of HOMA-IR, the higher is the frequency of the following six imaging signs: large segmented leafy shadow, air bronchial sign, mouth-eaten cavity, multiple cavities, thin-walled cavity, and bronchial tuberculosis. T2DM-PTB comorbidity had its imaging features according to different HOMA-IR and that the increase of insulin resistance level was closely related to the pathological features of patients with diabetes mellitus complicated with pulmonary tuberculosis. IR was found independent of predictors of large segmented leafy shadow, air bronchial sign, thin-walled cavity, and bronchial tuberculosis in multivariate analysis with great diagnostic performance (AUC range: 0.678–0.779). The underlying mechanism might be related to the superior internal environment provided by diabetes mellitus such as high blood glucose and high blood lipids and the invasive characteristics of tuberculosis. Insulin was best known for its effects on glucose and lipid metabolism. Several studies have shown that there was a positive correlation between the growth rate of glucose concentration and the severity of tuberculosis within a certain concentration range. On one hand, insulin resistance in patients promotes the decline in glucose utilization, raises blood sugar, and becomes a nutrient source for the growth of tuberculosis. On the other, insulin resistance promoted the occurrence of dyslipidemia (McGarry, 2002). Insulin resistance increased lipolysis of adipose tissue and increased blood lipids, forming an internal environment that was very suitable for the survival and reproduction of tuberculosis.
Moreover, sustained hyperglycemia can reduce peripheral blood lymphocyte immune activity (Berezin, Kremzer, & Samura, 2015). After the patient was stimulated by the tuberculosis antigen, the production of interleukin-12 (IL-12) and γ-interferon was significantly reduced (Meenakshi, Ramya, Lavanya, Vijayalakshmi, & Sumanlatha, 2016). In addition, hyperglycemia could inhibit the natural killer cell immune function, weaken the phagocytic function of macrophages that recognize and kill tuberculosis, and promote the immune escape of tuberculosis. When cellular immune function declined, Langerhans cells and epithelioid cells were also significantly reduced. Then the enlarged lesion and the persistent, progressive infection of tuberculosis caused the tissue to almost lose cellular immunity, and was no longer inhibited by the immune response and came to a cheese-like appearance cell death named caseous necrosis. The gas in the original alveoli was quickly replaced by a large amount of inflammatory exudate, forming a large area of caseous necrosis, followed by necrotic substances liquefied by the hyaluronidase released by macrophages in the body. The necrotic substances exited the body through bronchus and formed multiple cavities. Substances containing a large amount of tuberculosis could adhere to the large bronchus and the inner wall of the trachea, and invade the bronchial mucosa. Thus, people with diabetes and tuberculosis were more likely to form voids (Restrepo, Fisher-Hoch, & Crespo, 2007). Therefore, diabetes and tuberculosis were mostly active and rapidly developing. The pathophysiological process of tuberculosis eroding the lungs as mentioned above, mostly explained the reason why the imaging features of diabetic comorbid tuberculosis were closely related to insulin and blood glucose control status.
There are some limitations in this study. First, this study is retrospective of which the data quality is limited. We ensure that the interval between image data and serum data of every patient was no more than 3 months. Second, the sample size, especially normal IRs is not large. We should continue to collect more acceptable data in the future. Third, we did not compare T2DM-PTB patients with isolated PTB patients. Therefore, a well-designed randomized controlled trial is required to confirm the predictive effect of IR for T2DM with PTB.
5 CONCLUSION
CT manifestations of T2DM with PTB were closely associated with HOMA-IR values. If IR ≤ 2.69, the effect of TB condition is better. IR effectively reflects the severity of the PTB disease and it can be transformed and involved in the establishment of prediction model for TB conditions. CT can provide important information for clinical imaging. These two examinations can guide clinicians for appropriate diagnosis and timely treatment.
ACKNOWLEDGMENT
This study was financed by Science and Technology Program Guiding project of Jiangsu Huai'an (No. HABZ201727).
Open Research
DATA AVAILABILITY STATEMENT
Research data is not available because of patients’ privacy.


