Central adiponectin induces trabecular bone mass partly through epigenetic downregulation of cannabinoid receptor CB1
Abstract
Central adiponectin (APN) in either the globular (gAPN) or full-length forms decreases sympathetic tone and increases trabecular bone mass in mice through the hypothalamus. It is known that cannabinoid type-1 (CB1) receptors are expressed in the hypothalamic ventromedial nucleus and participate in energy metabolism by controlling sympathetic activity. However, whether central APN could influence endocannabinoid signaling through CB1 receptor to regulate bone metabolism has not been characterized. Here we demonstrate that gAPN downregulated CB1 expression in embryonic mouse hypothalamus N1 cells in vitro. gAPN intracerebroventricular (icv) infusions also decreased hypothalamic CB1 expression and bone formation parameters in APN-knockout (APN-KO) and wild-type mice. Most importantly, mice pretreated with icv infusions with the CB1 receptor agonist arachidonyl-2′-chloroethylamine or antagonist rimonabant attenuated or enhanced respectively central APN induction of bone formation. We then investigated whether epigenetic signaling mechanisms were involved in the downregulation of hypothalamic CB1 expression by gAPN. We found gAPN enhanced expression levels of various histone deacetylases (HDACs), especially HDAC5. Furthermore, chromatin immunoprecipitation assays revealed HDAC5 bound to the transcriptional start site transcription start site 2 region of the CB1 promoter. In summary, our study identified a possible novel central APN-HDAC5-CB1 signaling mechanism that promotes peripheral bone formation through epigenetic regulation of hypothalamic CB1 expression.
1 INTRODUCTION
Adipose tissue secretes a wide range of biologically active molecules, known as adipokines (Maurizi, Della Guardia, Maurizi, & Poloni, 2018; Yamauchi et al., 2001). Adiponectin (APN), a major adipokine, is a 30 kDa circulating hormone that plays a role in insulin sensitivity (Kondo et al., 2002; Yamauchi et al., 2003), energy metabolism (Padmalayam & Suto, 2013), anti-inflammation (Iwayama et al., 2012; Padmalayam & Suto, 2013), and bone metabolism (Karsenty & Oury, 2012; Wu et al., 2014). APN has been shown to mediate central and peripheral actions by binding to two different APN receptors, AdipoR1, and AdipoR2 (Yamauchi et al., 2003).
The hypothalamus is a crucial structure for endocannabinoid-mediated control of energy balance and food intake (Cardinal et al., 2014), and endocannabinoid signaling through the CB1 receptor plays a crucial role in energy balance regulation (Bermudez-Silva, Cardinal, & Cota, 2012). CB1 receptors are expressed throughout the brain, including the hypothalamus, amygdala, and the periaqueductal gray (Tsou, Brown, Sanudo-Pena, Mackie, & Walker, 1998). Several synthetic agonists and antagonists of the CB1 receptor were previously developed to investigate the role of CB1 in human physiology and as promising therapeutics for human diseases such as obesity (Picone and Kendall, 2015). We and others demonstrated central APN reduced hypothalamic expression of cannabinoid type-1 (CB1) receptor in an APPL1-independent manner (Karsenty & Oury, 2012; Wu et al., 2014).
Epigenetics refers to posttranslational modifications that regulate gene expression without involving DNA sequence alterations. Bone metabolism has been demonstrated to be under the control of epigenetic mechanisms (Marini, Cianferotti, & Brandi, 2016). DNA methylation of the CB1 gene promoter and histone acetylation have been described to contribute to the regulation of CB1 expression under certain physiological and pathological conditions (D'Addario, Di Francesco, Pucci, Finazzi Agro, & Maccarrone, 2013). It is, however, unknown whether CB1 downregulation by central APN is mediated by epigenetic mechanisms.
In this study, we investigated the involvement of hypothalamic CB1 receptors in mediating central effects of APN in murine bone metabolism and possible epigenetic signaling mechanisms. Our results demonstrated that central APN could partly increase trabecular bone mass via HDAC5-mediated downregulation of hypothalamic CB1 gene expression.
2 MATERIALS AND METHODS
2.1 Recombinant globular APN and full-length APN
The pEt15b bacterial expression vector encoding the COOH-terminal part of human APN (amino acids 106–244) was used to express globular adiponectin (gAPN) as a His-tagged protein in BL21(DE3) bacterial cells. His-tagged gAPN was affinity extracted using Ni-agarose beads as described previously (Mao et al., 2006).
2.2 APPL1 short hairpin RNA lentivirus preparation
Lentiviral-short hairpin RNA (shRNA) constructs (Sigma-Aldrich) for specific knockdown of APPL1 expression and the scramble control nonspecific plasmid (Sigma-Aldrich) were donated by Dr. Yuchang Fu from the University of Alabama at Birmingham and previously described (Tian et al., 2012). To generate the lentivirus, 7.5 μg of each lentiviral-shRNA plasmid plus 5 μg of vesicular Stomatitis virus-G protein and 7.5 μg of pGag/Pol packaging plasmids were cotransfected by the calcium precipitation method in human embryonic kidney-293T cells grown in 10-cm plates.
2.3 Animal experimentation and surgical procedures
Male APN-knockout (APN-KO; Jax no. 008195) and wild-type (WT; C57BL/6J, Jax no. 000664) mice weighing 20–25 g were purchased from the Jackson Laboratory (Bar Harbor, ME). Four- to six-week-old mice were fixed on a stereotaxic instrument (Stoelting, Wood Dale, IL) under general anesthesia and a 0.7-mm hole was drilled in the exposed calvaria. A 28-gauge cannula (Brain infusion kit II; Durect, Cupertino, CA) was then implanted into the third ventricle according to the coordinates midline, − 1 mm AP, 3 mm ventral (0 point bregma). The cannula was secured to the skull with cyanoacrylate and attached with Tygon tubing to an osmotic pump (Durect) placed in the dorsal subcutaneous tissue of the mice. Recombinant gAPN (20 ng/h), rimonabant (SR141716A, a CB1 receptor antagonist, 2 pg/h), arachidonyl-2′-chloroethylamine (ACEA; a CB1 receptor agonist 4 pg/h), or artificial CSF (119 mM NaCl, 26.2 mM NaHCO3, 2.5 mM KCl, 1 mM NaH2PO4, 1.3 mM MgCl2, and 10 mM glucose) were delivered at a rate of 0.22 μl/h for 28 days. The mice were housed individually after the surgery. The surgery cannulation was confirmed by histology analysis as previously reported. Animal protocols were carried out in conformance with the Association for Assessment and Accreditation of Laboratory Animal Care guidelines and received approval from the Tufts University Institutional Animal Care and Use Committee. Mice were maintained under standardized conditions with 12:12-hr light–dark cycle.
2.4 Tissue preparation and biochemical analysis
The hypothalamus was dissected for RNA and protein extraction. The femurs were removed and fixed in 10% formalin.
Microcomputed tomography analysis. The trabecular bone architecture was assessed using a microcomputed tomography (μCT) system (Viva CT 40; SCANCO Medical). Femur bone specimens were stabilized with gauze in a 2-ml centrifuge tube filled with 70% ethanol and fastened in the specimen holder of the μCT scanner. One-hundred and thirty μCT slices, corresponding to a 1.365 mm region distal from the growth plate were acquired at an isotropic spatial resolution of 10.5 μm. A global threshold technique was applied to binarize three-dimensional grayscale μCT images, where the minimum between the bone and bone marrow peaks in the voxel gray value histogram is the threshold value. The trabecular bone compartment was segmented by a semiautomatic contouring method and subjected to a model-independent morphological analysis by the standard software provided by the manufacturer of the μCT scanner. Three-dimensional morphological parameters, including bone volume (BV)/trabecular volume, trabecular number (Tb.N), trabecular thickness, trabecular separation (Tb.Sp), and tissue-bone mineral density (T-BMD), were evaluated. The T-BMD differs from bone mineral density and can also be used to estimate tissue mineral density (Bouxsein et al., 2010).
2.5 Embryonic mouse hypothalamus N1 cell culture and experimental conditions
Immortalized mouse N1 hypothalamic neurons (Catalog #CLU138; MARKER N46, CELLutions Biosystems, Canada) were maintained in dulbecco's modified Eagle medium (DMEM) culture medium containing 10% fetal bovine serum (FBS) at 37°C in 5% CO2–95% air. N1 cells were serum-starved overnight and left untreated or treated with 10-10 M gAPN. Cells were transduced with the APPL1 lentivirus at a multiplicity of infection of 50 with 8 μg/ml polybrene (Sigma-Aldrich, St. Louis, MO). Viral particles were harvested from the supernatant 24, 36, 48, and 60 hr after transfection. Stable cell lines expressing lentiviral shRNA were selected via puromycin for 2 weeks.
2.6 Quantitative real-time polymerase chain reaction
Total RNA was extracted from samples using TRIzol (Invitrogen, Carlsbad, CA). The first strand of complementary DNA (cDNA) was generated using SuperScript III reverse transcriptase (Life Technologies) and oligo(dT)20 primer (Life Technologies, Carlsbad, CA). A quantitative real-time reverse transcription-PCR assay was performed using iQTM SYBR Green Supermix (Bio-Rad, Hercules, CA) on a Bio-Rad iQ5 thermal cycler. The evaluation of relative differences in PCR product amounts was carried out by the comparative cycle threshold method, using β-actin as a control. The sequences of the primers utilized in quantitative real-time polymerase chain reaction (qRT-PCR) are included in Table 1.
| Primer | Sequence |
|---|---|
| CB1 | Forward: 5′-CCTTGCAGATACAACCTT-3′ |
| Reverse: 5′-TGCCATGTCTCCTTTGATA-3′ | |
| HDAC1 | Forward: 5′-CTGTCCGGTATTTGATGGCT-3′ |
| Reverse: 5′-CACGAACTCCACACACTTGG-3′ | |
| HDAC2 | Forward: 5′-GGCGGCAAGAAGAAAGTGTGC-3′ |
| Reverse: 5′-GGCATCATGTAGTCCTCCAGC-3′ | |
| HDAC3 | Forward: 5′-TCTGAGGACTACATCGACTCC-3′ |
| Reverse: 5′-GTCGCCATCATAGAACTCATTG-3′ | |
| HDAC4 | Forward: 5′-CAGATGGACTTTCTGGCCG-3′ |
| Reverse: 5′-CTTGAGCTGCTGCAGCTTC-3′ | |
| HDAC5 | Forward: 5′-GAAGCACCTCAAGCAGCAGCAGG-3′ |
| Reverse: 5′-CACTCTCTTTGCTCTTCTCCTTGTT-3′ | |
| HDAC6 | Forward: 5′-ACGCTGACTACATTGCTGCT-3′ |
| Reverse: 5′-TCTCAACTGATCTCTCCAGG-3′ | |
| HDAC7 | Forward: 5′-AGCTGGCTGAAGTGATCC-3′ |
| Reverse: 5′-TCACCATCAGCCTCTGAG-3′ | |
| HDAC8 | Forward: 5′-AACACGGCTCGATGCTGG-3′ |
| Reverse: 5′-CCAGCTGCCACTTGATGC-3′ | |
| HDAC9 | Forward: 5′-TCAGAGGTTCCTATGGGCCTG-3′ |
| Reverse: 5′-TGGAGACGTTCCACTGAGGG-3′ | |
| β-actin | Forward: 5′- GGACCTGACGGACTACCTCATG-3′ |
| Reverse: 5′-TCTTTGATGT- CACGCACGATTT-3′ |
- Note. CB1: cannabinoid type-1; HDAC: histone deacetylase; qRT-PCR: quantitative real-time polymerase chain reaction.
2.7 Western blot analysis
The whole protein lysates were prepared by using RIPA lysis buffer (Santa Cruz Biotechnology, Dallas, TX). Sodium dodecyl sulfate polyacrylamide gel electrophoresis (SDS-PAGE) and western blot analyses were performed using NuPAGE 4–12% bis-tris gradient gels and 0.45 μm Invitrogen polyvinylidene fluoride membranes (Life Technologies). Primary antibodies were obtained for APPL1 (1:2,000; Cell Signaling Technology, Danvers, MA), HDAC5 (1:1,000; Abcam, MA), and β-actin (1:1,000; Santa Cruz Biotechnology). The secondary antibodies were horseradish-peroxidase-linked goat anti-rabbit IgG (Santa Cruz Biotechnology). Blots were visualized using Pierce enhanced chemiluminescence reagents (Thermo Fisher Scientific, Waltham, MA).
Chromatin Immunoprecipitation Assays. The control- and gAPN-treated N1 cells from a 150 cm plate were cross-linked with 10% formaldehyde and quenched with 0.125 M glycine. Cells were washed with cold phosphate buffered saline (PBS) and then lysed with cell lysis buffer complemented with protease inhibitor Cocktail II (Sigma). DNA fragmentation was performed with Vibra-Cell™ sonicator using 500 μl nuclear lysis buffer lysate with 20 cycles of 15 s ON and 45 s OFF. In quantitative chromatin immunoprecipitation (qChIP), 100 μg of chromatin were incubated with 2 μg of HDAC5 antibody (Abcam) at 4°C overnight. Twenty microliters of protein A or G beads were added to each tube for 2 hr at 4°C and the complex were then washed with low salt buffer, high salt buffer, lithium chloride buffer, and tris-EDTA buffer (TE buffer) each for 5 min. The immunoprecipitants were de-cross-linked at 62°C overnight. The immunoprecipitated DNA was dissolved in 30 μl H2O, and 1 μl of DNA was used for qRT-PCR. Primer sequences and locations relative to the transcription start site (TSS; +1) are included in Supporting Information Table S1.
Statistical analysis. Results are presented as means ± standard deviation. Two-way analysis of variance with post hoc Tukey's honestly significant difference (HSD) was used to determine significant genotype treatment interaction for the various endpoint parameters (Figures 1 and 2). One-way analysis of variance was used to determine statistical significance for all the other experiments (Figures 3-5). All statistical analyses were conducted using SPSS statistics 17.0. p values lower than 0.05 were considered statistically significant.
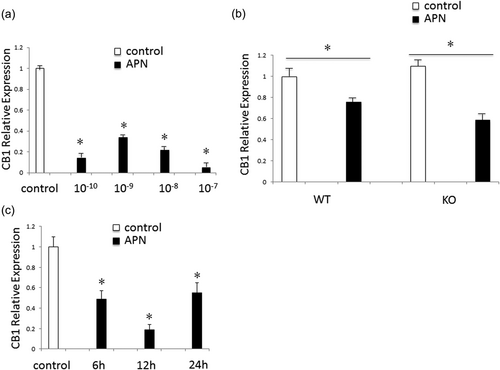
Adiponectin downregulated the expression of CB1 in embryonic mouse hypothalamus N1 cells and mice hypothalamus. (a) CB1 quantitative real-time PCR analysis following gAPN treatment (10-10, 10-9, 10-8, and 10-7 Mol/L) in mHypoE-N1 cells for 6 hr. (b) Intracerebroventricular (icv) infusion of WT and APN-KO mice with gAPN for 28 days decreased hypothalamus CB1 expression (n = 5 mice). (c) Time-course analysis of CB1 expression. N1 cells were treated with 10-7 M gAPN for 6, 12, and 24 hr, respectively. All data are means ± SD; *p < 0.05 as determined by two-way analysis of variance. APN-KO: adiponectin-knockout; CB1: cannabinoid type-1; gAPN: globular adiponectin; PCR: polymerase chain reaction; SD: standard deviation; WT: wild-type
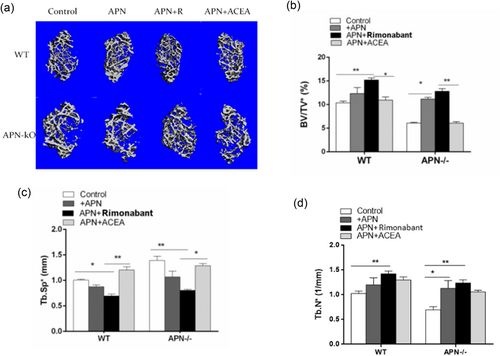
Central CB1 inhibited central APN-induced bone formation. Central infusion with CB1 activator ACEA decreased whereas CB1 inhibitor rimonabant increased trabecular bone phenotype of trabecular phenotype in WT and APN-KO mice. (a) Three-dimensional (3D) microcomputed tomography (µCT) images of the distal femur metaphyseal region in APN-KO and WT mice with or without 28 days of gAPN, CB1 inhibitor rimonabant (R) and CB1 activator ACEA (n = 5). (b) Trabecular bone volume normalized by tissue volume (BV/TV). (c) Trabecular separation (Tb.Sp). (d) Trabecular no. (Tb.N). All data are means ± SD (n = 5 mice). *p < 0.05 as determined by two-way analysis of variance. **p < 0.01 as determined by two-way analysis of variance. ACEA: arachidonyl-2′-chloroethylamine; APN-KO: adiponectin-knockout; BV: bone volume; CB1: cannabinoid type-1; gAPN: globular adiponectin; SD: standard deviation; WT: wild-type [Color figure can be viewed at wileyonlinelibrary.com]
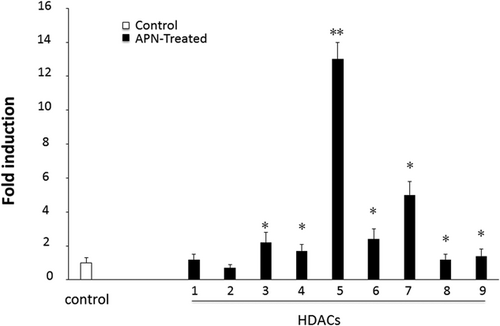
The transcription profile of HDAC (1–9) in APN-treated N1 cells was characterized by real-time PCR. After 6 hr of APN treatment, all HDACs were upregulated by APN except for HDAC1 and HDAC2. HDAC5 exhibited the highest upregulation. All data are means ± SD of three independent experiments; *p < 0.05 as determined by one-way analysis of variance. APN: adiponectin; HDAC: histone deacetylase; PCR: polymerase chain reaction; SD: standard deviation
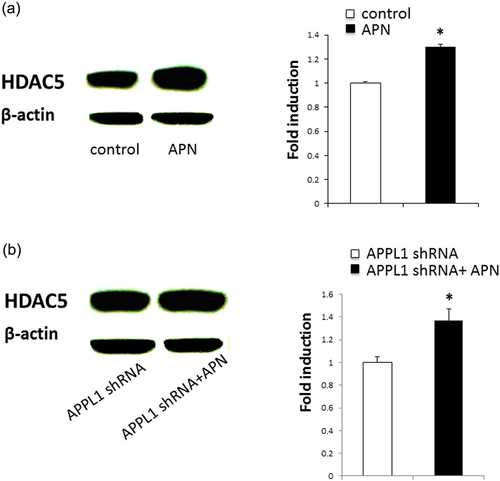
APN induction of HDAC5 expression is APPL1-independent. Protein expression levels of HDAC5 in untreated and APN-treated N1 cells were evaluated before (a) and after (b) APPL1 expression downregulation by shRNA. ß-actin was used as a loading control. *p < 0.05 as determined by one-way analysis of variance. Three independent experiments were conducted. APN: adiponectin; HDAC: histone deacetylase; shRNA: short hairpin RNA [Color figure can be viewed at wileyonlinelibrary.com]
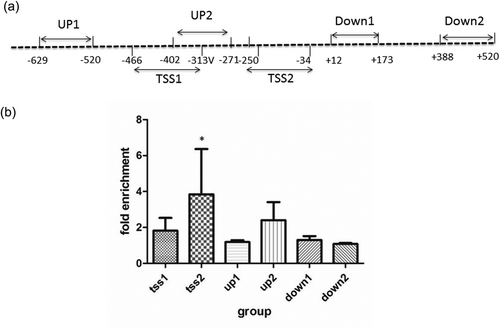
ChIP-qPCR analysis of HDAC5 binding to CB1 gene. The 5′-flanking region between 629 bp upstream and 520 bp downstream to the transcription start site (TSS) of CB1 was analyzed. N1 cells were treated with APN for 8 hr, and then cross-linked. The DNA-protein complex was then incubated with the HDAC5 antibody, and then DNA was extracted from immunoprecipitates and interaction between HDAC5 and CB1 gene evaluated by real-time PCR. Primer sequences and locations relative to the TSS (+1) are shown in Supporting Information Table S1. *p < 0.05 as determined by two-way analysis of variance. Three independent experiments were conducted. APN: adiponectin; CB1: cannabinoid type-1; ChIP: quantitative chromatin immunoprecipitation; HDAC: histone deacetylase; qPCR: quantitative polymerase chain reaction
3 RESULTS
3.1 Adiponectin downregulated the expression of CB1 in embryonic mouse hypothalamus N1 cell line and mouse hypothalamus
We first evaluated the CB1 expression in embryonic mouse hypothalamus N1 cells before and after gAPN treatment. We found CB1 expression was significantly downregulated by different concentrations of gAPN (Figure 1a). We further investigated the hypothalamic CB1 expression in WT and APN-KO mice before and after icv infusions of gAPN into the third ventricle. Our results showed that hypothalamic CB1 expression was higher in APN-KO than in WT mice (but differences were not statistically significant) and that gAPN infusion further decreased CB1 expression in WT and APN-KO mice (Figure 1b).
3.2 Central CB1 signaling activation inhibited central APN-induced bone formation
In the next set of experiments, we investigated CB1 central effects in peripheral bone formation induced by central APN by treating APN-KO and WT mice via icv infusion of CB1 activator ACEA or CB1 inhibitor rimonabant before gAPN icv infusion. We then used μCT to analyze femur bone structure and mineral density after 28 days. Our results demonstrated that CB1 inhibitor rimonabant icv infusions significantly increased trabecular BV, T-BMD, and Tb.N whereas decreased Tb.Sp distance in both APN-KO and WT mice treated with APN (Figure 2). On the other hand, activation of hypothalamic CB1 signaling by ACEA icv infusions significantly decreased trabecular BV, T-BMD, and Tb.N whereas increased Tb.Sp distance in either APN-KO or WT mice treated with APN (Figure 2).
3.3 APN increased expression of HDACs in N1 cells
To characterize a plausible epigenetic involvement in APN-mediated effects in cultured N1 cells, we examined the transcription profile of HDACs 1–9) in cells treated with APN for 6 hr and control cells by real-time PCR (Figure 3). Except for HDAC1 and HDAC2, expression of all HDACs analyzed was higher in APN-treated cells than in control cells, although HDAC5 exhibited the most robust upregulation upon APN treatment (Figure 3). Specific downregulation of APN receptor adapter APPL1 by shRNA did not significantly impact APN-induced HDAC5 expression upregulation (Figure 4).
3.4 HDAC5 binding to TSS2 region of CB1 gene
To further characterize the epigenetic regulation of CB1 gene by HDAC5, we investigated HDAC5 binding to the 5′-flanking region of CB1 gene between 629 bp upstream and 520 bp downstream to the TSS 1 and 2 using Chromatin Immunoprecipitation Assays. To that end, N1 cells were treated with APN for 8 hr and then cross-linked. The DNA-protein complexes were further incubated with HDAC5 antibody, and then DNA was extracted from the immunoprecipitates and analyzed by qRT-PCR, revealing that HDAC5 bound to the TSS2 region of the CB1 gene (Figure 5).
4 DISCUSSION
The observations presented here demonstrate that hypothalamic CB1 is involved in the regulation of bone metabolism by central APN. First, we found gAPN treatment downregulated CB1 expression in embryonic mouse hypothalamus N1 cells. Furthermore, hypothalamic CB1 expression was higher in APN-KO mice than in WT mice, and icv infusions with gAPN into the third ventricle further decreased hypothalamic CB1 expression in both WT and APN-KO mice. To further characterize the function of hypothalamic CB1 signaling in central APN induction of bone metabolism, we delivered CB1 receptor activator ACEA or CB1 inhibitor rimonabant via icv infusion into the third ventricle of APN-KO and WT mice before APN delivery. After 28 days of treatment, ACEA icv infusions significantly decreased trabecular BV, T-BMD, and Tb.N and increased Tb.Sp distance in both APN-treated APN-KO and WT mice whereas CB1 inhibitor rimonabant icv infusions upregulated trabecular BV, T-BMD, and Tb.N, while reducing Tb.Sp distance in both APN-KO and WT mice. In previous studies, pharmacologic blockade of CB1 by CB1 antisense oligonucleotide and AM251 attenuated the deleterious effects of glucocorticoid treatment on bone mineral density, trabecular microarchitecture, and mechanical properties (Ko et al., 2012). CB1 antagonism was also described to improve osteoblast survival, osteoblast surface, and bone mineral acquisition, while abrogating marrow adiposity. Knockdown of CB1 restored osteogenic differentiation capacity and attenuated the activating effects of glucocorticoid on adipogenic differentiation in primary bone marrow mesenchymal cells (Ko et al., 2012). Genetic inactivation of CB1 receptor has also been shown to result in a high-peak bone mass in young mice (Idris et al., 2005) due to reduced bone resorption, but mice develop age-related osteoporosis (Idris et al., 2009) with reduced bone formation and accumulation of adipocytes in the bone marrow space, suggesting that known agonists and antagonists of CB1 may exert conflicting effects on bone metabolism at different stages of life.
The expression and anatomical distribution of CB1 have been reported to be developmental stage specific and dysregulated in several pathological conditions (Laprairie, Kelly, & Denovan-Wright, 2012). Epigenetic mechanisms, such as histone acetylation and methylation of CB1 promoter, have been shown to regulate CB1 expression (D'Addario et al., 2013). We, therefore, evaluated the expression profile of HDACs 1–9) in embryonic mouse hypothalamus N1 cells treated with gAPN for 6 hr and untreated cells by real-time PCR. Whereas the expression of HDAC3 to 9 was significantly increased by gAPN, HDAC5 exhibited the highest upregulation in APN-treated cells. We further demonstrated gAPN treatment enhanced HDAC5 messenger RNA (mRNA) and protein level in an APPL1-independent fashion, because specific APPL1 shRNA pretreatment did not impact HDAC5 expression at the mRNA or the protein levels. In a previous study, we reported that gAPN and full-length APN icv infusion increased expression of hypothalamic tryptophan hydroxylase 2 (Wu et al., 2014), the enzyme that catalyzes the rate-limiting step in the synthesis of brain-derived serotonin (Walther & Bader, 2003), and that of serotonin receptors in the hypothalamus to decrease sympathetic tone and increase trabecular mass. We also demonstrated that this central APN mechanism was APPL1-dependent whereas downregulation of hypothalamic CB1 expression by gAPN icv infusion was APPL1-independent (Wu et al., 2014). Whereas serotonin has been shown to decrease sympathetic tone and increase bone mass (Yadav et al., 2009), CB1 signaling has been reported to inhibit norepinephrine release by sympathetic neurons, hence, balancing the tonic sympathetic restraint of bone formation (Elefteriou, 2008).
One of the most frequent epigenetic modifications is histone acetylation of lysine residues in histones H3 and H4 (Kouzarides, 2007; Ruijter, van Gennip, Caron, Kemp, & van Kuilenburg, 2003; Turner, 2002), which has been associated with transcriptional activation. To investigate whether HDAC5 binds to the CB1 gene to downregulate hypothalamic CB1 expression, we examined HDAC5-CB1 interaction in N1 cells through chromatin immunoprecipitation assays. Our results demonstrated that HDAC5 interacted with the TSS2 region of the CB1 gene, supporting our hypothesis that central APN induction of peripheral bone formation occurred partly through downregulation of hypothalamic CB1 expression via histone deacetylation.
In summary, our study identified a possible novel central APN-HDAC5-CB1 signaling mechanism that promotes peripheral bone formation. These results might provide an alternative therapeutic strategy targeting the epigenetic regulation of CB1 to treat osteoporosis and age-related bone loss.
ACKNOWLEDGMENTS
We thank Y. Fu and L. Tian at the University of Alabama at Birmingham for providing APPL1 lentiviral-shRNA plasmids, Jin Tang for sample collection, tissue processing, and H & E staining, Gabriel McDonald at Boston, University for technical assistance with μCT scanning and analysis, Jennifer Newman at Tufts University for helping with metabolic cages and indirect calorimetry, and X. Han, X. Yu, and J. Lin at the Forsyth Institute for imaging collection.
FUNDING INFORMATION
This work was supported by National Institute of Dental Research Grants NIH R01-DE-25681 and R01-DE-26507 (to J. Chen), the International Association for Dental Research and Academy of Osseointegration (Innovation in Implant Sciences Award to J. Chen), the Tufts Center for Neuroscience Research (P30 NS047243), the National Natural Science Foundation of China (81300851 and 81600887), BEIJING Natural Science Foundation (7162182).
CONFLICTS OF INTEREST
The authors declare that they have no conflicts of interest.
AUTHOR CONTRIBUTIONS
H. J., Y. W., Q. T., Z. T., and J. C. conceived and designed the research. H. J., Y. W., Q. T., J. Z. performed the experiments. H. J., Y. W., Q. T., P. V., and J. Chen analyzed the data. Y. W., Q. T., P. V., L. Q. D., M. R., E. M., and J. C. interpreted the results of experiments. Y. W., Q. T., P. V. and J. Chen prepared the figures. Y. W., Q. T., P. V., and J. C. drafted the manuscript. Y. W., Q. T., P. V. and J. Chen drafted, edited, and revised the manuscript. All authors approved the final version of the manuscript.


