Chromatin-regulatory genes served as potential therapeutic targets for patients with urothelial bladder carcinoma
Abstract
Urothelial bladder carcinoma is the ninth most common cancer in the world, with an estimated 150,000 deaths per year. Two comprehensive analysis based on The Cancer Genome Atlas urothelial bladder carcinoma reported that chromatin modifier gene mutations were common in bladder cancer. We aimed to find how the mutations and transcriptional profiles of the genes involving in chromatin modification affected the prognosis of patients. The data were retrieved from the Genomic Data Commons data portal and the gene list in pathway Chromatin Modifying Enzymes were obtained from Reactome. The expression levels and mutational profiles of the genes involving in the chromatin were utilized altogether to construct a fusion patient similarity network by similarity network fusion. The genes that were differentially expressed in one clustered group or two were identified. Fifty chromatin-regulating genes had nonsilent mutations in at least 10 patients. KMT2D, KDM6A, CREBBP, ARID1A, and ARID2 had enriched inactivating mutations. Among 399 cases where both the single-nucleotide polymorphism information and the messenger RNA expression profiles were available, 326, 23, and 50 patients were clustered into Groups 1, 2, and 3, respectively. The survival analysis suggested that the patients in these three groups had a different prognosis. Thity-one genes were identified as differentially expressed in any group. The Gene Ontology term enrichment showed that the differentially expressed genes were enriched in the immune response especially in the complement activation. Altogether, chromatin-regulatory genes were key in bladder cancer and can serve, with the differentially expressed genes, as potential therapeutic targets.
1 INTRODUCTION
Urothelial carcinoma is the ninth most common cancer in the world, with an estimated 150,000 deaths per year (Jemal et al., 2011). Antoni et al. (2017) reported that about 430,000 new cases and 165,000 deaths occurred worldwide in 2012, with 75% of the total burden occurring in men according to the World Health Organization. Substantial geographic variations can be observed, with higher rates found in countries with high Human Development Index (Antoni et al., 2017).
There has been some progress in the development of novel therapeutic strategies for the treatment of the bladder cancer in the past two decades (Bellmunt & Petrylak, 2012; Weintraub et al., 2014). However, survival time from bladder cancer has kept steady since 1990 in developed countries such as Norway, where the 5-year survival was 73% and 76% in 1994–1998 and 2009–2013, respectively (Nielsen et al., 2014). In fact, current chemotherapy provided only a modest survival benefit for patients with bladder cancer, and only a limited number of patients achieving long-term control of the cancer progression. Health care costs were estimated as over $4 billion per year in the United States alone (Li et al., 2017). As a result, more research and better treatment strategies are needed for these patients from both clinical and economic perspectives.
Alterations in the epigenetic regulation attracted more and more attention because of the importance to tumorigenesis other than the alterations in the DNA sequences (Plass et al., 2013). Epigenetic modifications of DNA and histones determined active and repressive chromatin states of genes or chromosomal regions, which further modulated the gene expression levels. For example, recurrent mutations were found in genes encoding the DNA methyltransferase 3A in acute myeloid leukaemia (Ley et al., 2010; Mardis et al., 2009). The epigenetic regulation might be especially important in the bladder cancer. Watson et al. (2012) identified a methylation hotspot in the death receptor Fas/CD95 in bladder cancer. The methylation status of CDH11 might be used as an independent prognostic biomarker for patients with bladder cancer (Lin et al., 2015). UHRF1, as an epigenetic regulator, plays important roles in the tumorigenesis and cancer progression, which increased bladder cancer cell invasion by epigenetic silencing of KiSS1 (Zhang et al., 2014).
Two comprehensive analysis based on The Cancer Genome Atlas (TCGA) urothelial bladder carcinoma reported that chromatin modifier gene mutations were common in bladder cancer (Cancer Genome Atlas Research, 2014; Robertson et al., 2017). The same datasets as Robertson et al. (2017) were utilized to dig into the impacts of these chromatin modifier genes, which were only simply mentioned in these two comprehensive papers. We aimed to find how the mutations and transcriptional profiles of the genes involving in chromatin modification affected the prognosis of patients with the bladder cancer and might obtain potential therapeutic opportunities.
2 METHODS
2.1 Bladder cancer data from Genomic Data Commons (GDC)
There were totally 412 cases of the urothelial bladder carcinoma from TCGA project in the GDC data portal (Grossman et al., 2016). The clinical information was retrieved using TCGA biolinks (Colaprico et al., 2016). The Level 3 data of transcriptome profiling from Illumina RNA-Seq platform, processed mutation files using MuTect2 from exome sequencing (Cibulskis et al., 2013) and DNA methylation levels from Illumina Human Methylation 450 were directly downloaded using the GDC client successively in early November 2017.
2.2 Mutated genes involving in chromatin modification
The genes participating in modifying or regulating chromatin were obtained from the Reactome Knowledgebase (Croft et al., 2014; Fabregat et al., 2017). Jupe (2014) defined the pathway “Chromatin Modifying Enzymes,” which contained 241 different proteins. The mutation information of the genes encoding these 241 proteins was extracted from the Mutation Annotation Format (MAF) file download from the GDC. After removing the synonymous mutations, the mutations were categorized into missense mutations, in-frame indels, frame shift indels, mutations in splice regions, nonsense mutation, and mutations at the translation start site. The genes with mutations in at least 10 patients were visualized using OncoPrint (Cerami et al., 2012; Gao et al., 2013) and plotted with R package ComplexHeatmap (Gu et al., 2016).
2.3 Subtypes of bladder cancer
The counts of genes based on HTSeq were retrieved from GDC and the counts per million were calculated for each gene. The normalization procedures were executed by EDASeq to remove with-lane and between-lane differences. The expression levels and mutational profiles of the genes involving in the chromatin were utilized altogether to figure out whether there existed subtypes of bladder cancer. Similarity network fusion (SNF) was used to construct a fusion patient similarity network by integrating the patient similarity obtained from mutational and transcriptional profiles, which included the similarity matrix calculated by a cross-network diffusion process and a clustering step (Wang et al., 2014). These procedures were carried out using the R package CancerSubtypes (Xu et al., 2017). The number of nearest neighbors was set as 30 and the variance for local model was 0.5. The number of clusters was determined by the average silhouette width. If the number of clusters was set as 3, compared with other number between 2 and 10, the average silhouette width was maximized.
To identify whether the clustered groups were correlated with clinical parameters, different statistical methods were used including analysis of variance tests for age at diagnosis and the packs smoked, log-rank test for survival status (Harrington & Fleming, 1982) and Fisher's exact test for all other histoclinical parameters (Agresti, 2002). To visualize the survival status, the Kaplan–Meier curves were plotted.
2.4 DNA methylation data preprocessing
Considering that the DNA methylation is one important mechanism modifying chromatin and the methylation datasets from Illumina Human Methylation 450 were available, the methylation levels was calculated for each genes with R package MethylMix (Gevaert, 2015). First, the samples with over 50% of unavailable data were eliminated and the left unknown cells were imputed based on the other data. Next, each probe of DNA methylation was mapped to a gene based on the annotation of Illumina methylation arrays. Probes with single-nucleotide polymorphisms (SNPs) were removed. Finally, for each gene, all its CpG sites were clustered together using hierarchical clustering and Pearson's correlation. Then the hierarchical tree was cutoff at a Pearson's correlation threshold of 0.4 to define CpG site clusters and single CpG sites when they do not correlate with other sites, resulting in potentially multiple CpG site clusters representing a single gene.
2.5 Genes probably regulated by chromatin structure
The genes, which were differentially expressed in one clustered group or two with R package EBSeq, were identified (Leng et al., 2013). The genes with adjusted p value (false discovery rate [FDR]) lower than 0.05 were considered as significant. Biological functional analysis was finished using DAVID bioinformatics resources (Huang da et al., 2009, 2009). Combined with their DNA methylation levels, we obtained genes whose messenger RNA (mRNA) expression levels were also negatively correlated with the methylation levels.
3 RESULTS
3.1 The mutational profiles of chromatin-regulatory genes
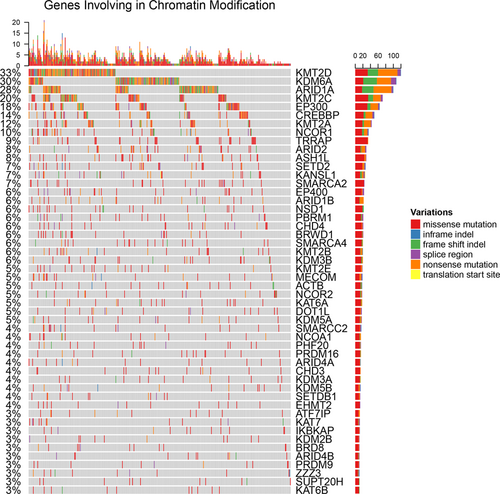
Fifty of the 241 chromatin-regulating genes had nonsilent mutations in at least 10 patients, which were shown in the OncoPrints (Figure 1). Individual genes were represented as rows, and individual cases were represented as columns. The SNPs, including truncated mutations, in-frame deletion or insertion and missense mutations, were shown as different colors.

OncoPrint showing the distribution of genomic alterations in urothelial bladder carcinoma. The OncoPrint provides an overview of genomic alterations in particular genes affecting individual samples. Each row represented a gene and each column represented a sample. The colors showed the types of mutations according to the legend [Color figure can be viewed at wileyonlinelibrary.com]
The genes had mutating frequency over 5% included histone demethylases (like KDM6A), histone methyltransferases (like KMT2A, KMT2C, and KMT2D), histone acetylases (like CREBBP and EP300), members of the SWI/SNF chromatin remodeling complex (like ARID1A and ARID2), and histone demethylase (like KDM6A), which were listed in Table 1. The mutation counts of different types were also calculated. Mutations in some genes were predominantly inactivating. For example, KMT2D, KDM6A, CREBBP, ARID1A, and ARID2 had more inactivating mutations than nonsynonymous mutations or in-frame indels. Compared with other genes, nonsilent mutations in genes involving in the chromatin modification were significantly enriched. Such findings suggested that these genes were functionally relevant with the cancer progression.
| Groups | Symbol | Description | #Inactivating | #Nonslient | #Silent |
|---|---|---|---|---|---|
| Histone methyltransferase | ASH1L | ASH1 like histone lysine methyltransferase | 5 | 28 | 4 |
| KMT2A | Lysine methyltransferase 2A | 26 | 28 | 9 | |
| KMT2B | Lysine methyltransferase 2B | 7 | 14 | 7 | |
| KMT2C | Lysine methyltransferase 2C | 47 | 50 | 10 | |
| KMT2D | Lysine methyltransferase 2D | 106 | 54 | 14 | |
| NSD1 | Nuclear receptor binding SET domain 1 | 3 | 20 | 5 | |
| SETD2 | SET domain containing 2 | 7 | 24 | 2 | |
| Histone demethylase | KDM3B | Lysine-specific demethylase 3B | 4 | 16 | 4 |
| KDM6A | Lysine demethylase 6A | 90 | 25 | 5 | |
| Histone acetylases | CREBBP | CREB-binding protein | 28 | 25 | 9 |
| EP300 | E1A-binding protein P300 | 32 | 41 | 5 | |
| EP400 | E1A-binding protein p400 | 6 | 17 | 9 | |
| KANSL1 | KAT8 regulatory NSL complex subunit 1 | 13 | 14 | 2 | |
| TRRAP | Transformation/transcription domain-associated protein | 1 | 37 | 6 | |
| Histone deacetylases | CHD4 | Chromodomain-helicase-DNA-binding 4 | 5 | 21 | 6 |
| NCOR1 | Nuclear receptor corepressor 1 | 16 | 26 | 7 | |
| SWI/SNP complex | ARID1A | AT-rich interaction domain 1A | 85 | 36 | 7 |
| ARID1B | AT-rich interactive domain 1B | 11 | 15 | 7 | |
| ARID2 | AT-rich interactive domain 2 | 16 | 15 | 7 | |
| SMARCA2 | SWI/SNF related, matrix associated, actin dependent regulator of chromatin, Subfamily A, Member 2 | 1 | 23 | 1 | |
| SMARCA4 | SWI/SNF related, matrix associated, actin dependent regulator of chromatin, Subfamily A, Member 4 | 4 | 18 | 5 | |
| PBRM1 | Polybromo 1 | 7 | 18 | 3 | |
| WD repeat protein | BRWD1 | Bromodomain and WD repeat domain containing 1 | 3 | 19 | 3 |
The inactivating mutations on KMT2D and KDM6A were highly exclusive, where only eight patients had both inactivating mutations and 158 patients had only inactivating mutations in one gene. Similar patterns were presented between EP300 and CREBBP. The possible reasons include that mutations in the two genes have redundant downstream effects or the combined loss cause synthetic lethality.
3.2 The subtypes of bladder cancer based on chromatin-regulatory genes
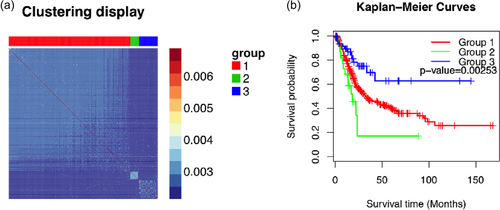
SNF clustering was performed with a cluster number as three. The patients were divided into three groups using the mutation information and the mRNA expression levels of 241 chromatin-regulatory genes. And the similarity between patients were represented by the proportion of clustering runs in which two patients were group together, which was named as consensus values (Figure 2a). In the plot, patients belonging to the same cluster were adjacent to each other and color-coded gradient represented the similarity, which showed that the patients were clearly clustered into different groups.

The subtypes of patients based on the chromatin-regulatory genes. (a) The consensus clustering of the patients using the mutations information and messenger RNA expression profiles. The patients belonging to the same cluster were adjacent to each other and color-coded gradient represented the similarity. The top panel showed the clustered group and right panel showed the legend for similarity. (b) The Kaplan–Meier curves of three groups and the p value was calculated using log-rank test [Color figure can be viewed at wileyonlinelibrary.com]
Among 399 cases where both the SNP information and the mRNA expression profiles were available, 326, 23, and 50 patients were clustered into Groups 1, 2, and 3, respectively. We checked whether there existed differences among groups based on pathologic stage, gender, race, age, or the number of packs the patients smoked every year (Table 2). However, there was no significant relationship. Only the number of packs seemed to have poor correlation with a p value of 0.06. On the other hand, the survival analysis suggested that the patients in these three groups had a different prognosis. The p value of the log-rank test was 0.0025. The patients in Group 2 had significantly low survival time while those in Group 3 had better prognosis (Table 3).
| Category | Group 1 | Group 2 | Group 3 |
|---|---|---|---|
| Total cases | 326 | 23 | 50 |
| Pathologic stage | 108 | 5 | 14 |
| II | 114 | 6 | 18 |
| III | 102 | 12 | 18 |
| IV | |||
| Gender | 91 | 7 | 8 |
| Female | 235 | 16 | 42 |
| Male | |||
| Race | 38 | 2 | 3 |
| Asian | 18 | 1 | 3 |
| Black | |||
| White | 254 | 20 | 44 |
| Age, mean (SD) | 29.9 (11.0) | 32 (8.2) | 30.1 (9.2) |
| Smoked pack per year, mean (SD) | 34.6 (18.2) | 24.7 (18.3) | 28.7 (18.0) |
| Category | ID | Term | p | Fold enrichment |
|---|---|---|---|---|
| Biological process | GO:0006956 | Complement activation | 3.04E−03 | 34.06 |
| GO:0006958 | Complement activation, classical pathway | 3.91E−03 | 29.93 | |
| GO:0038096 | Fc-ɣ receptor signaling pathway involved in phagocytosis | 6.35E−03 | 23.33 | |
| GO:0006955 | Immune response | 6.87E−03 | 9.38 | |
| GO:0038095 | Fc-epsilon receptor signaling pathway | 1.22E−02 | 16.65 | |
| GO:0050776 | Regulation of immune response | 1.22E−02 | 16.65 | |
| GO:0006898 | Receptor-mediated endocytosis | 1.32E−02 | 15.93 | |
| Cellular component | GO:0009897 | External side of plasma membrane | 2.04E−02 | 12.83 |
| GO:0005615 | Extracellular space | 4.71E−02 | 3.38 | |
| Molecular function | GO:0003823 | Antigen binding | 3.68E−03 | 30.73 |
| GO:0004252 | Serine-type endopeptidase activity | 2.10E−02 | 12.41 |
3.3 Differentially expressed genes among clustered groups
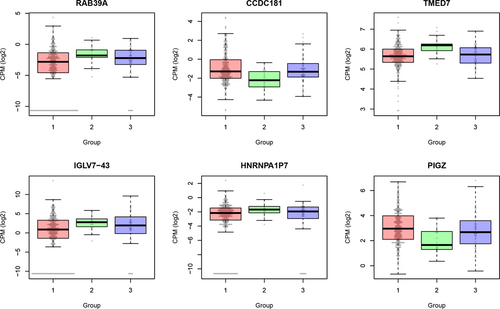
R package EBSeq was utilized to obtain the genes that were significantly expressed in at least one group. The obtained p values were adjusted by FDR and 0.05 was used as the cutoff for significance. Thirty-one genes were identified as differentially expressed finally. The boxplots of top six were shown as Figure 3.

The boxplots of differentially expressed genes that were significantly expressed in at least one clustered group. The detailed data were added to the boxplots as bee swarm plot. The x-axis represented the group and the y-axis was the log scale of normalized counts per million [Color figure can be viewed at wileyonlinelibrary.com]
Next, the correlations between DNA methylated levels and the mRNA expression levels were checked but there showed no correlation. It suggested that the variety of mRNA expression levels of these genes were not regulated by the DNA methylation but other factors. Chromatin structure was one possible factor, where the aberrant status of chromatin-regulatory genes affected the expression levels of the differentially expressed genes.
The GO term enrichment showed that the differentially expressed genes were enriched in the immune response especially in the complement activation.
4 DISCUSSION
We confirmed that chromatin-regulatory gene mutations were common in bladder cancer, where inactivating mutations were enriched. It hinted that the genes involving in the chromatin modification might be open to potential therapeutic opportunities. Actually, multiple studies and clinical trials investigated the usage of molecules targeted these genes in the treatment.
Ler et al. (2017) reported that loss of KDM6A would amplify PRC2-regulated transcriptional repression in bladder cancer and could be targeted through inhibition of EZH2. Moreover, in preclinical models the BET inhibitor JQ1 and inhibition of EZH2 have therapeutic benefit (Filippakopoulos et al., 2010; Wu et al., 2016). Another example is Mocetinostat, which is a histone deacetylase inhibitor and was able to increase tumor antigen presentation, decrease immune suppressive cell types and augment checkpoint inhibitor therapy (Briere et al., 2017).
Our results also suggested that inactivating mutations on KMT2D and KDM6A, or EP300 and CREBBP were highly exclusive. CREBBP and EP300 are highly conserved with 75% similarity, which causes many functional similarities. Their exclusive mutations can be explained by the fact that they have redundant downstream effects. With regard to KMT2D and KDM6A, they played different roles as histone methyltransferase and histone demethylase, respectively. They combined loss may be synthetically lethal or their downstream effects are redundant considering that KDM6A interacted with a C-terminal region of KMT2D and that they coregulated a cohort of oncogenes and prometastatic genes (Kim et al., 2014).
The patients were clustered into three groups using the mutations and expression profiles of the chromatin modifier genes. Moreover, the patients in these three groups a had distinct prognosis, which hinted the role of chromatin-regulatory genes in the cancer prognosis or metastasis.
Furthermore, we identified the differentially expressed gene among the clustered group that might serve as the downstream effects of the chromatin modifier genes. The top list included RAB39A, CCDC181, TMED7, IGLV7-3, HNRNPA1P7, PIGZ, and so forth. Hypermethylation of CCDC181, also named as C1orf114, was an independent predictor of time to biochemical recurrence after radical prostatectomy in two prostate cancer patient cohorts (Haldrup et al., 2013). Doyle et al. (2012) proposed the potential role for TMED7 in modulating TLR4 in antitumor immunity. These genes might have important functions in the cancer progression.
5 CONCLUSION
Our results suggested that the inactivating mutations recurrently occurred in chromatin-regulatory genes, which might affect the patients’ survival status. Furthermore, we tried to figure out the downstream influence of the mutations on the chromatin-regulatory genes and identified 31 genes that were differentially expressed in any groups, which were obtained by consensus clustering of the mutations or expression profiles of chromatin-regulatory genes. Finally, the potential therapeutic targets were proposed.
CONFLICTS OF INTEREST
The authors declare that there are no conflicts of interest.


