Dynamics changes in the transcription factors during early human embryonic development
Abstract
Development of an embryo from a single cell, zygote, to multicellular morulae requires activation of hundreds of genes that were mostly inactivated before fertilization. Inevitably, transcription factors (TFs) would be involved in modulating the drastic changes in gene expression pattern observed at all preimplantation stages. Despite many ongoing efforts to uncover the role of TFs at the early stages of embryogenesis, still many unanswered questions remained that need to be explored. This could be done by studying the expression pattern of multiple genes obtained by high-throughput techniques. In the current study, we have identified a set of TFs that are involved in the progression of the zygote to blastocyst. Global gene expression patterns of consecutive stages were compared and differences documented. Expectedly, at the early stages of development, only a few sets of TFs differentially expressed while at the later stages hundreds of TFs appear to be upregulated. Interestingly, the expression levels of many TFs show an oscillation pattern during development indicating a need for their precise expression. A significant shift in gene expression was observed during the transition from four- to eight-cell stages, an indication of zygote genome activation. Additionally, we have found 11 TFs that were common in all stages including ATF3, EN1, IFI16, IKZF3, KLF3, NPAS3, NR2F2, RUNX1, SOX2, ZBTB20, and ZSCAN4. However, their expression patterns did not follow similar trends in the steps studied. Besides, our findings showed that both upregulation and active downregulation of the TFs expression is required for successful embryogenesis. Furthermore, our detailed network analysis identified the hub TFs for each transition. We found that HNF4A, FOXA2, and EP300 are the three most important elements for the first division of zygote.
1 INTRODUCTION
Molecular mechanism governing the embryos preimplantation stages might hold the key to successful assisted reproductive technology (Niakan, Han, Pedersen, Simon, & Pera, 2012). Early stages in mammalian embryos harbor transcriptional activities that are different from those observed in later stages of development. Shortly after fertilization, the genomes should be reactivated (both maternal and paternal genomes), a process that is known as zygote genome activation (ZGA; M. T. Lee, Bonneau, & Giraldez, 2014; Tadros & Lipshitz, 2009). The early stages of embryogenesis and proper activation of the genome is crucial for successful development. Previous studies have identified distinct, but overlapping gene expression dynamics during the first stages of embryonic development, especially from zygote to morula stages (Schier, 2007; Walser & Lipshitz, 2011). Thanks to applying high-throughput transcriptomics approaches, including microarray and RNA-sequencing methods, many aspects of preimplantation events have been uncovered (Fan et al., 2015; Hamatani, Carter, Sharov, & Ko, 2004; Misirlioglu et al., 2006; Petropoulos et al., 2016; Sirard et al., 2004; Vallée et al., 2008; Wang et al., 2017; Yan et al., 2013; Zeng & Schultz, 2005).
Expectedly, the recruitment of several thousand of genes at the early stages of development would be under direct regulation by different types of transcription factors (TFs). Therefore, some attempts were made to catalog known TFs during early embryogenesis in model organisms including Ciona intestinalis (Imai, Hino, Yagi, Satoh, & Satou, 2004). Later, identification of the exact role of TFs at early stages was the prime goal of many studies. It was well established that TIF1α is the modulator of early embryogenesis in mouse (Torres-Padilla & Zernicka-Goetz, 2006). BRG1 was shown to be involved in mouse ZGA because the mutant of this gene exhibited a range of phenotypes, all linked to the dysfunctional genome (Bultman et al., 2006). Jin and O’Neill (2014) showed that coexpression of two transcriptional factors CREB and AFT1 is required for the development of the preimplantation embryo. Stage-specific TFs were also introduced, using more precise dissection methods. For example, it has been shown that OCT4 is initially expressed at eight-cell stages, while CDX2 was detected in blastocyst stages (Niakan & Eggan, 2013). In addition to studies in human and mouse, the role of USF1 during preimplantation stages of embryogenesis was also documented in bovine (Datta et al., 2015).
Despite, all progress made in the last two decades, identification of these TFs was very slow, due to the nature of samples and difficulties related to the detection of low-level gene expression, that is a characteristic of many TFs. Thankfully, recent advances in transcriptomics at single cell resolution, in addition to improved data analysis methods, unveiled many more key factors during these stages. For example, recently, it has been discovered that double homeobox (DUX)-family of TFs are involved in regulation of majority of genes during zygote genome activation (De Iaco et al., 2017; Hendrickson et al., 2017). Availability of high-quality data, paved the way for several comparative studies, with the aims to understand the similarities and differences in the nature and dynamics of TFs during early embryogenesis in different species. In one of such investigation, Schep and Adryan (2013) studied the TFs expression in the embryo of Danio rerio, Xenopus tropicalis, C. intestinalis, Drosophila melanogaster, Anopheles gambiae, and Caenorhabditis elegans. Furthermore, system-level approaches used to not only assess the dynamics of the TFs expression but also to discover the regulatory networks of TFs and other regulatory elements during the early embryogenesis. For example, Xie et al. (2010) performed a gene regulatory network (GRN) analysis, to investigate the regulatory events in the mammalian preimplantation stages. Furthermore, they have compared the regulatory networks between three species: human, mouse, and bovine. As a result, they have identified differences and similarities among various regulatory modules in these species. Although they have conducted a comprehensive analysis using their data, there is still room for further analysis of their valuable transcriptome resources. Especially, we have used their data to further investigate the dynamics of GRN, from one stage to the next, in human embryogenesis.
We found that overall gene expression of embryo drastically changes from eight-cell stages onward. Additionally, our findings highlighted the dynamics of TFs expression at the onset of the embryo. Few differentially expressed TFs (DE-TFs) were detected at the first two divisions, while, from eight-cell stage to morulae more than 200 TFs were involved. Some TFs were undetectable following the transition from one stage to the next, others showing up and get upregulated as the embryo develops. Interestingly, oscillated pattern of expression was documented for some TFs including ATF3, EN1, IFI16, IKZF3, KLF3, NPAS3, NR2F2, RUNX1, SOX2, ZBTB20, and ZSCAN4. Our findings could be useful for dissecting the molecular mechanisms during early stages of embryo development with possible implications in developmental biology.
2 MATERIALS AND METHODS
2.1 Data preparation
Transcriptome analysis conducted at the early stages of embryonic development (preimplantation), using a freely available data set deposited by Xie et al. (2010) at the Gene Expression Omnibus (GEO) under accession number GSE18290. This unique data set contains gene expression measurements for different species including Homo sapiens; Bos taurus; and Mus musculus, collected at several stages including 1, 2, 4, and 8 cells plus morula and blastocyst (Xie et al., 2010). The original study used these data to compare the regulatory aspects of preimplantation among different mammalians by reconstruction of the GRNs. Here, instead of using the global gene expression changes used by the original paper, we have performed a rather deep network analysis on the alterations of TFs and the dynamics of GRN, during consecutive stages of human embryonic development.
2.2 Gene expression analysis
The initial step was extraction of the differentially expressed genes (DEGs) by comparing each stage with that of the previous stage. Altogether, five gene lists were prepared and used for the follow-up analysis. The GEO2R tool, which used the Limma package and implemented at National Center for Biotechnology Information, was used to extract DEGs. The lists were further inspected manually and the genes with insignificant changes (p ≤ 0.05) were removed from the lists to achieve the highest confidence for the gene expression alterations. Additionally, after applying log transformation a threshold of ±0.8 (which is equal to 1.75-fold changes in gene expression) was set as DEGs. After removal of duplicate values and missing values, the final lists of unique genes were used for the further analysis.
2.3 Detection of TFs in the list of DEGs
To find those TFs that undergo differential expression during transition from one stage to the next, the lists of DEGs were compared with the experimentally validated TFs deposited in the Tfcheckpoint data set (Chawla, Tripathi, Thommesen, Lægreid, & Kuiper, 2013). Only those TFs harboring general DNA-binding features were considered for further analysis. Additionally, using the ChEA database, we have first predicted and then identified those DE-TFs that are involved in the regulation of the DEGs (Lachmann et al., 2010). This database contains data on protein–DNA interactions from ChIP-X experiments. To do so, the gene list was submitted following the instruction and a list of predicted TFs and their target genes were obtained from the database. Those TFs with a p ≤ 0.1 were selected and their presence on the list of DEGs was determined. This approach results in lists of DE-TFs and their target at each transition. The Supporting Information file contains raw data for DEGs and DE-TFs.
2.4 Network construction and analysis
The protein–DNA interaction networks were constructed using the output of the ChEA database. Protein–protein networks were constructed by extracting the information regarding TFs interactions from STRING database. Only experimentally validated interactions were considered representing moderate to high confidence interactions (Szklarczyk et al., 2017). Cytoscape 3.4.0 (Shannon et al., 2003) and Gephi v 0.9.1 (Bastian, Heymann, & Jacomy, 2009) software were used to visualize and analyze the networks. The core regulatory networks were constructed following the integration of both protein–DNA and protein–protein interactions (PPIs). Networks were analyzed for the centrality parameters including degree and betweenness (Yu, Kim, Sprecher, Trifonov, & Gerstein, 2007). Main subclusters in the core regulatory networks were identified utilizing the MCODE v1.4.2 plug-in of Cytoscape (Bader & Hogue, 2003). The network score setting includes loops and cut-off 2 for the degree, while default setting was used for the cluster discovery. The top subcluster ranked by MCODE was selected as the main cluster of genes in the core regulatory network.
2.5 Gene clustering and differential analysis
To cluster genes, the log 2 values obtained for gene expression were extracted and the clustering and visualizing of different classes were conducted in the heatmap3 package of R (Zhao, Guo, Sheng, & Shyr, 2014). Heatmap3 uses hierarchical clustering as an efficient method for clustering microarray data.
2.6 Annotation of TFs
Annotation of the TFs performed in DAVID (Huang, Sherman, & Lempicki, 2008) and only information provided by Gene Ontology (GO) and Kyoto Encyclopedia of Genes and Genomes (KEGG) were considered as significant.
2.7 Data validation
To validate our findings, we have used two recently published datasets including GSE36552 (Yan et al., 2013) and GSE71318 (Dang et al., 2016). These RNA-sequencing data are comparable to the one we have used for the main analysis. The data were log 2 transformed and averaged to obtain the gene expression trends for the selected genes.
3 RESULTS
Using network analysis approaches, we have studied the dynamic changes in TFs expression during early stages of human embryogenesis. Transcriptome data collected at each stage were compared and the key hub genes were identified in the gene regulatory and PPI networks. Expectedly, overall gene expression increases with embryo development. Here, we have shown that the increase in the gene expression is under the regulation of few TFs at the early stages and is regulated by hundreds of TFs in the later stages of embryogenesis. The most important TFs for each stage were identified and presented for further investigations.
3.1 Detection of DEGs
During the early stages of embryonic development alterations in the gene expression pattern were observed for many genes. To highlight these changes, DEGs were identified following a comparison between consecutive stages. Figure 1 shows both the number and the expression patterns (up- and downregulation) of the DEGs. As expected, we found the lowest number of DEGs between one- and two-cell stages (1,784 DEGs) followed by four- versus two-cell comparison (2,264 DEGs). On the other hand, the highest number of gene alterations (9,232 DEGs) happened through the transition from four- to eight-cell stages (Figure 1a). Interestingly, in all comparisons upregulation was the dominant trends in the genes expression pattern, except for the transition from four- to eight-cell stages, where about 60% of genes showed downregulation. At least 20% of the DEGs were common between two- versus four-cell and eight- versus four-cell stages, while this number increases to 50% among the later stages (Figure 1a). Additionally, 109 DEGs showed constant expression through all stages. Hierarchical clustering of DEGs, based on log 2-transformed expression values, was able to cluster these stages into distinct groups (Figure 2). Expectedly, Stages 1-, 2-, and 4-cell were clustered together in one group, and 8-cell, morulae, and blastocyst were grouped in a separate cluster.
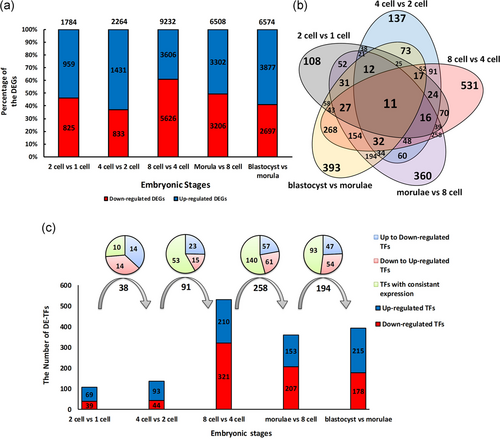
Analysis of gene expression and detection of DE-TFs during early human embryogenesis. (a) DEGs were identified during the transition of the embryo from one-cell to morula. The number on top of each bar indicates the total number of DEGs, while the numbers inside the bars indicate the number of genes that are either up- (blue color) or downregulated (red color). (b) The status of common TFs involved in each transition. Eleven TFs are common among all stages. (c) Dissection of differentially expressed TFs involved in the transitions from one-cell to morula. A comparison was also made between successive stages to find overlapping DE-TFs that are given above bars. The numbers on arrows are the total number of overlapped DE-TFs. The expression pattern of these TFs either constant (yellow) or up- (blue) and downregulation (red) are given in the pie graph. DEG: differentially expressed gene; DE-TF: differentially expressed TF; TF: transcription factor [Color figure can be viewed at wileyonlinelibrary.com]
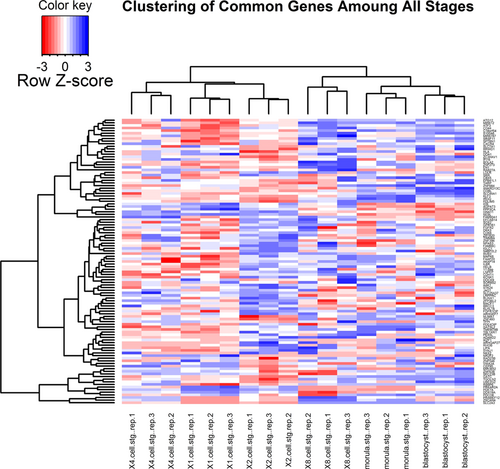
Cluster analysis of gene expression. Preimplanting embryos at different stages were clustered into two distinct clusters. One cluster contains replicates of zygotes, one-, two-, and four-cell stages. While eight-cell, morula, and blastocyst grouped into the second cluster. This indicates a major shift in the gene expression from eight-cell stage onward [Color figure can be viewed at wileyonlinelibrary.com]
3.2 Comparison between DE-TFs during different stages of embryogenesis
To obtain more details regarding the regulation of the gene expression we have extracted the DE-TFs. Expectedly, variation in the expression of multiple TFs was observed at each stage (Figure 1c). At least 100 TFs undergo expression changes during the transition from one- to two-cell and from two- to four-cell stages. While, in later stages, comparably higher number of TFs are getting involved, where expression of 531 TFs changes during the transition from four- to eight-cell stage. Interestingly, the counts of TFs were concurrent with the number of DEGs in these stages, suggesting immediate action by these TFs on the dynamic of transcriptomes (Figure 1c). However, this trend was not observed for the transition from eight-cell to morulae stage.
We have also extracted the list of common DE-TFs between successive stages. The highest number of common DE-TFs were identified at the later stages, indicating constant expression of many TFs across several stages. For example, around 268 TFs are expressed from four-cell stage to blastocysts. Additionally, we have identified 11 DE-TFs among all stages, from one-cell to blastocyst, that includes ATF3, EN1, IFI16, IKZF1, KLF3, NPAS3, NR2F2, RUNX1, SOX2, ZBTB20, and ZSCAN4 (Figure 1b). Next, we have extracted both the expression values and the relative changes of these common TFs among the developmental stages (Figure 1c). Both up- and downregulation of TFs expression were observed when different stages were compared. For example, we detected 28 deregulated TFs among 38 common DE-TFs during the transition from Stages 1 and 2 (one- to two-cell and two- to four-cell transitions, respectively). A sharp increase was observed at the transition from four- to eight-cell stage, where more than 500 TFs showed deregulation in their expression patterns. At least 250 of these TFs showed consistent expression through the transition from eight-cell to morulae.
3.3 Identification of the biological process regulated by DE-TFs
Cluster analysis of the DE-TFs precisely separated these stages from their previous stage. For example, two distinct clusters were detected when two-cell stages were compared with zygote, indicating subtle differences in the regulation of gene expression (Figure 3a–e). Accordingly, when these DE-TFs were annotated, remarkable differences were observed between the biological processes for these upregulated and downregulated TFs groups. Expectedly, the transcription is the main process controlled by these TFs, therefore we have excluded this annotation from the list of biological processes. Interestingly, early stages of embryonic development, harbor a limited number of biological processes, while a wide range of processes, many of them being less general, have been identified at later stages. For example, at the transition from one- to two-cell stages (Figure 3a) about 10% of downregulated TFs (E2F4, EP300, TRPS1, and PITX3) are related to organ stem cell differentiation and morphogenesis, while more than 10% of upregulated TFs are related to cell differentiation including NR1D1, ELF5, CREM, ONECUT3, PAX8, TP53, PAX4, and TXK. In the comparison between four- and two-cell stages (Figure 3b), we found that TFs related to cell differentiation and organ morphogenesis (ZBTB7A, CDX1, CREM, PAX8, ONECUT2, PAX4, ELK3, and ARNT) are downregulated. In contrast, upregulated TFs were involved in multicellular organism development (HLF, HOXB2, ZFX, HOXA9, HOXD13, HIVEP2, VENTX, HMGA2, GRHL1, ZNF219, and KLF3) and controlling of cell proliferation (SUZ12, E2F3, E2F7, ATF3, HES5, TFAP2B, SOX4, PBX1, POU3F2, MYC, JUN, KLF4, KLF10, SMAD4, TFAP2A, and FOXO4). Such distinct processes could not be extracted from the annotation of DE-TFs at later stages, due to lack of consistency among up- and downregulated TFs (Figure 3d). However, engagement of many key processes in morphogenesis was evident from annotations of DE-TFs at later stages (Figure 3e).
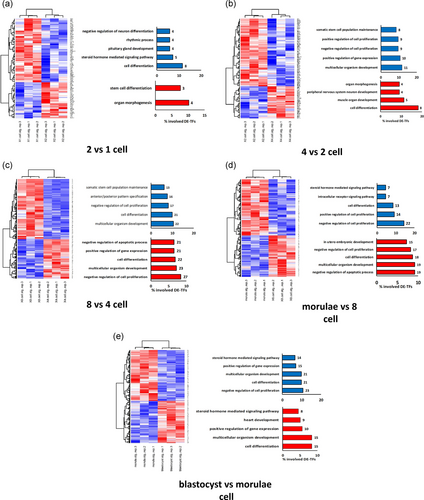
Clustering based on DE-TFs and the annotation of the DE-TFs. Distinct clusters in all stages are evident based on the expression of DE-TFs. GO of the up- and downregulated TFs was also provided alongside each cluster. (a) Transition from zygote to two-cell stage, (b) transition from two- to four-cell stages, (c) transition from four- to eight-cell, (d) transition from eight-cell to morula, and (e) transition from morula to blastocyst. DE-TF: differentially expressed TF; GO: gene ontology; TF: transcription factor [Color figure can be viewed at wileyonlinelibrary.com]
3.4 Identification of common DE-TFs among all stages
As noted earlier, 11 TFs were detectable in all developmental stages studied here. To dissect their expression pattern during each stage and upon transition from one stage to the next, we have extracted the expression values for these TFs from the primary data (Figure 4). Interestingly, both coexpression and antiregulation were observed among the expression patterns of these TFs. For instance, ATF3, EN1, ZBTB20, and ZSCAN4 were all upregulated through stages from one- to eight-cell and were downregulated afterward. Expression pattern of SOX2 was very similar to that of ATF3, EN1, ZBTB20, and ZSCAN4 with an exception for eight-cell to morulae stages, where SOX2 remained upregulated. In fact, SOX2 was upregulated in all stages until the last stage of development studied. In contrast to SOX2, RUNX1 was the only TFs that were upregulated at the start of development (from one- to two-cell) and downregulated afterward. IKZF1 and NAPS3 are the other TFs that are upregulated at both transition from one- to two-cell and morulae to blastocyst stages, whereas its expression downregulated in all other middle stages. KLF3 showed an opposite expression pattern compared with those of IKZF1 and NAPS3. Notably, we have observed a fluctuated pattern in the expression of IFI16 and NR2F2 in early embryogenesis stages.
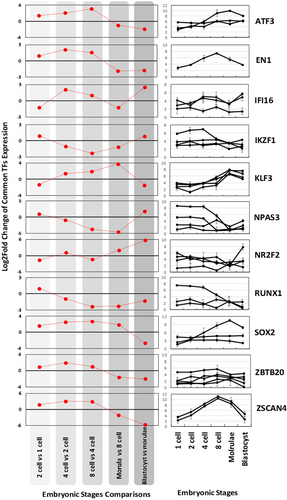
The expression pattern of 11 common DE-TFs detected for all stages studied. The trend of their expression changes is given by red lines. Additionally, their raw expression values in the three replicates are presented in the right panels. DE-TF: differentially expressed transcription factor [Color figure can be viewed at wileyonlinelibrary.com]
3.5 Network-based analysis of the DE-TFs
We have constructed protein–DNA (for all DEGs and only DE-TFs) and PPI networks to detect the central TFs at each stage of embryogenesis (Figures 6 and 7). In addition, main clusters of TFs were detected through network clustering algorithm of molecular complexes (Figure 5). Altogether, four types of networks for each stage was constructed, including protein–DNA network for all DEGs, protein–DNA network for all DE-TFs, PPIs for the DE-TFs, and a core regulatory networks (Figure 8) that were extracted from global network analysis through MCODE algorithm. During the transition from one- to two-cell stage, we have detected HNF4A, FOXA2, and EP300 as the key factors for regulation of all DEGs and TFs (Figures 5 and 8). PPI network analysis showed EP300 has the highest number of interaction with other TFs. FOXA2 and EP300 were also detected as important genes in the core network (Figure 8). Surprisingly, the expression of the most important TFs was upregulated, except for EP300.

Analysis of DE-TFs at each stage. The number of the target genes with differential expression at each transition is given for each TFs. The color shows how the expression of each TFs changes during the transition; blue for upregulation and red for downregulation. DE-TF: differentially expressed TF; TF: transcription factor [Color figure can be viewed at wileyonlinelibrary.com]
The protein–DNA network analysis showed that SOX2, ATF3, KLF4, and JUN are the major players during the transition from two- to four-cell stage (Figure 5b). However, the PPI network analysis at these stages indicated that different TFs including SMAD4, MYC, and JUN are the hub proteins (Figure 6b). Interestingly, the core regulatory network put JUN and ATF3 as hub genes during this transition (Figure 8b), which all were upregulated.
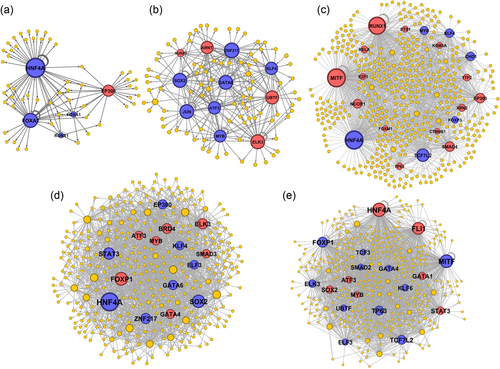
Gene regulatory networks in the preimplantation embryo. The hub genes are presented by bigger nodes. Blue was used to show upregulated nodes at the given stages and red was used to show downregulated nodes. (a) Zygote to two-cell transition, (b) two- to four-cell transition, (c) four- to eight-cell transition, (d) eight-cell to morula transition, (e) morula to blastocyst transition [Color figure can be viewed at wileyonlinelibrary.com]
While conversion of four- to eight-cell embryo predicted to be mostly regulated by HNF4A, MITF, RUNX1, and TCF7L2 (Figure 5c), the PPI network showed that EP300 and CREBBP (Figure 7c) are the key proteins with the highest number of connections. On the other hand, the core regulatory network detected MYB, CHD1, KLF4, and KDM5A as hub genes (Figure 8c). All these hub genes were upregulated.
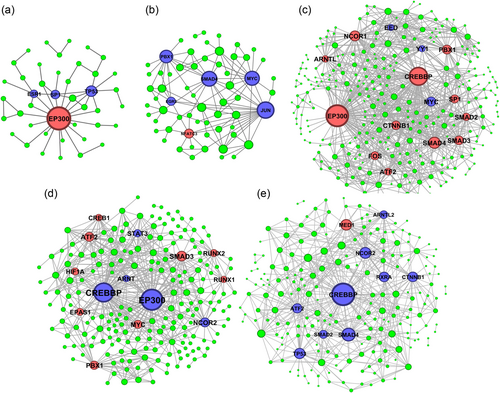
Protein–protein networks of regulatory TFs at early stages of embryonic development. The networks were constructed for the transition from (a) one- to two-cell (b), two- to four-cell, (c) four- to eight-cell, (d) eight-cell to morula, (e) morula to blastocyst transition. Blue and red color indicate up- and downregulation, respectively [Color figure can be viewed at wileyonlinelibrary.com]

The core regulatory network for the stage transition during human embryogenesis. Directed and autoregulation by different TFs at (a) one- to two-cell, (b) two- to four-cell, (c) four- to eight-cell, (d) eight-cell to morula, (e) morula to blastocyst transition are given in the networks. Red nodes are downregulated while blue nodes are upregulated in the network constructed for any given stages [Color figure can be viewed at wileyonlinelibrary.com]
Morulae formation is regulated by HNF4A, FOXP1, STAT3, and SOX2 (Figure 5d); however, similar to the previous stage, EP300 and CREBBP had the highest number of interactions with other TFs in the PPI network (Figure 7d). Furthermore, the core network for this stage highlighted the role of HNF4A as a hub in addition to ATF3, SMAD3, and ZNF217 (Figure 8d). A mixed pattern of expression at this stage was observed for these TFs; HNF4A, CREBBP, EP300, STAT3, and ZNF217 are upregulated, while ATF3, SMAD3, and FOXP1 are downregulated.
In the last stage, HNF4A, MITF, FOXP1, and FLI1 were detected as hub TFs in the DNA–protein interaction network (Figure 5e). However, only CREBBP were observed in the PPI network (Figure 7e). Once again, different sets of TFs including GATA1, TCF7L2, ELK3, SMAD2, and ATF3 are involved in the core regulatory network (Figure 8e). Among them, ATF3, GATA1, HNF4A, and FLI1 were downregulated and the rest were upregulated.
3.6 Validation of the results by two independent datasets
To validate the role of these 11 TFs during early human embryo developmental stages, we have used two more recent studies provided by Yan et al. (2013; GSE36552) and Dang et al. (2016; GSE71318). Figure 9 contains the results obtained from these three studies alongside each other. Evidently, comparable oscillation patterns and similar trends in gene expression could be observed for the key TFs during early stages of embryogenesis. These findings could confirm the specific role of these TFs.
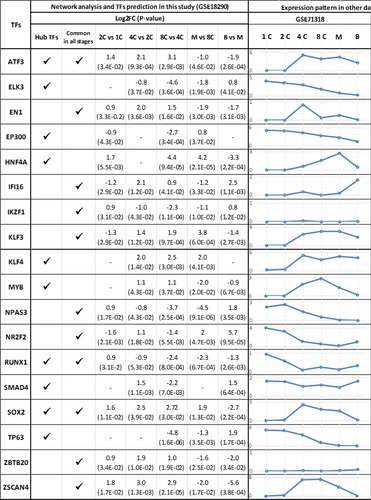
Cross validation of the expression pattern of the most important TFs including ATF3, EN1, IFI16, IKZF3, KLF3, NPAS3, NR2F2, RUNX1, SOX2, ZBTB20, and ZSCAN4 during early embryogenesis. Besides, we have also cross validated those differentially expressed TFs that were detected as a hub in at least three transitional stages. The expression pattern of these TFs in GSE36552 and GSE71318 are given in small graphs, while the log 2 of fold changes and p values are given for the TFs obtained in the current study. The status of each TFs regarding either being a hub or present at all stages have also been included. TF: transcription factor [Color figure can be viewed at wileyonlinelibrary.com]
4 DISCUSSION
4.1 DEGs and cluster analysis
Comparing the overall gene expression pattern among successive stages showed that upregulation of thousands of genes is indeed the main molecular events. In agreement with the previous reports, we have found that a major shift in the gene expression occurs at the transition from four- to eight-cell stages. It is known that in human, ZGA occurs at this stage (Braude, Bolton, & Moore, 1988; Hamatani et al., 2004; Xue, Yi, Huang, Shi, & Li, 2011). Downregulation of many genes was also documented for this stage, a possible indication for the removal of residual maternal messenger RNAs (M. T. Lee et al., 2014). Additionally, we have tracked constant gene expression for 109 genes in all stages. These are genes could be defined as housekeeping genes and are involved in the maintenance of the cellular activities including metabolism and cell division (P. Zhang et al., 2009).
4.2 Identification and dissection of the role of DE-TFs
Expression trends of TFs revealed many previously unknown dynamic changes at the TFs level, which could be a reflection of their activities. While few TFs contribute to the onset of gene expression at early stages, the transition from four- to eight-cell governed the most number of DE-TFs. This was expected because it is well established that this stage concordances with ZGA (Hamatani et al., 2004) that cumulatively results in overexpression of thousands of genes. However, the presence of 11 TFs in all stages was not reported previously. These include ATF3, EN1, IFI16, IKZF3, KLF3, NPAS3, NR2F2, RUNX1, SOX2, and ZSCAN4. It is known that many of these TFs are involved in different stages of development (Brunskill, Witte, Shreiner, & Potter, 1999; Cao et al., 2016; Cheng et al., 2017; Wilson, Kalinovsky, Orvis, & Joyner, 2011). Furthermore, direct impacts of their losses were also studied. For example, it was shown that reduction of ZSCAN4 transcript level hinders the progression beyond two-cell stages (Falco et al., 2007). However, for some of the TFs, there is no report for their involvement in early embryogenesis. These DE-TFs exhibited a mixed pattern of expression at the different stage. For example, the expression of ATF3, EN1, ZBTB20, and ZSCAN4 were high at the first three stages, while their expression downregulated upon ZGA. On the other hand, it appears that ZGA and upregulation of IKZF1, NR2F2, and NPAS3 are happening at the same stage of embryonic development. Besides, we found that downregulation of EN1, ZBTB20, KLF3, and ATF3 is required for the progression from morula stage onward.
We observed a dynamic pattern in the pathways involved at the early stages of preimplantation embryos. GO annotation of TFs indicated that at the two- and four-cell stages, mostly cell proliferation and multicellular organism related processes are involved. However, in later stages, organogenesis-related TFs could be involved that direct major shift in the signaling pathways. Unfortunately, due to lack of such detailed analysis, we could not find any direct link between our results and those previously reported. However, it appears that signaling pathways, including Wnt (Sanz-Ezquerro, Münsterberg, & Stricker, 2017) and Notch (Perrimon, Pitsouli, & Shilo, 2012) signaling are involved in the final stages of preimplantation.
Our detailed network analysis identified the main regulators of transition from one stage to the next. In this regard, we found that HNF4A, FOXA2, and EP300 are involved in the conversion of the one-cell zygote to two-cell stage. Surprisingly, both HNF4A and FOXA2 is shown to be involved in the rather later stages of embryo development (Alder et al., 2014) and if confirmed, their involvement at this stage would add new dimensions to their molecular function. On the other hand, EP300 is known to be involved in chromatin remodeling (Eckner et al., 1994; Ogryzko, Schiltz, Russanova, Howard, & Nakatani, 1996). Therefore, early expression of this gene would induce multiple epigenetic modulations and as a result would affect the expression of hundreds of genes (Guo et al., 2017). Known pluripotent TFs such as SOX2, KLF4, and JUN detected in the transitions from two-cell onward. This highlight the existence of a high portion of embryonic stem cells at these stages. Expectedly, TFs responsible for the first sets of fate decision appears rather early at 4–8-cell stages onward. For example, SMAD3 and SATA3 are known to be involved in neurogenesis (Miguez, Gil-Guinon, Pons, & Marti, 2013; K. Zhang et al., 2015). While, CLOCK is regulating the development of mesoderm and is involved in hematopoiesis (Bian et al., 2017).
Furthermore, network-based analyses have also introduced HNF4A, FOXA2, and EP300 as the hub genes for the first transitional events in early embryogenesis. Although the role of these TFs during later stages of development has been documented elsewhere, we could not find direct reports on their role at this stage. For example, FOXA2 in known to regulate the development of lung (Wan et al., 2005), liver (C. S. Lee, Friedman, Fulmer, & Kaestner, 2005), and brain (Metzakopian et al., 2012). HNF4A is also involved in liver development (Battle et al., 2006; Li, Ning, & Duncan, 2000). Guo et al. (2017) have detected the expression of EP300 along with OCT4 at the four-cell stage onwards. Detection of these genes via network analysis rather than gene expression methods highlights the ability of system biology approaches to uncover important regulatory elements. Notably, many of these regulators are either expressed at low levels or their transcripts are quickly removed. Therefore, in both cases, it would be difficult to measure the transcription levels of such genes. However, through analysis of their numerous targets, one could detect their presence. As an example, DUX4, the major regulator of ZGA, was identified through detailed gene expression clustering and bioinformatics approaches rather than direct gene expression measurement methods (De Iaco et al., 2017; Hendrickson et al., 2017; Whiddon, Langford, Wong, Zhong, & Tapscott, 2017).
5 CONCLUSION
We have studied the dynamics of TFs changes during early embryo development in human. Through clustering and network analysis we have uncovered some important aspects of the transcription regulation in the human embryos during transitions between the first few preimplantation stages. Our network analysis highlighted the role of three TFs including HNF4A, FOXA2, and EP300 in the first divisions of zygotes. In addition, we have shown the continuous presence of at least 11 TFs including ATF3, EN1, IFI16, IKZF3, KLF3, NPAS3, NR2F2, RUNX1, SOX2, ZBTB20, and ZSCAN4 during the transition from zygote to the morula stage. The results of this study would be useful to narrow down the number of important TFs at the early stages of development to a few key regulators. Besides, our study provided a list of TFs for each transition, which could be used as a primary resource for further investigations. The exact role of many of these TFs at later stages of development has been identified but determining their role at the early stages need more research.
CONFLICTS OF INTEREST
The authors declare that there are no conflicts of interest.


