The Shc protein RAI promotes an adaptive cell survival program in hypoxic neuroblastoma cells
Abstract
Neuroblastoma (NB) is a highly malignant pediatric solid tumor where a hypoxic signature correlates with unfavorable patient outcome. The hypoxia-inducible factor (HIF)-1α plays an important role in NB progression, contributing to cell proliferation and invasiveness. RAI belongs to the Shc family proteins, it is mainly neuron specific and protects against cerebral ischemia. RAI is also expressed in several NB cell lines, where it promotes cell survival. In this work, hypoxia differently affected cell survival and pro-apoptotic program in two NB cell lines, either expressing RAI (SKNBE) or not (SKNMC). RAI expression appeared to promote NB cell survival and to reduce some pro-apoptotic markers under hypoxia. Accordingly, the RAI silencing in SKNBE cells resulted in a reduction of cell survival and HIF-1α expression. Furthermore, using SKNMC cells stably expressing RAI, we defined a role of RAI in NB cell responses to hypoxia. Of interest, in hypoxic SKNMC cells expressing RAI HIF-1α protein levels were higher than in control cells. This was associated with a) an increased cell survival; b) an increased expression of anti-apoptotic markers; c) a pro-autophagic and not pro-apoptotic phenotype; and d) an increased metabolic activity. We may conclude that RAI plays an important role in hypoxic signaling in NB cells and the interplay between RAI and HIF-1α may be relevant in the protection of NB cells against hypoxia. Our results may contribute to a further understanding the physiology of NB cells and the molecular mechanisms involved in their survival, with important implications in NB progression.
1 INTRODUCTION
Hypoxia is a common feature of several malignancies (Vaupel, 1977). Tumor cells have developed adaptive mechanisms to survive under hypoxic conditions through the activation of the hypoxia-inducible factor (HIF) (Semenza, 2012). HIF heterodimer consists of an oxygen-dependent α-subunit and a constitutively expressed β-subunit (Poellinger & Johnson, 2004). There are three α-subunit isoforms and among them HIF-1α, as well as HIF-2α, have been shown to be associated with increased mortality and treatment failure in many solid tumors (Wigerup, Pahlman, & Bexell, 2016). However, despite extensive investigation, especially on HIF-1α isoform, the molecular mechanisms, underlying this correlation, are not fully clarified.
HIF-1 plays a key role in many hallmarks of the solid tumors as it modulates several cellular adaptive responses to hypoxia, including cell survival and metabolic reprogramming (Pouyssegur, Dayan, & Mazure, 2006). For example, HIF-1 regulates the expression of a target gene encoding BNIP3 (Mazure & Pouyssegur, 2009), which triggers selective autophagy, and glucose and lactate transporters, such as GLUT-1, GLUT-3 and the monocarboxylate transporter MCT-4.
Neuroblastoma (NB) is a highly malignant pediatric solid tumor where a hypoxic signature correlates with unfavorable patient outcome (Fardin, Barla, et al, 2010; Fardin, Cornero, et al, 2010). Of note, previous studies have reported that hypoxia triggers dedifferentiation of NB cells towards a more immature stem cell phenotype (Marzi et al., 2007) and is associated with NB metastasis (Jogi et al., 2002). Indeed, HIF-1α plays a role in the regulation of NB progression by N-Myc (Qing et al., 2010) and contributes to proliferation and invasiveness of NB cells via the sonic hedgehog (SHH) signaling pathway (Chen et al., 2015).
HIF-1α and HIF-2α appear to be differentially involved in vivo in NB (Noguera et al., 2009). However, while HIF-2α is upregulated only by VEGFR-1, HIF-1α levels are upregulated by ligand-induced activation of multiple receptor tyrosine kinases, including VEGFR-1, PDGFR-β, and RET (Nilsson et al., 2010).
The Shc family proteins are important in signaling pathways including the phosphoinositide-3 kinase (PI3K)/Akt pathway and thus representing important functions in cellular survival. The Shc family has three members, ShcA/Shc, ShcB/Sli/Sck, and ShcC/RAI/N-Shc encoded by different genes (Pelicci et al., 1992; Ravichandran, 2001). In particular, RAI, in contrast to the ubiquitous ShcA, is predominantly expressed in the developing and adult central nervous system (Luzi, Confalonieri, Di Fiore, & Pelicci, 2000). Shc exists in three isoforms of 46, 52, and 66 kDa, each of which with distinct and non-redundant functions (Pelicci et al., 1992). RAI is a physiological substrate of the receptor tyrosine kinase Ret and it stimulates neuronal cell survival (Pelicci et al., 2002). Of note, RAI is expressed in several NB cell lines, where it promotes, again, cell survival (Soori, Lu, & Mason, 2016). More interestingly, RAI regulates the neuronal stress response and protects against cerebral ischemia (Troglio et al., 2004).
Previous reports have demonstrated the role of tyrosine kinase phosphorylation and of the Shc/Ras cascade on hypoxic HIF-1α stabilization in endothelial cells, with particular regards to the ShcA p52 isoform (Jung et al., 2002). In addition, p66ShcA modulates tissue response to hind limb ischemia (Zaccagnini et al., 2004). More recently, we have established a cross-talk between HIF-1α and p66ShcA protein, in the pro-apoptotic and pro-angiogenic phenotypes of hypoxic T cells (Carraro et al., 2007; Naldini et al., 2010; Pacini et al., 2004). However, despite this intense investigation on ShcA and hypoxic stress in several models, information regarding the potential relationship between HIF-1α and RAI in neuronal cells is still scant. In this article we described, for the first time, the interplay between RAI and HIF-1α signaling in two specific NB cell lines, SKNMC and SKNBE cells, which were selected on the basis of the absence or the presence of RAI expression, respectively (Pelicci et al., 2002). Particularly, it was evaluated the relevance of RAI on cell survival and metabolic adaptive responses to hypoxia, with potential implications for NB cell physiology.
2 MATERIALS AND METHODS
2.1 Reagents
The following solutions and reagents were used as listed. DMEM 1000 low glucose, MEM, fetal bovine serum (FBS), penicillin/streptomycin and L-Glutamine were purchased from Euroclone, Devon, UK. TRI-Reagent® was purchased from Ambion, Austin, TX and iScript™cDNA Synthesis Kit, ITaq™SYBR Green Supermix were obtained from Bio-Rad Laboratories, Hercules, CA. All other reagents were of the highest grade available.
2.2 Cell lines
SKNMC cells, a human metastatic NB cell line isolated from the supra-orbital area, and SKNBE cells, a human metastatic NB cell line isolated from bone marrow, were cultured in DMEM 1000 medium (Euroclone, Devon, UK) with 10% FBS and MEM (Euroclone, Devon, UK) with 10% FBS, respectively and supplemented with 1% L-glutamine 2 mm, streptomycin 100 µg/ml, and penicillin 100 U/ml (Euroclone, Devon, UK), and were maintained in a humidified atmosphere at 37 °C and 5% CO2.
RAI silencing in SKNBE cells was achieved by lentiviral infection as previously described (Ortensi et al., 2012). Briefly, PLentiLox 3.7 Puro-GFP plasmid containing short hairpin RNA targeting RAI mRNA (RAI shRNA) was transfected together with packaging plasmids (vpMDLg/pRRE, pRSV-REV, and pMD2G) in human 293T cells. A shRNA directed against the firefly luciferase cloned in PLentiLox 3.7 Puro-GFP lentiviral vector was used as a control (Luc shRNA). After overnight incubation at 37 °C, the medium was replaced with fresh DMEM supplemented with 10% FBS. Forty-eight hours after transfection, lentiviral supernatant was collected, centrifuged at 900×g for 10 min at room temperature to remove cellular debris and further filtered through a 45 μm pore filter. SKNBE cells (3 × 10⁶) were transduced with the indicated undiluted lentiviral supernatants in two consecutive rounds of 6 hr, and then incubated with culture medium. Polybrene (8 μg/ml) was added to lentiviral supernatants to increase transduction efficiency. Two days following transduction, infection efficiency was assessed by GFP expression and SKNBE cells were selected with puromycine (0,5 μg/ml). Interference efficiency was evaluated 72 hr after selection by Western immunoblot analysis.
SKNMC cells stably expressing RAI (SKNMC-RAI) or control cells infected with the empty vector (SKNMC-Ctr), were obtained by infection with the RAI-GFP-PINCO retroviral expression vector or the empty vector respectively. The efficiency of infection, measured as GFP positivity, was evaluated by fluorescence-activated cell sorter (FACS) analysis, and it was consistently stable over months and >95% (Troglio et al., 2004).
2.3 Hypoxic treatment
Hypoxia treatment was performed as previously described (Filippi et al., 2014). Briefly, NB cell lines and SKNMC-RAI cells or SKNMC-Ctr cells were incubated at 37 °C in the culture media containing 10% FBS in 5% CO2 and 20% O2 (normoxia: atmospheric oxygen ∼140 mmHg) in a humidified environment (VWR International PBI, Milano, Italy). The experiments under hypoxic conditions were performed using either a workstation In Vivo 400 (Ruskinn, Pencoed, UK) or a CO2/O2/N2 incubator (Sanyo, Moriguchi, Japan) both providing a customized and stable humidified environment through electronic control of CO2 (5%), O2 (hypoxia: 2%, ∼14 mmHg) and temperature (37 °C).
2.4 Cell viability
Cell viability was determined on cells exposed to either normoxia or hypoxia for 24–48 hr, by CyQuant Kit (Molecular Probe, Eugene, OR,), according to the manufacturer's instructions and as previously described (Naldini et al., 2012). Fluorescence was measured using a microplate reader (FluorOptima, BGM LABTECH, Durham, NC).
2.5 Glucose and lactate determination
At the end of the hypoxic treatment extracellular glucose and lactate were determined in the media by a sensitive assay employing Amplex Red dye and fluorescence was measured at Ex/Em = 530/590 nm, as previously described (Zhu, Romero, & Petty, 2010). Glucose uptake and lactate production were defined by subtracting/adding the extracellular concentrations determined at the appropriate time points from/to the amounts of glucose/lactate present in the media at beginning of the experiments (time 0).
2.6 Cell lysis, SDS-PAGE, and Western blot analysis
NB cells were promptly processed to avoid culture reoxygenation, as previously described (Naldini et al., 2012). Briefly, cells were washed with ice-cold phosphate buffer saline and lysed directly in tissue culture plates with Nonidet P-40 lysis buffer (20 mm Tris–HCl pH 7.4, 137 mm NaCl, 2 mm EDTA, 0.5 mm Na3VO4, 1 mm NaF, 1% Nonidet P-40, and 10% glycerol) containing protease inhibitors (1 mm PMSF, 1 μg/ml aprotinin, 1 μg/ml leupeptin) for 30 min on ice. Lysates were clarified by centrifugation at 10,000×g for 20 min at 4 °C, and the protein concentrations were determined using BCA protein assay reagent. The lysates were resolved by SDS–PAGE (20–40 μg protein/lane). Separated proteins were transferred to PVDF filters, properly blocked and subjected to immunoblot. Membranes were incubated with a horseradish peroxidase-conjugated appropriate secondary antibody, then the antigen–antibody complexes were visualized using an Immunostar HRP kit (Bio-Rad Laboratories). No saturated immunoreactive bands were detected with a CCD camera gel documentation system (ChemiDocXRS, Bio-Rad Laboratories) and then quantified with Quantity One software (Bio-Rad Laboratories). Antibodies with the following specificities were used as listed. HIF-1α and RAI (ShcC) (BD Biosciences, San Jose, CA); PARP, LC3B, β-actin, vinculin, Akt, anti-mouse IgG HRP, and anti-rabbit IgG-HRP (Cell Signaling Technologies, Danvers, MA).
2.7 RNA extraction and RT-qPCR
Total RNA was extracted from normoxic or hypoxic NB cells using TRIReagent® following the manufacturer's instructions. cDNA was synthesized using iScript™cDNA Synthesis Kit. RT-qPCR was performed using ITaq™SYBR Green Supermix. The predeveloped and validated primers for BNIP3 (BNIP3, BCL2/adenovirus E1B 19 kDa interacting protein 3), Bcl-xl, BAX, Bcl-2, GLUT-1, GLUT-3, MCT-1, MCT-4, HIF-1α, and β-actin were purchased from Invitrogen, Paysley, UK, while CAIX was obtained from Eurofins Genomics Ebersberg, Germany. Thermocycler conditions included an initial holding at 95 °C for 3 min; this was followed by a two-step PCR program: 95 °C for 15 s and 60 °C for 20 s for 49 cycles. Data were quantitatively analyzed on an iQ™5 Optical System Software (Bio-Rad Laboratories). Relative quantification was done by using the 2−ΔΔCT method (Livak, Marmaro, & Todd, 1995). β-actin was used as housekeeping gene and results were expressed as fold increase in mRNA expression with respect to the control cells.
2.8 Statistical analysis
Data were presented as means ± SEM. The two-sided Student's t-test was used to compare the differences between hypoxic and normoxic cells and between cell lines and SKNMC-RAI or SKNMC-Ctr cells. A value of p < 0.05 was considered statistically significant.
3 RESULTS
3.1 Hypoxia differently affects cell survival and apoptosis in human neuroblastoma cell lines
In previous reports, we have shown that hypoxia affects cell death in immune and breast cancer cells through the activation of a pro-apoptotic program (Carraro et al., 2007; Naldini et al., 2009). To test whether hypoxia could promote cell death in NB, we selected two cell lines, SKNMC and SKNBE cells because of their different expression of RAI (Pelicci et al., 2002). Accordingly, RAI expression was detectable in SKNBE cells, but not in SKNMC cells, as shown in Figure 1a. Such an expression was concomitant with a higher AKT expression in SKNBE cells, when compared to SKNMC cells, confirming the pro-survival role of RAI in NB. To test whether the observed pro-survival effect was exerted also under hypoxic conditions, we exposed SKNMC and SKNBE cells to normoxia (20% O2) or hypoxia (2% O2) for 24–48 hr and thereafter we determined cell viability. As shown in Figure 1b, hypoxia significantly reduced SKNMC cell survival after 48 hr of treatment. In contrast, SKNBE cell survival was not affected by hypoxic conditions, suggesting that hypoxia may differently affects NB cell survival depending on the cell type. This hypothesis was corroborated by data regarding the expression of Bcl-2 and Bcl-xl, which act as anti-apoptotic proteins. As shown in Figures 1c and 1d, hypoxic treatment resulted in a lower expression of Bcl-2 and Bcl-xl, in SKNMC cells when compared to SKNBE cells. Such a reduction was significantly different already after 24 hr of hypoxic treatment and persisted through 48 hr.
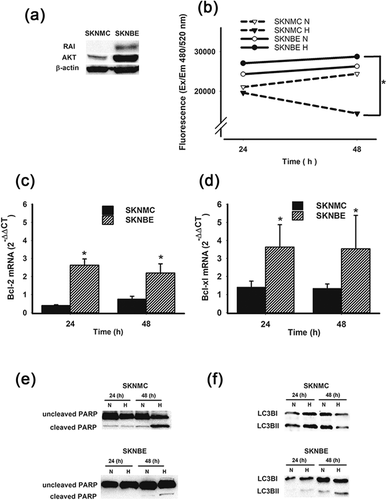
The different pro-survival behavior under hypoxia was also confirmed by PARP expression as shown in Figure 1e. Indeed, while hypoxia induced a significantly high cleavage of PARP in SKNMC cells, SKNBE cells were almost unaffected by hypoxic treatment, indicating that the latter cells were less susceptible to a hypoxic insult. Indeed, PARP cleavage is commonly associated with apoptosis or programmed cell death. Since it has been demonstrated the interdependence between apoptosis and autophagy, we next evaluated the expression of LC3B in hypoxic SKNMC cells and SKNBE cells. As shown in Figure 1f, the level of LC3BII, the cellular autophagy marker, was higher after 24 hr of hypoxic treatment in SKNMC cells and decreased after 48 hr. In contrast, in SKNBE cells the level of LC3BII was lower and significantly increased only after 48 hr of hypoxic treatment. Once again, hypoxic treatment resulted in different responses in the two NB cell lines.
3.2 HIF-1α signaling induction by hypoxia in NB cells
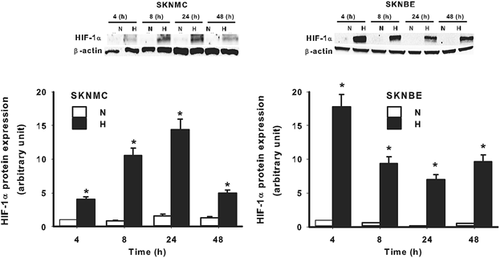
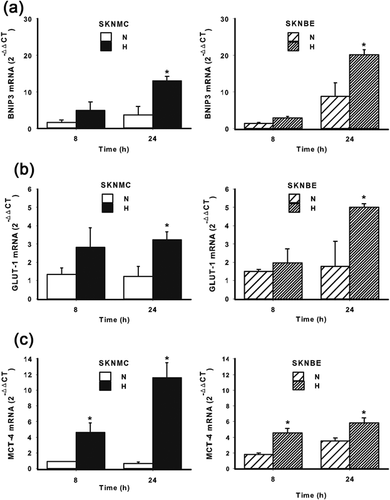
Since SKNMC and SKNBE cell survival was differently affected by hypoxia, we decided to evaluate the signaling evoked by hypoxia in both cell lines. As expected, the exposure of both cell lines to hypoxia resulted in a significant accumulation of HIF-1α, the master regulator of the cellular responses to hypoxia. However, as shown in Figure 2, such an accumulation followed a different kinetics. Indeed, in SKNMC cells, HIF-1α accumulation became detectable after 4 hr of hypoxic treatment, it increased up to 24 hr and diminished at 48 hr. In contrast, in SKNBE cells the highest HIF-1α accumulation was detectable at 4 hr of hypoxic exposure, it diminished at 8 hr, but remained constant up to 48 hr. As expected, hypoxia induced an increase of BNIP3, which is transcriptionally regulated by HIF-1α and associated with apoptosis/autophagy, in both cell lines (Figure3a), without significant differences. Hypoxic treatment resulted also in the transcription of other genes, still regulated by HIF-1α, but involved in glycolytic and lactate metabolism, such as GLUT-1 and MCT-4. As shown in Figure 3b, hypoxia induced an increase in the mRNA expression of GLUT-1, a glucose-dependent glucose transporter in both cell lines. Similarly, the expression of the lactate transporter MCT-4 was also increased by hypoxic treatment in both cell lines (Figure3c). These results suggest that both SKNMC and SKNBE cells respond to hypoxia by upregulating HIF-1α accumulation and the expression of genes transcriptionally controlled by HIF-1α. However, these cells may be differently affected by hypoxic treatment in term of signaling related to apoptosis/autophagy in order to survive better in a hypoxic environment.
3.3 RAI and NB cell survival under hypoxia
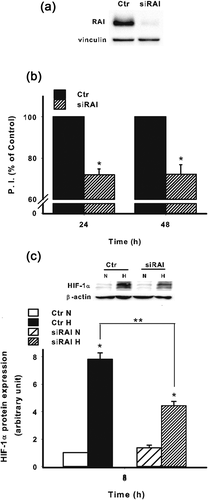
Due to the above observations, we decided to further investigate why these two cell lines responded differently to hypoxia in terms of survival. Previous reports have shown that one of the molecule involved in the survival of neuronal cells and NB is the adaptor protein RAI (Miyake, Ohira, Nakagawara, & Sakai, 2009; Troglio et al., 2004). Thus, we invalidated the expression of RAI in SKNBE cells by lentiviral-mediated silencing (Figure 4a). RAI invalidation resulted in a significant decrease of cell survival at both 24 hr and 48 hr (Figure 4b). Of interest, the invalidation of RAI in SKNBE cells resulted in a significant decrease of HIF-1α at protein level under hypoxia (Figure 4c). To better define how RAI may be involved in a different adaptive response to hypoxia, we next took advantage of SKNMC cells stably expressing RAI (SKNMC-RAI) (Figure 5a). It should be underlined that, as reported in Figure 1a with regard to SKNMC and SKNBE cell lines, RAI expression correlated with AKT.
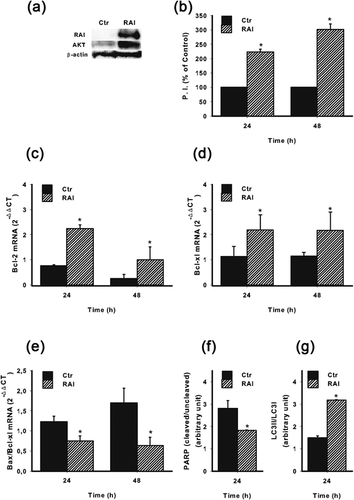
As shown in Figure 5b, cell survival under hypoxic conditions was significantly higher in SKNMC-RAI cells, when compared to the control cells infected with the empty vector (SKNMC-Ctr). Similarly, Bcl-2 (Figure 5c) and Bcl-xl (Figure 5d) expression were significantly higher in SKNMC-RAI cells than in SKNMC-Ctr cells. In contrast Bax/Bcl-xl ratio was significantly lower when RAI was expressed (Figure 5e), indicating the positive involvement of RAI in the survival of NB cells in a hypoxic microenvironment. To corroborate this hypothesis, we next analyzed the expression of PARP and LC3B. As shown in Figure 5f, PARP cleavage was reduced when RAI was expressed under hypoxic conditions, suggesting a negative effect of RAI in the pro-apoptotic process. Conversely, RAI expression enhanced the cleavage of LC3B, a molecule associated with autophagy, indicating a more prominent attitude of NB cells to survive better under hypoxia (Figure 5g).
3.4 RAI and HIF-1α signaling
Since RAI may differently affect NB cellular responses to hypoxia, we next determined the expression of HIF-1α in SKNMC-RAI and SKNMC-Ctr cells.
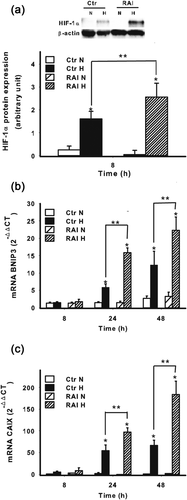
As shown in Figure 6a, the expression of RAI resulted in HIF-1α enhancement at the protein level under hypoxia when compared with the hypoxic controls. With regard to BNIP3, its mRNA expression was significantly increased by hypoxic treatment in cells expressing RAI, suggesting, again, its relevance in the adaptive response to hypoxia in term of survival and apoptosis/autophagy (Figure 6b). To confirm that the hypoxic signaling was amplified by the expression of RAI we analyzed the mRNA expression also of CAIX, which, along with BNIP3, represents a gene strictly regulated by HIF-1α at transcriptional level. As shown in Figure 6c, RAI strikingly upregulated the expression of CAIX, confirming the role of RAI in amplifying HIF-1α signaling.
3.5 RAI affects glucose and lactate metabolism under hypoxia
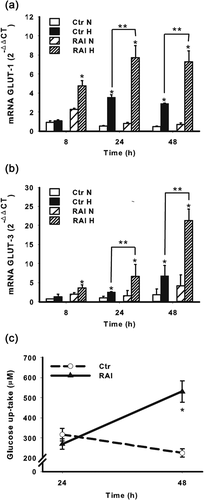
To further investigate the mechanisms by which RAI may promote NB cell survival we determined the mRNA expression of GLUT-1, whose impact on cell viability has been previously established (Semenza, 2010). As shown in Figure 7a, the RAI expression significantly increased the GLUT-1 mRNA expression suggesting its role in the promotion of glucose uptake under hypoxia. More interestingly, as shown in Figure 7b, when RAI was expressed, hypoxia significantly increased also the expression of GLUT-3, which is probably the major neuronal glucose transporter (Rajakumar, Thamotharan, Raychaudhuri, Menon, & Devaskar, 2004) and still regulated by HIF-1α (Liu et al., 2009). Accordingly, the expression of RAI enhanced glucose consumption in SKNMC cells, confirming its positive role in promoting glucose uptake to ensure cell survival (Figure 7c).
Since glucose consumption is associated with lactate production, we next evaluated the effect of RAI on MCT-4 expression under hypoxic conditions, a transporter involved in the regulation of lactate metabolism. Surprisingly, when RAI was expressed, hypoxic SKNMC cells expressed lower levels of MCT-4 (Figure 8a). To give an explanation to such an apparent discrepancy, we determined the role of RAI in the expression of MCT-1, the main lactate extruder which is not regulated exclusively by HIF-1α, in contrast to MCT-4. As shown in Figure 8b, RAI expression significantly upregulated MCT-1 expression, in both normoxic and hypoxic conditions. Interestingly, and in accordance with the results regarding MCT-4, when RAI was expressed, the extracellular concentration of lactate was apparently reduced under hypoxic conditions (Figure 8c). This may be explained by the fact that MCT-1 is not dependent directly by HIF-1α and it may ensure not only the extrusion but also the uptake of lactate. It should be underlined that when glucose concentration is reduced, such as under hypoxia, lactate may represent an alternative fuel and therefore MCT-1 is upregulated (De Saedeleer et al., 2014).
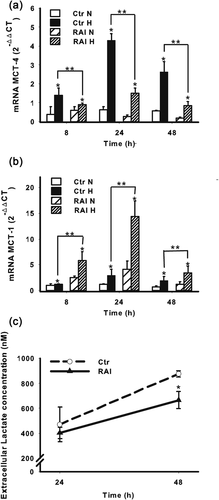
The overall results indicate that RAI may play a role in the glycolytic metabolism of NB cells, resulting in a more efficient adaptation to hypoxia to ensure cell survival.
4 DISCUSSION
In this paper we described for the first time the cross-talk between hypoxia sensitive pathways and the adaptor protein RAI in NB cells, in terms of cell survival and metabolism.
Previous reports have shown that hypoxia deeply affect NB cell physiology (Marzi et al., 2007) and that different NB cells respond differently to CoCl2, an hypoxia-mimetic agent, in terms of cell death (Stenger, Naves, Verdier, & Ratinaud, 2011). Accordingly, we here reported that SKNMC and SKNBE cell lines were differently affected by a hypoxic condition. Specifically the pO2, which was employed in our study (pO2 = 14 mmHg) mimics, at least in part, the hypoxic microenvironment physiologically present in the tissues of several solid tumors (Vaupel, 1977). Such a difference was evident with regard to cell survival and to the expression of molecules associated with apoptosis and autophagy (Adams & Cory, 2007; Gozuacik & Kimchi, 2004). Previous reports have indicated that the survival of neuroblastoma cells is positively controlled by the adaptor protein RAI (Miyake et al., 2009), which is expressed in SKNBE cells, but not in SKNMC cells (Pelicci et al., 2002). More interestingly, in this work, these two cell lines responded differently also in term of HIF-1α accumulation under hypoxia. It should be highlighted that, the expression of RAI, similarly to p66ShcA in T cells, modulated the expression of HIF-1α (Carraro et al., 2007). The underlying molecular mechanisms should be carefully investigated in future study, because it may represent an additional way to control HIF-1α expression. Thus, our results suggest that different response to hypoxia maybe due, at least in part, to RAI expression. This hypothesis raised also because in previous reports we have clearly shown that the pro-apoptotic responses induced by hypoxia in T cells are profoundly affected by another protein belonging to the Shc family, p66ShcA (Carraro et al., 2007). In addition p66ShcA has been shown to modulate the expression of HIF-1 still in T cells, with important implication in angiogenesis (Naldini et al., 2010). In the present report, also RAI, which is neuron specific, appeared to play a role in the cellular responses activated by hypoxia and HIF-1α. Indeed, the expression of RAI was associated with higher expression of anti-apoptotic molecules Bcl-2 and Bcl-xl and a decreased Bax/Bcl-xl ratio in hypoxic cells, confirming the protective role of RAI against cellular stresses, such as hypoxia. Since hypoxia is a common feature in NB, this may justify, at least in part, the more aggressive phenotype (and the poorer prognosis) associated with the expression of RAI (Miyake et al., 2009). Moreover, in our manuscript RAI expression resulted in an amplified adaptive responses exerted by HIF-1α, including BNIP3 expression. It has been extensively reported that BNIP3 triggers selective mitochondrial autophagy (Bellot et al., 2009). Of note, interdependence between autophagy and apoptosis seems to depend on cell type, the kind of stimulus (strength and duration) as well as on the cellular environment. However, it has been clearly demonstrated that autophagy represents a basic mechanism to maintain cellular homeostasis and constitutes a survival strategy (Gozuacik & Kimchi, 2004; Lum et al., 2005). In the present manuscript, it was clear that RAI expression affected PARP cleavage, since in hypoxic SKNBE cells the cleaved PARP was almost undetectable. This was in agreement with previous reports showing, in SKNBE cells, the almost absence of PARP cleavage following a pro-apoptotic stimulus (Stenger et al., 2011). Indeed, PARP is a widely accepted pro-apoptotic marker in NB (Daniel et al., 2009) and, accordingly, in the present manuscript PARP cleavage was upregulated in hypoxic SKNMC cells (negative for RAI). In contrast, LC3B is a molecule commonly associated with autophagy (Aveic et al., 2016) that needs to be counteract to increase the cytotoxicity of several antineoplastic agents, also in NB. Accordingly, in the present manuscript LC3B was regulated by hypoxia only in SKNBE cells, while in SKNMC cells the modulation by hypoxia was not relevant. Thus, the expression of RAI suggested a more prominent autophagic than apoptotic phenotype, indicating, again, its role in protecting neuroblastoma cells from hypoxic stress. However, we cannot rule out that, in addition to RAI, other mechanisms may be involved. For example, SKNBE cells express a mutated form of p53 (Stenger et al., 2011) and p53 may contribute to the effects of hypoxia on apoptosis and autophagy in SKNMC cells stably expressing RAI (SKNMC-RAI) or control cells infected with the empty vector (SKNMC-Ctr), where p53 is normally expressed. However, the overall results indicate a protective role played by RAI against hypoxic stress. Such a protective role was also confirmed by the fact the expression of RAI was associated with higher expression of the glucose transporter GLUT-1, and therefore higher glucose consumption. GLUT-1, as BNIP3, is transcriptionally regulated by HIF-1α and its expression is increased under hypoxic conditions (Robey et al., 2008). In our manuscript, such an increase was associated with the increase of GLUT-3 another glucose transporter, still regulated by HIF-1α, but mainly associated with neuronal cells (Liu et al., 2009). These results were in agreement with previous reports showing the role of HIF-1α, along with GLUT-3, in the neuroprotection induced by N-acetylcysteine in ischemic stroke (Zhang, Yan, Taheri, Liu, & Shi, 2014). Indeed, hypoxic cells, either normal or neoplastic, depend on glucose and glycolysis to produce energy (Brahimi-Horn, Chiche, & Pouyssegur, 2007) and it has been extensively shown that downregulation of glucose transporter, such as GLUT-1 and GLUT-3, results in cell death (Agostini et al., 2016; Matsumoto, Jimi, Migita, Takamatsu, & Hara, 2016; Rajakumar et al., 2004). In addition to glucose transporters, hypoxia modulates also monocarboxylate transporters (MCT-1 and MCT-4) expression and lactate release, in order to avoid intracellular acidification and subsequent cell death (Dhup, Dadhich, Porporato, & Sonveaux, 2012). Accordingly to previous reports, in the present manuscript hypoxic treatment resulted in the upregulation of MCT-4 (de Heredia, Wood, & Trayhurn, 2010), being significant in both SKNMC and SKNBE cells. However, in SKNMC-RAI and SKNMC-Ctr cells under hypoxic conditions, the expression of RAI appeared to negatively affect MCT-4 expression, and lactate production seemed to decrease, in contrast with the glucose consumption results. Of interest, and in contrast with MCT-4 and lactate production, the expression of RAI increased MCT-1 expression under hypoxic conditions. These discrepancies may have several explanations. First of all, MCT-1 may ensure not only the extrusion but also the uptake of lactate (Halestrap, 2013). Thus, when extracellular glucose concentration is reduced, such as under hypoxia, lactate may represent an alternative fuel and therefore while MCT-4 is downregulated, MCT-1 is induced (Sonveaux et al., 2008). Indeed, MCT-1 expression is not strictly controlled by HIF-1α (Ullah, Davies, & Halestrap, 2006) and its increased is observed when extracellular glucose concentration is reduced (De Saedeleer et al., 2014). For these reasons, it has been recently proposed that MCT inhibitors may have broad application in cancer treatment (Sonveaux et al., 2008, 2012). Another element associated with a poor prognosis in cancer is the enzyme CAIX, still transcriptionally regulated by HIF-1α. We here reported that the expression of RAI appeared to increase the expression of CAIX under hypoxia and this could be particularly relevant, since the expression of CAIX, as downstream of HIF-1α, has been associated with resistance to etoposide and vincristine in NB cells (Hussein, Estlin, Dive, & Makin, 2006). The increased expression of CAIX activity may contribute to control an excessive intracellular pH, which may lead to cell death. In addition, acidification of the extracellular compartment is a peculiarity in the tumor microenvironment and it may contribute to tumor cell survival (Chiche et al., 2009). Once again, and in accordance with previous reports, the expression of RAI may protect NB cells from cell death (Miyake et al., 2009).
The overall results indicate that, beside the fact that different NB cells differently adapt to hypoxia, the crosstalk between RAI and HIF-1α may be one of the molecular mechanisms involved in the progression of NB. In addition, all this may contribute to the development and refinement of new therapeutic strategies targeting hypoxia/HIF-1α signaling in NB.
ACKNOWLEDGMENTS
The authors thank Cosima T. Baldari and Cristina Ulivieri for productive discussions and Federico Galvagni for the generous gift of SKNBE cell line. This work has received financial support from the Istituto Toscano Tumori and MIUR.
CONFLICTS OF INTEREST
The authors declare that there is no conflicts of interest regarding the publication of this paper.


