Annexin A1, Annexin A2, and Dyrk 1B are upregulated during GAS1-induced cell cycle arrest
Abstract
GAS1 is a pleiotropic protein that has been investigated because of its ability to induce cell proliferation, cell arrest, and apoptosis, depending on the cellular or the physiological context in which it is expressed. At this point, we have information about the molecular mechanisms by which GAS1 induces proliferation and apoptosis; but very few studies have been focused on elucidating the mechanisms by which GAS1 induces cell arrest. With the aim of expanding our knowledge on this subject, we first focused our research on finding proteins that were preferentially expressed in cells arrested by serum deprivation. By using a proteomics approach and mass spectrometry analysis, we identified 17 proteins in the 2-DE protein profile of serum deprived NIH3T3 cells. Among them, Annexin A1 (Anxa1), Annexin A2 (Anxa2), dual specificity tyrosine-phosphorylation-regulated kinase 1B (Dyrk1B), and Eukaryotic translation initiation factor 3, F (eIf3f) were upregulated at transcriptional the level in proliferative NIH3T3 cells. Moreover, we demonstrated that Anxa1, Anxa2, and Dyrk1b are upregulated at both the transcriptional and translational levels by the overexpression of GAS1. Thus, our results suggest that the upregulation of Anxa1, Anxa2, and Dyrk1b could be related to the ability of GAS1 to induce cell arrest and maintain cell viability. Finally, we provided further evidence showing that GAS1 through Dyrk 1B leads not only to the arrest of NIH3T3 cells but also maintains cell viability.
1 INTRODUCTION
Growth Arrest Specific 1 (Gas1) is a 37 kDa protein preferentially expressed during cell cycle arrest and which expression is triggered by serum deprivation in NIH3T3 cells (Manfioletti, Ruaro, Del Sal, Philipson, & Schneider, 1990; Schneider, King, & Philipson, 1988). It is known that GAS1 is a pleiotropic protein implicated in several cellular and biological processes (Segovia & Zarco, 2014). Several studies have shown that the overexpression of Gas1 not only induces cell cycle arrest (Del Sal, Ruaro, Philipson, & Schneider, 1992; Evdokiou & Cowled, 1998a; Ruaro, Stebel, Vatta, Marzinotto, & Schneider, 2000; Stebel et al., 2000; Zamorano, Lamas, Vergara, Naranjo, & Segovia, 2003) but also drives cells to apoptosis (Benitez, Arregui, Vergara, & Segovia, 2007; Dominguez-Monzon, Benitez, Vergara, Lorenzana, & Segovia, 2009; Mellstrom et al., 2002; Zarco, Gonzalez-Ramirez, Gonzalez, & Segovia, 2012). Additionally, GAS1 is capable of suppressing metastasis (Gobeil, Zhu, Doillon, & Green, 2008) and tumor growth (Evdokiou & Cowled, 1998b). In particular, it has been described the capacity of GAS1 to inhibit the growth of gliomas by inducing cell arrest and apoptosis (Dominguez-Monzon et al., 2009; Lopez-Ornelas, Mejia-Castillo, Vergara, & Segovia, 2011; López-Ornelas, Vergara, & Segovia, 2014; Zamorano, Mellstrom, Vergara, Naranjo, & Segovia, 2004). Moreover, we have recently reported the ability of GAS1 to inhibit tumor growth and angiogenesis in a breast cancer model by blocking the ARTN/ERK1/2 signaling in a RET-independent way (Jimenez et al., 2014).
Previous studies have shown that Gas1 is expressed in brain, heart, kidney, limb, lung, and gonad of mouse embryo. In these studies, it was demonstrated that Gas1 is able to inhibit cell growth at early stages of development; and, in the interdigital regions of the fetus, Gas1 was capable of inducing cell death (Lee, May, & Fan, 2001). In contrast, it has been reported that Gas1 may also act as a positive regulator of cell proliferation in mouse cerebellum during development (Liu et al., 2001); and also is expressed in different types of progenitor cells (Izzi et al., 2011; Kann et al., 2015), demonstrating the significant role of Gas1 in embryonic development (Lee et al., 2001; Lee & Fan, 2001; Martinelli & Fan, 2007). In fact, we have demonstrated that Gas1 is present in progenitor cells during the development of the dentate gyrus and the cortex (Estudillo, Zavala, Perez-Sanchez, Ayala-Sarmiento, & Segovia, 2016) and also in neurons and astroglial cells of adult mouse brain (Zarco et al., 2013). Finally, these results indicate that Gas1 may act either as a regulator of cell proliferation or as an inducer of cell death in a finely controlled spatio-temporal manner.
Other studies have been performed to elucidate the molecular mechanisms associated to the activation of cell proliferation and apoptosis mediated by Gas1. It has been demonstrated that Gas1 interacts with Sonic hedgehog (Shh) activating proliferation and survival pathways by releasing Smoothened (Smo) from the repression of Patched1 (Ptch1) (Allen et al., 2011; Allen, Tenzen, & McMahon,2007; Izzi et al., 2011; Martinelli & Fan, 2009; Pineda-Alvarez et al., 2012). Regarding the induction of apoptosis by GAS1, it can be explained by the structural homology between GAS1 and the glial-cell-derived neurotrophic factor (GDNF) family receptors (GFRα) (Cabrera et al., 2006; Schueler-Furman, Glick, Segovia, & Linial, 2006). When GFRαs are activated by their corresponding ligand (GDNF, artemin, neurturin, and persephin), the result is the autophosphorylation of RET and the activation of AKT, a survival and proliferation pathway. However, we showed that in the presence of GAS1, the GDNF-GFRα signaling pathway is disrupted, and a decrease of RET, AKT, and BAD phosphorylation is observed. All this leads to the release of Cytochrome-c from the mitochondria to the cytosol, the activation of Caspase-9 and Caspase-3, and finally cell death (Domínguez-Monzón, González-Ramírez, & Segovia, 2011; Lopez-Ramirez, Dominguez-Monzon, Vergara, & Segovia, 2008; Zarco et al., 2012). These data demonstrate that GAS1 disrupts the GDNF-mediated signal transduction pathway.
Currently, some mechanisms by which GAS1 induces apoptosis or activation of cell proliferation and survival pathways are known. However, the precise mechanism by which Gas1 regulates cell cycle arrest and, whether other proteins are involved in this process remains poorly understood. In this work, we show that Annexin 1, Annexin 2, and Dyrk1B are specifically regulated during Gas1-induced cell arrest and that these proteins appear to be related to the observed dual role of GAS1: cell arrest and cell protection by increasing cell survival.
2 MATERIALS AND METHODS
2.1 Cell culture
NIH3T3 cells (ATCC) were grown at 37 °C in 95% air, 5% CO2 in Dulbeccós modified Eaglés Medium High Glucose (GIBCO, Grand Island, NY), supplemented with glutamine 2 mM (SIGMA, St. Louis, MO), 100 U/ml penicillin (Life Technologies, Carlsbad, CA), 100 μg/ml streptomycin (Life Technologies), and 10% of fetal bovine serum (FBS) (Life Technologies). Cells were seeded (3 × 10⁵ cells/55cm2 plate) and after 48 hr culture, medium was replaced by fresh medium with 10% FBS for the proliferative condition (Pro/NIH3T3) or fresh medium without FBS for the serum deprivation condition (SD/NIH3T3). Cell cultures were maintained in these conditions for 24 hr; and then, harvested for protein extraction. Cell viability was evaluated by the trypan blue exclusion method.
2.2 Protein extraction and quantification
Protein extraction from Pro/NIH3T3 and SD/NIH3T3 cells was carried out by washing the cells twice with phosphate buffer solution (PBS) pH, 6.8; cells were collected using the 2D-protein extraction buffer VI (GE Healthcare, St. Louis, MO) containing urea, thiourea, NDSB 201, CHAPS, and Complete™ protease inhibitors cocktail (Roche, Mannhein, Germany). Protein quantification was performed using the 2D Quant Kit (GE Healthcare) following the manufacturers protocol.
2.3 Two-dimensional electrophoresis (2-DE)
For two-dimensional analysis, one milligram of protein sample (Pro/NIH3T3 and SD/NIH3T3) was cleaned using the 2D-Clean Up Kit (GE Healthcare) following manufacturers instructions. Protein pellets were resuspended with 125 μl of Ready-Prep Rehydration buffer (BIO-RAD, Hercules, CA) containing 8M urea, 2% CHAPS, 50 mM DTT, 0.2% (w/v) Bio-Lyte 3–10 ampholytes, bromophenol blue traces, and supplemented with a protease inhibitors cocktail. Then, samples were loaded onto 7 cm IPG strips (BIO-RAD) pH 3–10 (linear gradient) and maintained for 16 hr at 25 °C for rehydration. After, isoelectric focusing was performed at 500 V (hold) for 1 hr, 1,000 V (gradient) for 1 hr, 5,000 V (gradient) for 1.5 hr and 7,000 V (gradient) for 0.5 hr, using the Ettan IPGPhor 3 (GE Healthcare). Afterwards, strips were treated for 15 min at room temperature in equilibration buffer containing 75 mM Tris-HCl pH 8.8, 6 M urea, 30% glycerol (v/v), 2% SDS (w/v), 0.002% bromophenol blue, and 64 mM DTT. Then, strips were incubated for 15 min in the same solution containing 135 mM iodoacetamide instead of DTT. After reduction/alkylation procedure, IPG strips were loaded onto the 12% SDS-PAGE and electrophoresed at 100 V for 1.5 hr. Gels were stained with Coomassie Blue. Images were recorded using the Imager Scanner instrument (Amersham Biosciences, Piscataway, NJ). Experiments were run in triplicate to obtain the technical and biological replicates.
Images were analyzed using the PDQuest software (BIO-RAD) to detect spots with differential expression level. To do this, the relative density (pixels per area) for each spot was recorded, corresponding spots compared between conditions and significance in the differences determined by Student́s t-test, considering p-values < 0.05 as statistically significant. Seven spots with changes of two-fold or higher were excised from the two-dimensional gels and analyzed by ESI-LC-MS/MS.
2.4 Electrospray ionization tandem mass spectrometry analysis (ESI-LC-MS/MS)
Analysis and identification of proteins by tandem mass analysis was performed as previously described (Flores, López-Merino, Mendoza-Hernandez, & Guarneros, 2012). Briefly, selected protein spots were excised from Coomassie stained two-dimensional gels, processed for Coomassie removal, reduced/alkylated and digested; resulting peptides were extracted, desalted, vaccum-dried, and resuspended in 20 μl of 0.1% formic acid. Peptides were identified using a 3200 QTRAP LC-MS/MS System (Applied Biosystems/MDS Sciex, San Francisco, CA) equipped with a nanoelectrospray ion source (NanoSpray II) and a MicroIonSpray II head, and coupled to a nanoAcquity Ultra Performance LC system (Waters Corporations, Milford, MA). Peptides were processed and analyzed in the Analytical Unit, Facultad de Medicina, UNAM, as previously described (Meneses, Mendoza-Hernández, & Encarnación, 2010).
2.5 Protein identification
Database searching and protein identification were performed with the MS/MS spectra data sets using Mascot version 1.6b9 (Matrix Science: available at http://www.matrixscience.com) against the Swiss-Prot and NCBInr databases for Mus musculus plus contaminant protein databases. One missed cleavage with mass tolerances of ±1.2 Da for the precursor and ±0.6 Da for the fragment ion masses were used. Search parameters were adjusted for carbamidomethylation at cysteine as a fixed modification; and, deamidation and oxidation as variable modifications at glutamine/asparagine and methionine, respectively. Monoisotopic mass values and unrestricted values for mass protein were considered. For protein identification, hits with at least two MS/MS matched spectra with 95% of confidence (p < 0.05) were considered. Threshold ion score of ≥41 indicates identity (p < 0.05), and threshold ion score lower than 41 but greater than 30 indicates homology. Additionally, matched peptide sequences were analyzed using the MS-BLAST software (Washington University, Saint Louis, MO; Available at: http://genetics.bwh.harvard.edu/msblast/) against the Swiss-Prot and NCBInr databases to confirm the peptide matches.
2.6 RNA extraction
Pro/NIH3T3 and SD/NIH3T3 cells were washed twice in cold PBS pH, 6.8. Then, total RNA was extracted using TRIzol reagent (Invitrogen, Carlsbad, CA) following the manufacturers instructions. RNA concentration was measured at 260 nm using the Epoch nanodrop system spectrometer (BioTek Instruments, Winooski, VT). RNA quality was verified by electrophoresis in agarose gels and by 260/280 nm coefficient. Total RNA (1 μg) was treated with DNAse I (New England BioLabs, Ipswich, MA) before the cDNA synthesis.
2.7 Quantitative PCR (RT-qPCR)
cDNA was synthesized starting with 1 μg of total RNA, which was transcribed using oligo (dT) primers, and 1 μl (200 U) of MMLV reverse transcriptase (Invitrogen). The reaction was performed at 42 °C for 1 hr and stopped by heating at 70 °C for 20 min. RT-qPCR reactions were performed using 50 ng of cDNA as template, 200 nM of primers and 2X SYBR Green Master Mix (Kappa Biosystems, Wilmington, MA) in a final reaction volume of 20 μl. The running program was performed with an initial activation step of 95 °C for 10 min followed by 40 cycles of 95 °C/15 s and 60 °C/30 s Finally, a melting curve step was performed with a temperature ramp from 55 °C to 95 °C for 1 min to verify the specificity of the PCR products. In the case of β-actin, an additional step of alignment at 50 °C/15 s was included before the extension step. β-actin was used as reference gene for all RT-qPCR experiments. The fold change for each gene assay was calculated using the 2−ΔΔCQ method. Primers used were: β-actin (Forward: 5′-TGG CAC CAC ACC TTC TAC A-3′/Reverse: 5′-TCA CGC ACG ATT TCC C-3′); Anxa1 (Forward: 5′-AGG GTG ACA TTG AGA AGT GC-3′/Reverse: 5′-GAA CGG GAG ACC ATA ATC CTG-3′); Anxa2 (Forward: 5′-GTC TAC TGT CCA CGA AAT CCT G-3′/Reverse: 5′-ACT CCT TTG GTC TTG ACT GC-3′); eIf3f (Forward: 5′-GGC TAC ACC CCG TCA TTT TG-3′/Reverse: 5′-TTC TAC CGA GTG CTT GTC AAC-3′); Ncl (Forward: 5′-AGA TAA GGT CCG TGT TTG TGG-3′/Reverse: 5′-TCC AAA ATG TAG TCA GGG TAG C-3′); Igf-1 (Forward: 5′-GAG ACT GGA GAT GTA CTG TGC-3′/Reverse: 5′-CTC CTT TGC AGC TTC GTT TTC-3′); and Dyrk1b (Forward: 5′-TGG TCC TTT CTC TGG CTT TC-3′/Reverse: 5′-TGA TGT GCT TGT AGG TCT TGATG-3′). All assays were made in triplicate using the Eco Real-Time PCR System and Eco™ software for data analysis (Illumina, Inc., San Diego, CA). System suitability for each PCR assay was determined based on the following criteria: R2 ≥ 0.99; PCR efficiency 90–110%.
2.8 NIH3T3 clones with inducible expression of GAS1
To obtain NIH3T3 clones with stable transfection and inducible expression of GAS1 (NIH3T3-iGAS1), we used the viral constructions previously described (Jimenez et al., 2014). Viral constructions and clones generation were performed using the ViraPower HiPerform Gateway Expression T-Rex System (Invitrogen). With this system, we induced the expression of GAS1 by adding tetracycline (2 μg/ml) to the cell culture in the presence of 10% serum for 48 hr.
2.9 Proliferation assays with NIH3T3-iGAS1 clones
To measure the effect of the overexpression of GAS1 upon proliferation, NIH3T3-iGAS1 clones were plated (50,000 cells/55cm2 plate) and maintained with complete culture medium (10% FBS) for 48 hr at 37 °C. Then, cells were synchronized by replacing the complete medium with fresh medium supplemented with 1% FBS, and cultures were maintained in this condition for 24 hr. Finally, to restart the cell proliferation, the 1% FBS medium was replaced by complete medium (10% FBS) with or without tetracycline (2 μg/ml) and incubated for 48 hr. The NIH3T3-iGAS1 clones were harvested and counted by trypan blue exclusion method. Other control using serum deprivation-NIH3T3 wild type cells was performed.
2.10 Western blot
Western blot analyses were performed loading 50 μg of total protein in 12% SDS-PAGE. Then, resolved proteins were transferred onto 0.22 μm nitrocellulose membrane (BIO-RAD) for 1 hr at 20 V in a semi-dry transfer cell (BIO-RAD). Membranes were blocked with 5% blocking reagent (BIO-RAD) in phosphate buffer solution (PBS pH, 7.4) at room temperature for 2 hr. After blocking, each membrane was incubated overnight (2–8 °C) with the matching primary antibody and, after washing, for another 2 hr with its corresponding peroxidase-conjugated secondary antibody (1:5,000) at room temperature. Membranes were washed four times with PBS 1X (10 min each) before and after antibody incubations. The primary antibodies used for these experiments were goat polyclonal anti-Dyrk1B (1:1,000; Santa Cruz Biotechnology; Cat.Sc-98507, Santa Cruz, CA), goat polyclonal anti-mouse Gas1 (mGas1) (1:1,000; R&D Systems; Cat.AF2644, Minneapolis, MN), rabbit polyclonal anti-human GAS1 (hGAS1) (1:1,000; ProScience, Poway, CA), (Jimenez et al., 2014), rabbit polyclonal anti-Annexin II (1:1,000; Santa Cruz Biotechnology; Cat. Sc-9061), goat polyclonal anti-nucleolin (1:5,000; Santa Cruz Biotechnology; Cat. Sc-9893), and mouse polyclonal anti-β-actin (1:5,000) was used as an internal control (Garcia-Tovar et al., 2001). Afterwards, membranes were revealed with ECL Plus (GE Healthcare) and images were acquired using a UVP transilluminator system (Ultra-Violet Products Ltd, Upland, CA). Image analysis was performed using the Image J software (NIH) for band density quantification. All experiments were done in triplicate.
2.11 Functional validation with NIH3T3-iGAS1 clones
Functional validation experiments were performed with NIH3T3-iGAS1 clones. NIH3T3-iGAS1 clones were cultured (50% of confluence in 9 cm2 plates) as previously described in the proliferation assays. All experiments were performed in presence of FBS 10%, tetracycline (2 μg/ml) as inductor of GAS1 overexpression, and in presence (230 nM) or absence of INDY (Sigma, Cat. SML1011), a Dyrk 1B inhibitor. Cell cultures were maintained for 48 hr in the conditions described above. Forty-eight hours after the administration of the Dyrk 1B inhibitor cells were harvested and counted by the trypan blue exclusion method to evaluate proliferation and cell viability.
3 RESULTS
3.1 Differential protein spots between Pro/NIH3T3 and SD/NIH3T3
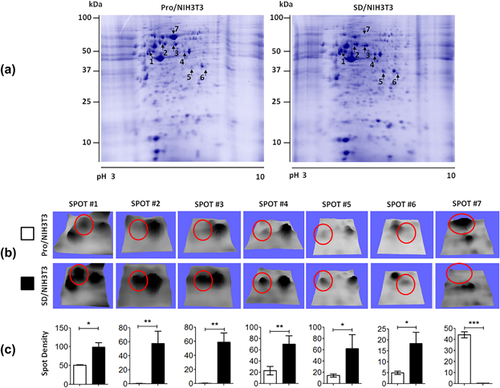
To investigate the effect of cell arrest on protein profiles, the Pro/NIH3T3 (proliferative condition) and SD/NIH3T3 (serum deprived) cells were analyzed by two-dimensional gel and compared. Representative protein profiles are shown in Figure 1a. Several protein spots showed differential abundance, mainly between 75 and 35 kDa and pI 5.0–7.2. Spots 1–6 were more abundant in SD/NIH3T3 whereas spot seven was more abundant in Pro/NIH3T3 (Figure 1b). The relative abundance of these protein spots, which showed at least two-fold significant differences was measured (Figure 1c), and then were excised for identification by tandem mass spectrometry.
3.2 Identification of 18 proteins from differential spots by ESI-MS/MS
A total of 17 proteins were identified from six spots in SD/NIH3T3 by ESI-MS/MS, which are chaperonin containing TCP-1 theta subunit, T complex protein 1, insulin-like growth factor 1 (Igf1), dual specificity tyrosine-phosphorylation-regulated kinase 1B (Dyrk1B), Hspd1 heat shock protein 60 kDa, Leucine rich repeat containing 32 precursor, phospholipase C-alpha/protein disulfide isomerase associated 3, vimentin, eukaryotic translation initiation factor 3 F (eIf3f), heterogeneous nuclear ribonucleoprotein F, beta-Actin, gamma-actin, Psmd11 protein, nucleolin (Ncl), annexin A1 (Anxa1), annexin A2 (Anxa2), and dynamin-related Protein 1. Only one protein, albumin, was identified from spot seven in Pro/NIH3T3. All 18 proteins and matched peptides are described in Table 1. In some spots, more than two proteins were identified. For further validation experiments, we selected six proteins based on their relationship with cell cycle arrest: Anxa1, Anxa2, Dyrk1B, Ncl, Igf1, and eIf3f. Despite that β-actin was one of the proteins identified by ESI-LC-MS/MS, its levels of mRNA and protein were validated by both RT-qPCR and Western blot before using it as a normalizer (see Supplementary Figure S1).
| Protein (spot) | GI number (NCBI) | MW*/pI* | Matched peptides | Protein coverage (%) | MS/MS peptide sequences | MS-BLAST score | Mascot score |
|---|---|---|---|---|---|---|---|
| Chaperonin containing TCP-1 theta subunit (1) | gi|5295992 | 54/5.1 | 4 | 8 | AVDDGVNTFK | 333 (+) | 44 |
| DVDEVSSLLR | |||||||
| FAEAFEAIPR | |||||||
| LFVTNDAATILR | |||||||
| T complex protein 1 (Tcp-1) (1) | gi|228954 | 60/5.8 | 2 | 4 | SSFGPVGLDK | 134 (+) | 61 |
| YPVNSVNILK | |||||||
| Insulin-like growth factor 1 (Igf1) (1) | gi|148689512 | 18/6.1 | 1 | 5 | SPSLSTNK | 53 (+) | 42 |
| Dual specificity tyrosine-phosphorylation-regulated kinase 1B (Dyrk1B) (1) | gi|6753698 | 65/9.1 | 1 | 2 | LPGGGWTLR | 64 (+) | 37 |
| Hspd1 heat shock protein 60 kDa (1) | gi|76779273 | 60/8.0 | 22 | 69 | GVITVK | 2343 (+) | 496 |
| IGIEIIKRLSDGVAVLK | |||||||
| VGLQVVAVK | |||||||
| IGIEIIKR | |||||||
| NAGVEGSLIVEK | |||||||
| DIGNIISDAMKK | |||||||
| TVIIEQSWGSPK | |||||||
| GYISPYFINTSK | |||||||
| TLNDELEIIEGMK | |||||||
| GVMLAVDAVIAELKK | |||||||
| CEFQDAYVLLSEK | |||||||
| VGEVIVTKDDAMLLK | |||||||
| AAVEEGIVLGGGCALLR | |||||||
| CIPALDSLKPANEDQK | |||||||
| ISSVQSIVPALEIANAHR | |||||||
| TLNDELEIIEGMKFDR | |||||||
| KISSVQSIVPALEIANAHR | |||||||
| ALMLQGVDLLADAVAVTMGPK | |||||||
| KPLVIIAEDVDGEALSTLVLNR | |||||||
| QSKPVTTPEEIAQVATISANGDK | |||||||
| ILQSSSEVGYDAMLGDFVNMVEK | |||||||
| LVQDVANNTNEEAGDGTTTATVLAR | |||||||
| Leucine rich repeat containing 32 precursor (1) | gi|164607126 | 72/5.6 | 2 | 5 | LLGETPR | 183(+) | 43 |
| LYLQGNPLSCCGNGWLAAQLHQGR | |||||||
| Phospholipase C-alpha/Protein disulfide isomerase associated 3 (1) | gi|200397 | 54/5.6 | 3 | 6 | QAGPASVPLR | 236 (+) | 44 |
| TADGIVSHLK | |||||||
| LAPEYEAAATR | |||||||
| Vimentin (2) | gi|2078001 | 53/5.0 | 22 | 62 | FANYIDK | 1732 (+) | 347 |
| DNLAEDIMR | |||||||
| FADLSEAANR | |||||||
| VELQELNDR | |||||||
| EYQDLLNVK | |||||||
| ILLAELEQLK | |||||||
| LGDLYEEEMR | |||||||
| EEAESTLQSFR | |||||||
| NLQEAEEWYK | |||||||
| MALDIEIATYR | |||||||
| QVQSLTCEVDALK | |||||||
| KVESLQEEIAFLK | |||||||
| ILLAELEQLKGQGK | |||||||
| ISLPLPTFSSLNLR | |||||||
| TNEKVELQELNDR | |||||||
| ETNLESLPLVDTHSKR | |||||||
| ETNLESLPLVDTHSK | |||||||
| VEVERDNLAEDIMR | |||||||
| LQDEIQNMKEEMAR | |||||||
| DGQVINETSQHHDDLE | |||||||
| EMEENFALEAANYQDTIGR | |||||||
| LQEEMLQREEAESTLQSFR | |||||||
| Eukaryotic translation initiation factor 3, F (eIf3f) (3) | gi|47682703 | 37/5.2 | 4 | 12 | YAYYDTER | 364 (+) | 61 |
| FLMSLVNQVPK | |||||||
| TMGVMFTPLTVK | |||||||
| LHPVILASIVDSYER | |||||||
| Heterogeneous nuclear ribonucleoprotein F (3) | gi|19527048 | 45/5.3 | 7 | 19 | YIEVFK | 603 (+) | 109 |
| GLPFGCTK | |||||||
| TEMDWVLK | |||||||
| VHIEIGPDGR | |||||||
| DLSYCLSGMYDHR | |||||||
| ITGEAFVQFASQELAEK | |||||||
| ATENDIYNFFSPLNPVR | |||||||
| Beta-actin (3) | gi|49868 | 42/5.2 | 12 | 44 | RGILTLK | 1109 (+) | 279 |
| AVFPSIVGR | |||||||
| DLTDYLMK | |||||||
| GYSFTTTAER | |||||||
| EITALAPSTMK | |||||||
| QEYDESGPSIVHR | |||||||
| IWHHTFYNELR | |||||||
| QEYDESGPSIVHR | |||||||
| SYELPDGQVITIGNER | |||||||
| VAPEEHPVLLTEAPLNPK | |||||||
| YPIEHGIVTNWDDMEK | |||||||
| DLYANTVLSGGTTMYPGIADR | |||||||
| Gamma-actin (3) | gi|809561 | 42/5.3 | 12 | 42 | RGILTLK | 1103 (+) | 278 |
| DLTDYLMK | |||||||
| GYSFTTTAER | |||||||
| EITALAPSTMK | |||||||
| AVFPSIVGRPR | |||||||
| QEYDESGPSIVHR | |||||||
| IWHHTFYNELR | |||||||
| QEYDESGPSIVHR | |||||||
| SYELPDGQVITIGNER | |||||||
| VAPEEHPVLLTEAPLNPK | |||||||
| YPIEHGIVTNWDDMEK | |||||||
| DLYANTVLSGGTTMYPGIADR | |||||||
| Psmd11 protein (4) | gi|33585718 | 46/6.0 | 1 | 3 | TGQAAELGGLLK | 75 (+) | 41 |
| Nucleolin (5) | gi|13529464 | 110/4.6 | 8 | 12 | GIAYIEFK | 704 (+) | 157 |
| VTLDWAKPK | |||||||
| ETLEEVFEK | |||||||
| SVSLYYTGEK | |||||||
| EVFEDAMEIR | |||||||
| GLSEDTTEETLK | |||||||
| TLVLSNLSYSATK | |||||||
| GFGFVDFNSEEDAK | |||||||
| Annexin A1 (5) | gi|124517663 | 35/6.6 | 17 | 94 | ALDLELK | ||
| SEIDMNEIK | |||||||
| DITSDTSGDFR | |||||||
| TPAQFDADELR | |||||||
| CATSTPAFFAEK | |||||||
| DITSDTSGDFRK | |||||||
| GVDEATIIDILTK | |||||||
| GTDVNVFTTILTSR | |||||||
| ALTGHLEEVVLAMLK | |||||||
| FLENQEQEYVQAVK | |||||||
| GLGTDEDTLIEILTTR | |||||||
| AAYLQENGKPLDEVLR | |||||||
| CQDLSVNQDLADTDAR | |||||||
| AAYLQENGKPLDEVLRK | |||||||
| YGISLCQAILDETKGDYEK | |||||||
| GGPGSAVSPYPSFNVSSDVAALHK | |||||||
| Annexin A2 (5) | gi|6996913 | 37/7.5 | 4 | 12 | ELYDAGVK | 226 (+) | 45 |
| QDIAFAYQR | |||||||
| TPAQYDASELK | |||||||
| TNQELQEINR | |||||||
| Dynamin-related protein 1 (6) | gi|22036081 | 60/6.3 | 2 | 3 | LGIIGVVNR | 128 (+) | 84 |
| SQLDINNKK | |||||||
| Albumin (7) | gi|30794280 | 69/5.5 | 33 | 73 | GACLLPK | 2903 (+) | 1975 |
| LVTDLTK | |||||||
| AEFVEVTK | |||||||
| YLYEIAR | |||||||
| LVVSTQTALA | |||||||
| KQTALVELLK | |||||||
| LVNELTEFAK | |||||||
| FKDLGEEHFK | |||||||
| HPEYAVSVLLR | |||||||
| HLVDEPQNLIK | |||||||
| TVMENFVAFVDK | |||||||
| SLHTLFGDELCK | |||||||
| RHPEYAVSVLLR | |||||||
| YICDNQDTISSK | |||||||
| ETYGDMADCCEK | |||||||
| LGEYGFQNALIVR | |||||||
| EYEATLEECCAK | |||||||
| DDPHACYSTVFDK | |||||||
| DAFLGSFLYEYSR | |||||||
| LKPDPNTLCDEFK | |||||||
| KVPQVSTPTLVEVSR | |||||||
| MPCTEDYLSLILNR | |||||||
| YNGVFQECCQAEDK | |||||||
| ECCHGDLLECADDR | |||||||
| MPCTEDYLSLILNR | |||||||
| RPCFSALTPDETYVPK | |||||||
| HPYFYAPELLYYANK | |||||||
| LFTFHADICTLPDTEK | |||||||
| CCAADDKEACFAVEGPK | |||||||
| LKPDPNTLCDEFKADEK | |||||||
| RHPYFYAPELLYYANK | |||||||
| ECCHGDLLECADDRADLAK | |||||||
| DAIPENLPPLTADFAEDKDVCK | |||||||
| GLVLIAFSQYLQQCPFDEHVK |
- MW, molecular weight (kDa); pI, isoelectric point; (+), positive hit in blast score.
- * Theoretical values.
3.3 Upregulation of Anxa1, Anxa2, eEf3f, and Dyrk1B mRNAs on SD/NIH3T3
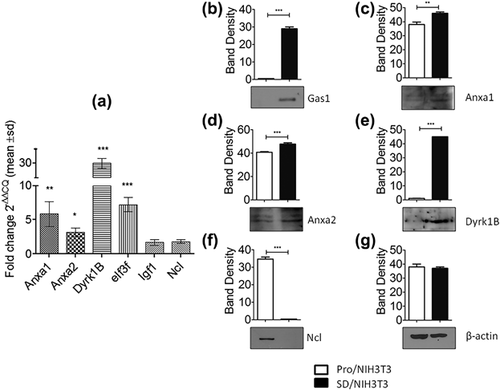
The expression of Anxa1, Anxa2, Dyrk1b, Ncl, Igf1, and eIf3f was validated by RT-qPCR analyses. The results confirmed the upregulation of these proteins as observed by two-dimensional. We found a 5.8-fold increase level for Anxa1, 3.1-fold for Anxa2, 30-fold for Dyrk1b, and 7.2-fold for eIf3f, in the SD/NIH3T3 cells; whereas Igf1 and Ncl showed no significant changes (Figure 2a). Although no significant change was observed in Ncl mRNA levels, it is known that the Ncl protein is self-cleaved in arrested cells (Fang & Yeh, 1993); therefore, to analyze the integrity of Ncl, we performed an additional experiment by Western blot. The result confirmed that Ncl was self-cleaved in SD/NIH3T3, because the band of 110 kDa, corresponding to the intact Ncl protein, was not detected (Figure 2f). Anxa1, Anxa2, and Dyrk1B were also upregulated at the translational level in SD/NIH3T3 cells (Figure 2c-e).
3.4 Inhibition of proliferation in NIH3T3-iGAS1 clones by overexpression of GAS1
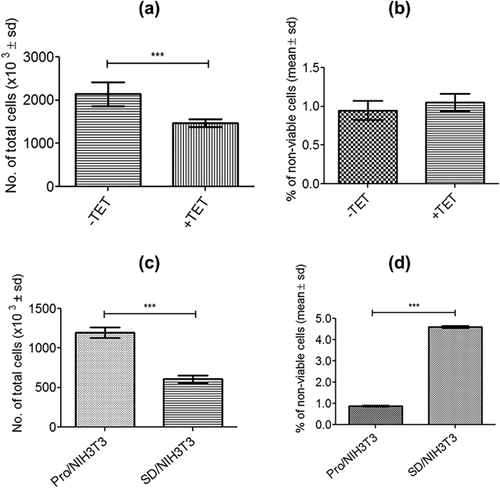
To assess the effect on proliferation and viability produced exclusively by the overexpression of GAS1 in the presence of serum (10%), and thus discarding the effects of serum deprivation, proliferation assays were performed with NIH3T3-iGAS1 clones, with or without tetracycline induction. Results showed a 25% reduction of proliferation produced by the overexpression of GAS1 (Figure 3a); but, the percentage of non-viable cells did not change (Figure 3b). These results were compared with wild type NIH3T3 cells under serum deprivation (SD/NIH3T3), where the proliferation was reduced by 51% (Figure 3c), and the percentage of non-viable cells was three-fold higher respect to the control (Pro/NIH3T3) (Figure 3d). A higher effect on cell proliferation was observed by serum deprivation than by the sole overexpression of GAS1, as well as of cell viability.
3.5 Up-regulation of Anxa1, Anxa2, and Dyrk1B induced by GAS1
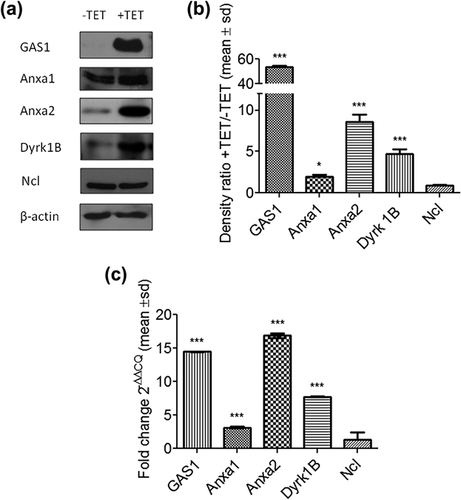
Considering their relationship with cell cycle, Anxa1, Anxa2, Dyrk 1B, and Ncl were selected for further experiments using the NIH3T3-iGAS1 clones with inducible expression of GAS1. NIH3T3-iGAS1 clones were induced with tetracycline (2 μg/ml) to express GAS1 and the protein levels of Anxa1, Anxa2, Dyrk1B, and Ncl were analyzed by Western blot. The non-induced cells were used as control. We observed that protein levels of GAS1, Anxa1, Anxa2, and Dyrk1B showed 53.4-, 1.9-, 8.6-, and 4.6-fold increase, respectively; while the levels of Ncl did not change (Figures 4a and 4b). Whereas the mRNA levels of GAS1, Anxa1, Anxa2, and Dyrk1b showed 14.4-, 3.1-, 16.8-, and 7.7-fold increase, respectively. And, no significant change was detected in Ncl (Figure 4c). β-actin was used as control for these experiments.
3.6 Functional validation with NIH3T3-iGAS1 clones
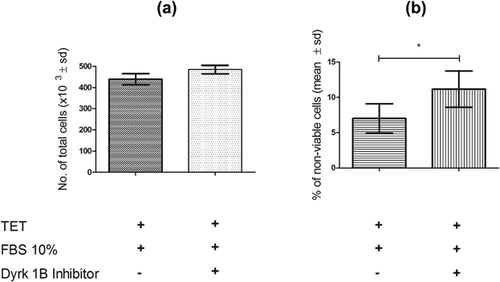
Functional validation experiments were performed with NIH3T3-iGAS1 clones overexpressing GAS1 (tetracycline 2 μg/ml) in the presence or absence of a Dyrk 1B inhibitor (INDY). The results showed that in cells overexpressing GAS1 in the presence of the Dyrk 1B inhibitor, cell proliferation was not significantly altered although it showed a slight trend to increase as compared to the control (Figure 5a), however, the percentage of non-viable cells increased significantly (Figure 5b).
4 DISCUSSION
It has been demonstrated that Gas1 mRNA is upregulated in serum-deprived NIH3T3 cells (Schneider et al., 1988). It is known that Gas1 is preferentially expressed in growth-arrested cells, as well as its ability to induce cell arrest. In this work, we found that Anxa1, Anxa2, and Dyrk1B were significantly upregulated at both the transcriptional and translational levels in serum-deprived NIH3T3 cells, whereas Ncl was downregulated but only at the translational level. Moreover, we demonstrated that Anxa1, Anxa2, and Dyrk1B were also significantly increased at the transcriptional and translational level when NIH3T3 cells were arrested by the sole overexpression of GAS1, whereas Ncl did not change. This demonstrates that Anxa1, Anxa2, and Dyrk1B, but not Ncl, are regulated at the transcriptional and translational levels by the overexpression of GAS1 in NIH3T3 cells.
Anxa1 is a pleiotropic protein that participates in several biological processes, such as apoptosis (Li et al., 2011; Shao et al., 2012; Vago et al., 2012) and cell proliferation (Alldridge & Bryant, 2003; Petrella et al., 2008; Zhang, Huang, Zhao, & Rigas, 2010). It has been demonstrated that the overexpression of Anxa1 reduces cell proliferation in different cell lines such as A7r5 (rat smooth muscle cells), RAW 264.7 (mouse macrophage cells), and HEK293 (human embryonic kidney cells). This effect of Anxa1 on cell proliferation is closely related to its capability to down-regulate cyclin D1 by modulating the activation of ERK (Alldridge & Bryant, 2003). Similarly, it has been described the anti-proliferative effect of Anxa1 in several leukemia cell lines by inducing the expression of p21, a negative regulator of cell cycle progression, through the constitutive activation of ERK (Petrella et al., 2008). On the other hand, it has been reported that Anxa1 plays an antiapoptotic role, when, it was overexpressed in serum-deprived rat retinal ganglion cells (RGC-5) (Shao et al., 2012). Upon Anxa1 overexpression, the mRNAs levels of proapoptotic proteins Bax and Caspase 3 were downregulated while the mRNA level of the antiapoptotic protein Bcl2 was upregulated, suggesting a pro-survival mechanism mediated by Anxa1. These results are consistent with our findings as, we observed an upregulation of Anxa1 at both the transcriptional and translational levels in serum-deprived NIH3T3 cells and in the cells arrested by GAS1. These data suggest that Anxa1 could be related to the ability of GAS1 to induced cell arrest because of the reduction in cell proliferation observed in GAS1-induced arrested cells (+TET) as compared to the control (−TET). Regarding the pro-survival ability of Anxa1 the results are unclear yet. Despite that the number of non-viable cells in GAS1-induced arrested cells (+TET) was significantly reduced, when it was analyzed in percentage values no difference was detected.
Anxa2 was also upregulated in NIH3T3 cells deprived of serum and in cells arrested by the induction of Gas1. Anxa2 is a multifunctional protein involved in DNA replication and cell proliferation (Chiang, Schneiderman, & Vishwanatha, 1993; Vishwanatha & Kumble, 1993), cell adhesion (Rescher, Ludwig, Konietzko, Kharitonenkov, & Gerke, 2008), metastasis (Lokman et al., 2013), cell invasion and migration (Liu et al., 2003; Zhai et al., 2011), apoptosis (Huang et al., 2008; Wang, Lin, Su, Chen, & Lin, 2009), and other functions. Previous reports indicate that Anxa2 is up-regulated during cell cycle with a maximal peak in the S-phase (Chiang et al., 1993; Wang et al., 2009); also, this protein is necessary in the early phase of cytokinesis (Benaud et al., 2015). Recently, it was observed that the increased expression of Anxa2 promotes cell viability in human CaSki cervical cancer cells and in murine tumorigenic neural stem/progenitor cells (Lei et al., 2017). Despite the lack of previous reports indicating upregulation of Anxa2 in cells arrested by GAS1, these results suggest its involvement in the reduction of cell proliferation, as observed for Anxa1. However, further studies are needed to clarify whether Anxa 1 and Anxa2 have a role in the NIH3T3 cell arrest.
The minibrain-related kinase (Mirk) or dual-specificity tyrosine-regulated kinase (Dyrk1B) was upregulated at the transcriptional and translational levels in both serum-deprived NIH3T3 cells and GAS1-induced arrested cells. Dyrk1B is a tyrosine kinase that plays different roles in several cellular processes such as muscle differentiation (Deng, Ewton, Mercer, & Friedman, 2005; Deng, Ewton, Pawlikowski, Maimone, & Friedman, 2003), cell migration (Zou, Lim, Lee, Deng, & Friedman, 2003), cell proliferation (Masuda et al., 2012), cell survival (Gao et al., 2012, 2009), tumor progression (Friedman, 2011; Yang et al., 2010), and cell cycle arrest (Gao et al., 2013; Mercer & Friedman, 2006).
In addition, a recent report shows that Dyrk1B inhibits glioma growth, and identifies it as a tumor suppressor (Lee et al., 2016). High levels of Dyrk1B in arrested NIH3T3 cells have been reported (Deng, Mercer, Shah, Ewton, & Friedman, 2004), which is in agreement with our results; and in 2009 the same group demonstrated that Dyrk1B maintains the viability of pancreatic cancer cells by reducing reactive oxygen species (ROS) (Deng, Ewton, & Friedman, 2009). Recently, we observed decreased Dyrk1B expression during iron-induced neural cell death, indicating increased cellular vulnerability to oxidative stress (Bautista, Vergara, & Segovia, 2016). Moreover, it has been observed that Dyrk1B phosphorylates and destabilizes cyclin D1 and D3, which is essential for ubiquitination and degradation in the proteasome and, for keeping cells arrested (Zou, Ewton, Deng, Mercer, & Friedman, 2004). Besides, Dyrk1B phosphorylates p27 and p21, two cyclin-dependent kinase inhibitors, which play a critical part as negative regulators of cell cycle. Dyrk1B stabilizes p27 through a phosphorylation leading to high nuclear levels of p27 and blocking the cell in G0/G1. On the other hand, when p21 is phosphorylated by Dyrk1B, it translocates from the nucleus to the cytoplasm, where it mediates cell survival by blocking proapoptotic molecules (Mercer et al., 2005).
We demonstrated that Dyrk 1B is upregulated at the transcriptional and translational levels by the overexpression of GAS1. Moreover, the functional validation experiment demonstrated that Dyrk1B contributes to the cell arrest and cell protection induced by Gas1. This conclusion is based on the facts that the percentage of non-viable cells is increased when the Dyrk1B inhibitor is present in cells that express Gas1, thus showing that the activity of Dyrk1B is involved in the Gas1-induced process of cell survival. Moreover, in GAS1-overexpressing cells, cell proliferation showed a slight trend to increase in the presence of Dyrk1B inhibitor. Therefore, we provide strong evidence showing that GAS1, through Dyrk1B, leads not only NIH3T3 cells to cell arrest but also maintains their viability.
Ncl is a 110 kDa protein and is the most abundant nucleolar phosphoprotein; however, it is also found in the nucleus and in the cytoplasm. It is a multifunctional phosphoprotein implicated in rRNA maturation and ribosome biogenesis (Ginisty, Amalric, & Bouvet, 1998; Tajrishi, Tuteja, & Tuteja, 2011) as well as chromatin organization and cell proliferation. The expression of Ncl correlates with high rates of cell proliferation and its protein levels are low in both non-proliferative cells and serum-deprived cells. It is known that Ncl has self-cleaving activity and that it is stable in proliferative cells, but it self-cleaves in non-proliferative cells (Chen, Chiang, & Yeh,1991; Fang & Yeh, 1993; Ginisty et al., 1998; Tuteja & Tuteja, 1998; Xu et al., 2012). In this work, we observed that Ncl is not regulated at the transcriptional level but that it is regulated at the translational level in SD/NIH3T3 cells. We found that Ncl protein levels were diminished and undetectable in NIH3T3 cells after 24 hr of serum starvation, as had been observed in previous reports. For this reason, we selected Ncl for subsequent experiments of GAS1-induced cell arrest. However, we did not observe changes in Ncl protein when cells were arrested by GAS1; thus, the downregulation observed in serum-deprived NIH3T3 cells was caused by serum starvation but it is not associated with GAS1 expression.
Taken together, and as a part of the effects of GAS1 on cells during cycle arrest we report the induction of Anxa1, Anxa2, and Dyrk1B which could be cooperating to maintain cell arrest and cell viability. In addition, we observed that the anti-proliferative effect is higher when cells are deprived of serum than when they are arrested exclusively by the overexpression of GAS1; indicating that other factors are involved during proliferation arrest of serum deprived cells. Moreover, we provided evidence on the relationship between GAS1 and Dyrk1B during cell arrest and cell survival.
In conclusion, we demonstrated that Anxa1, Anxa2, and Dyrk1B are upregulated at both the transcriptional and translational levels in NIH3T3 cells arrested by the over-expression of GAS1. These results suggest that these proteins could be cooperating in preserving cell viability specifically during GAS1-induced cell arrest. In this work, we provide evidence showing that GAS1, through Dyrk 1B, leads not only NIH3T3 cells to cell arrest but also supports cell viability. Further studies are required to elucidate the roles of Anxa1 and Anxa 2 in these processes.
ACKNOWLEDGMENTS
We want to thank Dr. J.M. Hernández (Cinvestav) for the gift of β-actin antibody. This work was partially supported by Conacyt grant 239516 (JS). GPS received a doctoral scholarship number 309142 from Conacyt. We thank the School of Medicine of National Autonomous University of Mexico for the support to perform the ESI-LC-MS/MS analysis.
CONFLICTS OF INTEREST
The authors have declared no conflict of interest.


