A new parameter of growth inhibition for cell proliferation assays
Abstract
Cell proliferation assays are performed by four decades to test the anti-proliferative activity of natural products and synthetic compounds in cell cultures. In cancer research, they are widely employed to evaluate drug efficacy in in vitro tumor models, such as established cell lines, primary cultures, and recently developed three-dimensional tumor organoids. In this manuscript, we demonstrated that current employed parameters used by researchers to quantify in vitro growth inhibition, IC50 and GI50, lead to a misinterpretation of results based on the exponential, and not linear, proliferation of the cells in culture. Therefore, we introduce a new parameter for the analysis of growth inhibition in cell proliferation assays, termed relative population doubling capacity, that can be employed to properly quantify the anti-proliferative activity of tested compounds and to compare drug efficacy between distinct cell models.
Abbreviations
-
- PG
-
- percentage of growth
-
- PGS
-
- percentage of growth inhibition
-
- PGT
-
- percentage of cell death
-
- R
-
- relative cell number
-
- RD
-
- relative doubling capacity
1 INTRODUCTION
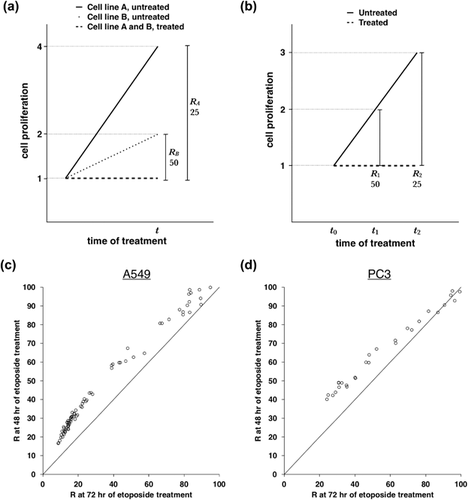
Cell proliferation assays are an extensively employed tool to evaluate the efficacy of tested compounds on a biological ex vivo model of interest. In anticancer drug development, they are used to evaluate the anti-proliferative activity of tested compounds on established tumor cell lines, primary tumor cells, and 3D tumor organoids (Adan, Kiraz, & Baran, 2016; Boyd, Paull, & Rubinstein, 1992; Finlay & Baguley, 1984; Horvath et al., 2016; Moffat, Rudolph, & Bailey, 2014; Rello-Varona, Herrero-Martín, López-Alemany, Muñoz-Pinedo, & Tirado, 2015; Selby et al., 2017). In a typical assay, cells are plated on a culture vessel and, after a sufficient amount of time necessary to recover growing phase, tested compounds are added to culture medium. At arbitrary chosen time-points, the number of cells is estimated by cell count or by an indirect method, such as measuring DNA synthesis, lactate-pyruvate conversion, or ATP concentration (Barone et al., 2017; Fiorentino et al., 2016; Kato et al., 2016; Marchesi et al., 2017; Nieddu et al., 2016; Pau et al., 2009). A parameter, representative of drug efficacy, is subsequently calculated for data representation. In this manuscript, we first describe the two most employed parameters to analyze raw data and represent in vitro drug efficacy: the relative cell number (R), used to calculate the half maximal inhibitory concentration (IC50), and the percentage of growth (PG), with an highlight on their limitations (Boyd & Paull, 1995; Yoshida, Hoshi, Kuretani, Kanai, & Ichino, 1975). We emphasize that, using these parameters to compare drug efficacy between distinct cell populations (such as cell lines), cells that grow “faster” in culture will be inferred more sensitive than “slower” ones, and therefore these parameters lead to a misinterpretation of the results because of their dependency to the unique growth properties of each cell population. Despite PG partially overcomes this limitation, we provide in the first section of the results a detailed description of the dependency of R, and consequently the IC50, to cell proliferation rate because of its frequent usage in current anticancer drug discovery research (as few recent examples (Ben et al., 2017; Cabrera et al., 2017; Esposito et al., 2017; Hamed, Darwish, Herrmann, Abadi, & Engel, 2017; Indovina et al., 2017; Koul et al., 2017; Mathema, Chaijaroenkul, Karbwang, & Na-Bangchang, 2017; Menderes et al., 2017; Mukunthan, Satyan, & Patel, 2017; Muñoz, Rosso, & Coveñas, 2017; Potenza et al., 2017; Ravi, Ramesh, & Pattabhi, 2017; Rimoldi et al., 2017; Said, Brouard, Quintana, & Estévez, 2017; Venkataramana Reddy et al., 2017; Wehbe et al., 2017; Zamora et al., 2017; Zhu et al., 2017)). Subsequently, in the second section of the results, we show that PG is also dependent on the growth properties of the cells, because of their exponential and not linear proliferation in culture. Therefore, we introduce a new parameter to determine growth inhibition, the relative doubling capacity (RD), that can be used to properly quantify and compare the anti-proliferative activity of tested compounds on exponential growing cell models.
2 MATERIALS AND METHODS
2.1 Cell cultures
Lung adenocarcinoma A549 and prostate adenocarcinoma PC3 cell lines were obtained from cell bank of the IRCCS University Hospital San Martino—IST National Institute for Cancer Research (Genova, Italy). Cells were cultured in DMEM supplemented with L-Glutamine and 10% FBS (Lifetech) at 37°C, 5% CO2 humidified air.
2.2 Kinetics of cell proliferation
500 A549 cells suspended in 20 μl of complete culture medium without phenol red were plated in 384 well flat, clear bottom black microplate (Corning #3764). After 18–24 hr, 10 μl of fresh supplemented culture medium, containing Etoposide (Sigma–AldrichMerck Group, Darmstadt, Germany, #E2600000), SiR-Hoechst (Spirochrome #SC007) (Lukinavičius et al., 2015), and CellTox™ Green Dye (Promega, Madison, WI, #G873A), were added to each well of the cell plate, to a final concentration of SiR-Hoechst 0.5 μM in vehicle (DMSO) 0.8%. A549 cells were treated with eleven 1:2 serial dilutions of Etoposide in technical triplicate, ranging from 40 to 40 nM. Plating of cells, preparation of Etoposide serial dilutions and addition of compound solutions to the cells were performed using an automated liquid handling platform (Gilson Pipetmax®, Middleton, WI). Multiple live-cell imaging in far-red fluorescence (led cube 625 nm, filter cube excitation 650 ± 30 nm, emission 800 ± 90 nm), green fluorescence (led cube 465 nm, filter cube excitation 469 ± 25 nm, emission 525 ± 25 nm) and phase contrast was performed at 37°C, 5% CO2 using a gas controller associated to the microscope, after 1, 24, 48, and 72 hr of treatment with a 4× objective, using an automated digital widefield microscope (BioTek Cytation 5, Winooski, VT). For each sample, four images were taken to cover the entire area of the well. Image merging, processing, and cell count were performed using BioTek Gen5 software. Briefly, the number of cells was calculated as count of far-red fluorescence stained nuclei and the number of dead cells was calculated as count of green fluorescence stained cells. Threshold of fluorescence background and range of nuclei size settings were manually adjusted in each experiment by overlapping images of far-red and green fluorescence with images in phase contrast as reference. Count of live cells was calculated by subtracting count of dead cells to the count of total cells. For what concerns cytotoxicity assays in PC3 cells, 2,000 cells suspended in 80 μl of complete culture medium without phenol red were plated in 96 well flat, clear bottom black microplate (Corning #3603). After 18–24 hr, 20 μl of fresh supplemented culture medium, prepared as previously described for A549 cells, was added to each well of the cell plate. PC3 cells were treated with nine 1:2 serial dilutions ranging from 10 to 40 nM in technical duplicate. Live-cell imaging and analysis were performed as previously described.
2.3 Statistical analysis
Regression analysis and T-tests were performed with microsoft excel.
3 RESULTS
3.1 The relative cell number is function of cell proliferation
 (1)
(1)
Subsequently, R and IC50 were calculated using normalized data at each time point (Supplemental Data S1 and Table 1, respectively). A much higher coefficient of variation was observed in the IC50 at 24 hr compared to 48 and 72 hr of treatment (Table 1). Since a concomitant higher coefficient of variation in the proliferation of untreated cells was not observed (Table 1), we concluded that tiny differences in drug concentration and timing of data collection among the biological replicates would strongly affect drug efficacy at a short time of treatment, as 24 hr. Therefore, we compared R and IC50 values between 48 and 72 hr of treatment. As shown in Figure 1c, R values after 72 hr of treatment were lower than those obtained at 48 hr. Consistently, IC50 after 72 hr of treatment was significantly lower than IC50 at 48 hr (Table 1, p < 0.01, two-tail heteroscedastic t-test). Similar results were obtained using a different set of data originated by treatment of PC3 cells with serial dilutions of etoposide (Table 2, Figure 1d and Supplemental Data S2). Despite it could be argued that lower R at 72 hr of treatment could be partially or totally due to the longer exposure of cells to the drug, we showed that R is function of cell proliferation rate, suggesting that R would not be a proper parameter to determine drug efficacy in cell proliferation assays, if the aim is to compare drug sensitivity between cell lines with distinct proliferation rates.
| Etoposide treatment (hours) | ||||
|---|---|---|---|---|
| 24 | 48 | 72 | Δa (%) | |
| Cell proliferation in untreated samples | ||||
| 1st | 1.84 | 3.89 | 7.59 | – |
| 2nd | 1.84 | 3.35 | 6.23 | – |
| 3rd | 1.64 | 3.31 | 5.55 | – |
| µ ± σ | 1.77 ± 0.12 | 3.52 ± 0.33 | 6.46 ± 1.04 | – |
| CV (%) | 7% | 9% | 16% | |
| Population doublings in untreated samples | ||||
| 1st | 0.88 | 1.96 | 2.92 | – |
| 2nd | 0.88 | 1.74 | 2.64 | – |
| 3rd | 0.71 | 1.73 | 2.47 | – |
| µ ± σ | 0.82 ± 0.10 | 1.81 ± 0.13 | 2.68 ± 0.23 | – |
| CV (%) | 12% | 7% | 9% | – |
| IC50 (µM) | ||||
| 1st | 18.20 | 1.18 | 0.60 | −49.1 |
| 2nd | 24.67 | 1.31 | 0.55 | −57.8 |
| 3rd | 52.02b | 1.28 | 0.56 | −56.2 |
| µ ± σ | 31.63 ± 17.95 | 1.26 ± 0.07 | 0.57 ± 0.03 | −54.4 ± 4.6 |
| CV (%) | 57% | 6% | 5% | – |
| GI50 (µM) | ||||
| 1st | 1.10 | 0.53 | 0.41 | −22.2 |
| 2nd | 1.00 | 0.52 | 0.38 | −26.7 |
| 3rd | 1.64 | 0.61 | 0.45 | −25.8 |
| µ ± σ | 1.25 ± 0.35 | 0.55 ± 0.05 | 0.42 ± 0.03 | −24.9 ± 2.4 |
| CV (%) | 28% | 9% | 7% | – |
| RD50 (µM) | ||||
| 1st | 1.21 | 0.65 | 0.61 | −6.5 |
| 2nd | 1.02 | 0.58 | 0.49 | −16.6 |
| 3rd | 1.15 | 0.58 | 0.51 | −12.5 |
| µ ± σ | 1.13 ± 0.1 | 0.61 ± 0.04 | 0.54 ± 0.07 | −11.9 ± 5.1 |
| CV (%) | 9% | 7% | 13% | – |
| TGI (µM) | ||||
| 1st | 11.89 | 5.66 | 5.60 | −1.0 |
| 2nd | 13.23 | 5.65 | 5.48 | −3.0 |
| 3rd | 14.23 | 5.81 | 4.10 | −29.3 |
| µ ± σ | 13.11 ± 1.17 | 5.71 ± 0.09 | 5.06 ± 0.83 | −11.1 ± 15.8 |
| CV (%) | 9% | 2% | 16% | − |
| RD0 (µM) | ||||
| 1st | 11.40 | 7.98 | 9.60 | +20.3 |
| 2nd | 12.64 | 7.42 | 8.72 | +17.5 |
| 3rd | 8.66 | 4.92 | 4.35 | −11.6 |
| µ ± σ | 10.90 ± 2.04 | 6.78 ± 1.63 | 7.56 ± 2.81 | 8.7 ± 17.7 |
| CV (%) | 19% | 24% | 37% | – |
- μ, mean value of the three biological replicates; σ, standard deviation; CV, coefficient of variation (σ/μ).
- a (72/48 hr)-1.
- b Out of scale.
| Etoposide treatment (hours) | ||||
|---|---|---|---|---|
| 24 | 48 | 72 | Δa (%) | |
| Cell proliferation in untreated samples | ||||
| 1st | 1.59 | 2.60 | 3.88 | – |
| 2nd | 1.62 | 2.52 | 3.54 | – |
| 3rd | 1.67 | 2.70 | 4.31 | – |
| μ ± σ | 1.63 ± 0.05 | 2.61 ± 0.09 | 3.91 ± 0.39 | – |
| CV (%) | 3% | 3% | 10% | |
| Population doublings in untreated samples | ||||
| 1st | 0.66 | 1.38 | 1.95 | – |
| 2nd | 0.69 | 1.33 | 1.82 | – |
| 3rd | 0.74 | 1.43 | 2.11 | – |
| μ ± σ | 0.70 ± 0.04 | 1.38 ± 0.05 | 1.96 ± 0.14 | – |
| CV (%) | 6% | 4% | 7% | |
| IC50 (μM) | ||||
| 1st | >10b | 6.18 | 3.46 | −44.0 |
| 2nd | >10b | 7.26 | 5.12 | −29.4 |
| 3rd | >10b | 5.51 | 3.21 | −41.8 |
| μ ± σ | >10 | 6.32 ± 0.88 | 3.93 ± 1.04 | −38.4 ± 7.9 |
| CV (%) | – | 14% | 26% | – |
| GI50 (μM) | ||||
| 1st | 6.32 | 2.56 | 2.05 | −19.5 |
| 2nd | 4.77 | 3.39 | 3.41 | +0.6 |
| 3rd | 2.58 | 2.42 | 2.20 | −9.4 |
| μ ± σ | 4.56 ± 1.88 | 2.79 ± 0.53 | 2.55 ± 0.75 | −7.6 ± 9.5 |
| CV (%) | 41% | 19% | 29% | – |
| RD50 (μM) | ||||
| 1st | 4.20 | 2.42 | 2.19 | −9.4 |
| 2nd | 4.09 | 3.33 | 3.54 | +6.3 |
| 3rd | 2.12 | 2.44 | 2.46 | +0.5 |
| μ ± σ | 3.47 ± 1.17 | 2.73 ± 0.52 | 2.72 ± 0.71 | −0.9 ± 4.5 |
| CV (%) | 34% | 19% | 26% | – |
- μ, mean value of the three biological replicates; σ, standard deviation; CV, coefficient of variation (σ/μ).
- a (72/48 hr)-1.
- b Out of scale.
3.2 The percentage of growth inhibition is function of cell proliferation
 (2)
(2) (3)
(3)
3.3 Untreated cell populations cultivated under standard conditions grow in an exponential manner
We hypothesized that the occurrence of an exponential, and not linear, growth of untreated A549 cells would contribute to the gradual PGS decrement over the time of treatment in this cell line. This hypothesis was based on the logical assumption that each mother cell duplicates into two daughter cells, which will duplicate into two new cells and so on. To evaluate which mode of growth, linear, or exponential, best fits cells maintained under standard culture conditions, we performed both linear and exponential regression analyses to the previously used data of untreated A549 and PC3 cells and calculated their coefficients of determination (R2) (Figure 4a and Supplemental Data S3). The exponential regression of the growth curves of untreated A549 samples showed a R2 > 0.99 in all the three biological replicates performed, whereas the linear regression showed a R2 < 0.95. In PC3 cells, both the exponential and the linear regression analyses showed a R2 > 0.95, with a slight higher R2 in the exponential one. It was likely that the slighter, not significant difference of GI50 in PC3 cells between the two time-points was due to the growth properties of this cell line, whose fit both a linear and an exponential regression analysis in standard culture conditions. In contrast, our results confirmed that A549 cells grew in an exponential manner, and the PGS decrement observed between 48 and 72 hr of etoposide treatment could be explained by the non-linear proliferation of untreated samples in this cell line.

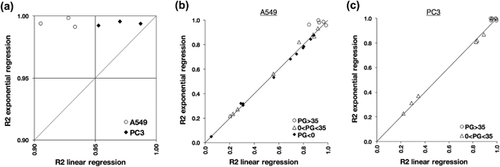
We next asked if a model of exponential growth would better fit also growth curves of etoposide-treated samples (Supplemental Data S4). We arbitrary partitioned data into milder and stronger growth inhibition effects, using PGS 35 as cut-off value, to evaluate more in detail the effects of growth inhibition on the proliferation property of the cells. Samples treated with doses of drug that induced a milder growth inhibition (PG > 35) showed similar R2 values of untreated cells in both cell lines, and therefore we concluded that a mild growth inhibition does not affect the growth properties of the cells (Figures 4b and 4c). In contrast, both regression analyses showed low R2 values in samples that induced a stronger growth inhibition (0 < PG < 35), and no difference between linear and exponential R2 values were observed (Figures 4b and 4c). Therefore, we concluded that a strong growth inhibition negatively affect the exponential growth of the cells. Overall, we confirmed that proliferation in untreated samples, in particular A549 cells, better fit a model of exponential growth and that this growth property is negatively affected by drug treatment, in particular for drug doses that induce a strong growth inhibition. We therefore speculated that PGS decrement between 48 and 72 hr of etoposide treatment, shown in Figure 3b, was consequence of the exponential growth property of the cells.
3.4 The relative doubling parameter determines growth inhibition of exponential growing cell populations
 (4)
(4) (5)
(5) (6)
(6) (7)
(7) (8)
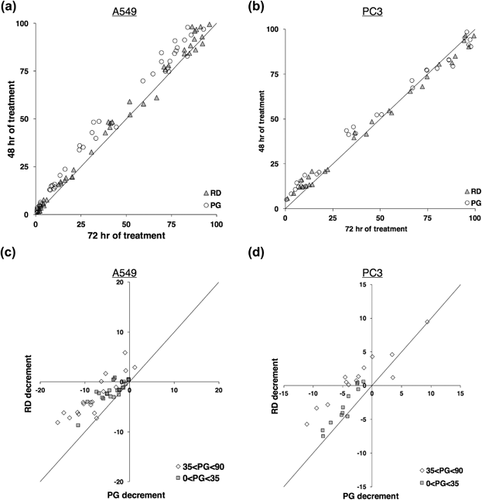
(8)Whereas PGS is the relative linear growth of treated sample to the linear growth of untreated sample, RD can be described as the doubling capacity of treated sample to the doubling capacity of untreated sample. As for R and PGS, RD has a value from 0 to 100 and can be used as well to determine two response parameters: 50% doubling capacity inhibition (RD50, RD = 50) and total doubling capacity inhibition, which corresponds to cytostasis as for TGI (RD0, RD = 0). We calculated RD, RD50, and RD0 of etoposide-treated A549 and PC3 cells using previously used data of etoposide treatment. In Figures 5a and 5c we show RD at 48 and 72 hr of treatment, in addition to PGS values as previously shown in Figures 3b and 3c, and in Figures 5c and 5d we provide a more detailed analysis by reporting the decrements of RD and PGs between 48 and 72 hr of treatment. In both cell lines, the decrement at 72 hr compared to 48 hr of treatment observed in PGS values was strikingly reduced in RD values. Consistently, the decrement of RD50 at 72 hr, compared to 48 hr, was significantly less pronounced than GI50 decrement in both cell lines (Tables 1 and 2, p < 0.01 and p < 0.05 in A549 and PC3 cells, respectively. One-tail paired t-test). As expected, we did not observe significant differences between TGI and RD0 in A549 cells, since the value is “0” in both parameters regardless of cell proliferation (Table 1). These results confirmed that a parameter that measures the ability to negatively affect the doubling capacity of cell populations is more accurate than PGS to represent in vitro growth inhibition, since it is not affected by the exponential growth property of cells in culture.
4 DISCUSSION AND CONCLUSIONS
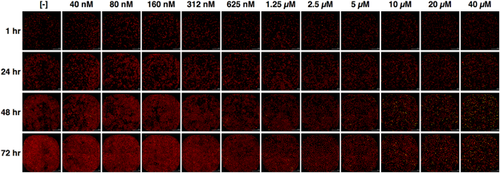
Cell proliferation assays are routinely performed to evaluate in vitro efficacy of tested compounds in anticancer drug discovery research. Relative cell number (R) and percentage of growth (PG) are parameters widely employed by researchers to show the efficacy of tested compounds on the proliferation of cells in culture because of their simplicity and intuitiveness (Boyd & Paull, 1995; Yoshida et al., 1975). However, here we show that both parameters are function of cell proliferation in tested cell model (Figures 1 and 3). In order to experimentally evaluate our hypothesis, we treated two representative cell lines, A549 and PC3, with a well-known chemotherapy agent, etoposide, and employed live-cell imaging technique to monitor the number of cells at several times of treatment (Figure 2). We also show here that PGS dependency to cell proliferation is due to the exponential, and not linear, growth of cell in culture (Figure 4). As consequence, a drug that shows a high R or PGS value after 48 hr of treatment could show lower values after longer period of treatment because of the increased growth of untreated cells and not the putative additive effects of the drug. As another example, a cell line with a fast proliferation rate in culture would show lower R or PGS values than a “slower” cell line and would be inferred more sensitive to a drug when comparing drug efficacy between the two cell lines. This is of particular relevance in studies that compare drug efficacy in distinct cell models, as cell lines, with distinct growth properties. For instance, non-tumor cells, which usually tend to duplicate slower than the tumor counterpart, shows higher IC50 and GI50 values than tumor cells and could be misinterpreted as less sensitivity to tested compounds. Same misinterpretation could occur in studies of personalized medicine that associate drug sensitivity to genetic mutations or expression profiles, since higher sensitivity will be attributed to faster growing cell lines independently by their genome or transcriptome profiles. Therefore, the development of a more precise and refined method of analysis of proliferation assays would let researchers to better pick up drug candidates for further analysis, and ultimately provide more predictable results to in vivo tests. In our representative experiments, the exponential growth of cells was negatively affected by drug treatment (Figure 4). We therefore developed a new parameter of drug efficacy, termed relative doubling capacity (RD), which quantifies the impairment of doubling capacity consequence of drug treatment. RD is a more reliable parameter than PGS to properly compare drug efficacy because it is less, or none, affected by the unique growth properties of cells in culture (Figure 5, Tables 1 and 2).
Despite it could be argued that the desired endpoint of antitumor preclinical drug discovery studies is to induce massive cell death and therefore the LC50 parameter, which quantifies drug toxicity, is the most relevant parameter for in vitro tests, we believe that the proper determination of growth inhibition is relevant as well. Indeed, the quantification of growth inhibition is relevant to define side effects on non-tumor cells or on tumor cells that do not carry the genetic alteration targeted by the tested compounds in studies of personalized medicine, or to evaluate effects on proliferation by compounds that are designed to target other cancer-related phenotypes, such as dedifferentiation or metastasization. We therefore invite other researchers to employ RD in their studies, together with PGT, to properly determine in vitro drug efficacy of tested compounds.
ACKNOWLEDGMENT
Francesco P. Fiorentino acknowledges the support from Fondazione Umberto Veronesi (Postdoctoral Grant 2017).
CONFLICTS OF INTEREST
The authors declare no conflicts of interest.


