Systematic-analysis of mRNA expression profiles in skeletal muscle of patients with type II diabetes: The glucocorticoid was central in pathogenesis
Abstract
Since the past 30 years, the prevalence of diabetes has more than doubled, making it an urgent challenge globally. We carried out systematic analysis with the public data of mRNA expression profiles in skeletal muscle to study the pathogenesis, since insulin resistance in the skeletal muscle is an early feature. We utilized three GEO datasets, containing total 60 cases and 63 normal samples. After the background removal, R package QC was utilized to finish the preprocessing of datasets. We obtained a dataset containing 2481 genes and 123 samples after the preprocessing. Quantitative quality control measures were calculated to represent the quality of these datasets. MetaDE package provides functions for conducting different systematic analysis methods for differential expression analysis. The GO term enrichment was carried out using PANTHER. Protein–protein interactions, drug-gene interactions, and genetic association of the identified differentially expressed genes were analyzed using STRING v10.0 online tool, DGIdb, and the Genetic Association Database, respectively. The datasets had good performances on IQC and EQC, which suggested that the datasets had good internal and external quality. Totally 96 differentially expressed genes were detected using 0.01 as cutoff of AW. The enriched GO terms were mainly associated with the response to glucocorticoid. There were seven genes involving in the gluconeogenesis were differentially expressed, which might be the potential treatment target for this disease. The closely connected networks and potential targets of existed drugs suggested that some of the drugs might be applied to the treatment of diabetes as well.
1 INTRODUCTION
Since the past 30 years, the prevalence of diabetes mellitus has more than doubled globally, making it one of the most urgent challenges to the world (Danaei et al., 2011). It was estimated that over 280 million people in the world had diabetes mellitus in 2010, 90% among which were type II diabetes mellitus (Shaw, Sicree, & Zimmet, 2010; Zimmet et al., 2001). Even worse, the number of people globally suffering from diabetes mellitus was predicted to become 439 million by 2030, which would account for 7.7% of the total adult population aged between 20–79 years (Shaw et al., 2010). Moreover, in 2012 alone diabetes caused 1.5 million deaths and its complications can lead to heart attack, stroke, blindness, kidney failure, and lower limb amputation (World Health Organization, 2016).
We aimed to use the public data of mRNA expression profiles in skeletal muscle to study the pathogenesis of type II diabetes. The insulin resistance in the skeletal muscle is usually considered as an early feature during the progression of type II diabetes and also a risk factor for its complications including cardiovascular disease (Petersen et al., 2007). Though the defects in glucose flux mediated by insulin have been widely considered as associated with the diabetes, the molecular pathogenesis of diabetes remains unknown. Saltiel and Kahn (2001) reported that the glucose uptake into muscle was important based on mouse data, but suggested it used an unknown mechanisms distinct from insulin signaling pathways. The studies based on identical twins and family history illustrated the importance of genetic risk factors of type II diabetes (McCarthy & Froguel, 2002). Environmental factors, including obesity, inactivity, and aging, also play critical roles in pathogenesis of type II diabetes. Because both genotype and environment converge together and influenced cellular function via gene and protein expression, we studied the alterations in mRNA expression, which defining a phenotype that parallels the metabolic evolution of diabetes and provides potential clues to pathogenesis.
Microarray-based studies of skeletal muscle from patients with type II diabetes have demonstrated that insulin resistance and reduced mitochondrial biogenesis co-exist in the early stage of pathogenesis, independently of hyperglycemia and obesity (Frederiksen et al., 2008). Despite their great promise, a lot of studies have reported that findings of microarray data were not reproducible or were sensitive to the data perturbations (Ein-Dor, Kela, Getz, Givol, & Domany, 2005; Ntzani & Ioannidis, 2003). Even worse, microarray used over 10 thousand probes on only a few samples, which exacerbated the accuracy of the potential predictors. As a result, we carried out the systematic-analysis in order to increase the reliability and generalizability of results.
In this study, we utilized three datasets from GEO, which carried out the microarray-based studies on the skeletal muscle of patients with type II diabetes, to implement the systematic analysis. We found that the genes involving in glucocorticoid metabolism were significantly differentially expressed in patients with type II diabetes. UBE2L3, PTPRU, UCP3, TFAP4, CDKN1A, ATP2B1, and ZFP36L1 might work as a potential target of diabetes’ treatment.
2 METHODS
2.1 Datasets description
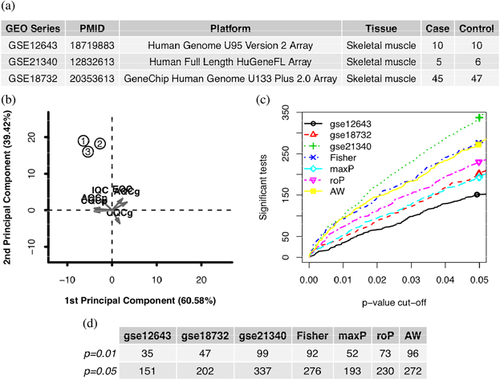
Diabetes was used as keyword to search in GEO series (https://www.ncbi.nlm.nih.gov/geo/browse/?view=series) on July 17, 2017. After removing datasets which did not use skeletal muscle tissues or were not type II diabetes, four datasets were used to study the expression profiles in patients’ muscle with type II diabetes, where one dataset using platform of Illumina were removed considering the difference of platform (Figure 1a)(Supplementary Figure S1). In GSE18732, the contributors extracted total RNA from the vastus lateralis of 47 normal and 45 type II diabetic subjects (Gallagher et al., 2010). Frederiksen et al. (2008) carried out the experiments on the skeletal muscle from ten obese patients with type II diabetes and ten healthy control subjects, whose data were posted as GSE12643. In GSE21340, human muscle samples were obtained from five subjects with type II diabetes and ten subjects without diabetes (Patti et al., 2003), where only six family history negative normal samples were used as control in this study. The raw cel files were downloaded from GEO and loaded using R package affy (Gautier, Cope, Bolstad, & Irizarry, 2004). The data of each series were preprocessed separately using mas5, which is background correction method using the lowest 2% of probe intensities as the background value, and transformed into log2 scale before further analysis.

2.2 Data pre-processing
The expression levels of all datasets were transformed into log2 scale. R package MetaQC was utilized to finish the preprocessing of datasets (Kang, Sibille, Kaminski, & Tseng, 2012) . The averages of expression values were used to represent the genes with multiple probe IDs. The expression levels of 3 datasets were first merged together according to the gene symbol and the genes that appeared in less than 2 datasets were filtered out. Given the fact that most genes were not expressed or not informative in vivo, 20% of unexpressed genes and 20% of uninformative genes were removed in order to decrease false positive. Finally, we obtained a dataset containing 2,481 genes and 123 samples after the pre-processing.
2.3 Quality control
We utilized the R package MetaQC to calculate the quantitative quality control measures, which represented the quality of these datasets (Kang et al., 2012). The measures included internal quality control index (IQC), external quality control index (EQC), accuracy quality control indexes for genes or pathways (AQCg and AQCp), and consistency of differential expression quality control (CQCg and CQCp) indexes. IQC represented the internal homogeneity of co-expression, which identified potentially inconsistent or outlier studies from quantified co-expression dissimilarity. EQC index was calculated with the supervision of external pathway database MSigDB. The Biocarta and all pathways of version 5.2 from MSigDB were applied to evaluate its consistency with each study. AQC and CQC aimed at quantifying the reproducibility of differentially expressed genes or pathways detected in an individual study compared to those detected by systematic analysis from all other studies. Principal component analysis (PCA) biplots were plotted to visualize the quality of studies.
2.4 Differentially expressed genes identification
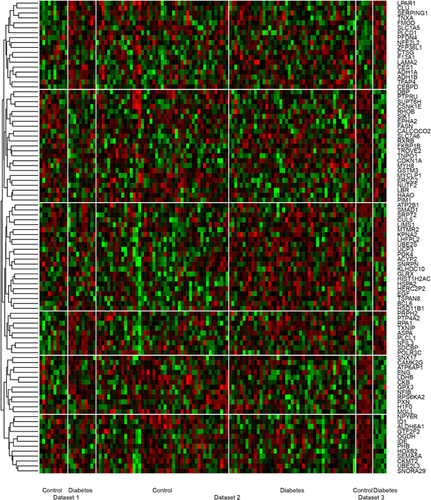
The differentially expressed genes were identified using R package MetaDE package, which provided functions for conducting different systematic analysis methods for differential expression analysis including Fisher, adaptively weighted Fisher (AW), minimum p-value (minP), maximum p-value (maxP), and rth-ordered p-value (roP) (Wang, Lin, Song, Sibille, & Tseng, 2012). In this study, we use AW of 0.01 as the cutoff for the differentially expressed genes. The heatmap of the differentially expressed genes under 0.01 AW threshold across studies were created. To assess performance of these different methods, we compared the numbers of detected differentially expressed genes from different methods under different p-value thresholds using detection competency curves.
2.5 Functional analysis
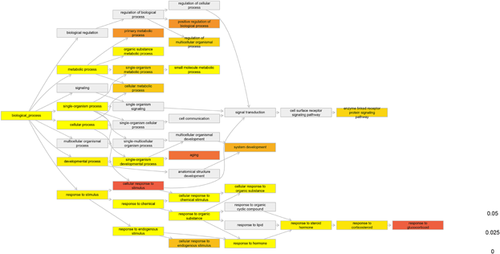
The Gene Ontology (GO) term enrichment was carried out using database from Gene Ontology Consortium (Gene Ontology Consortium, 2015) and PANTHER (Mi, Muruganujan, & Thomas, 2013). The Bonferroni adjustment was applied to identify significantly enriched terms and 0.05 was applied as the cutoff. The GO terms involving the significantly enriched terms were plotted as the GO tree with the help of R package dnet (Fang & Gough, 2014).
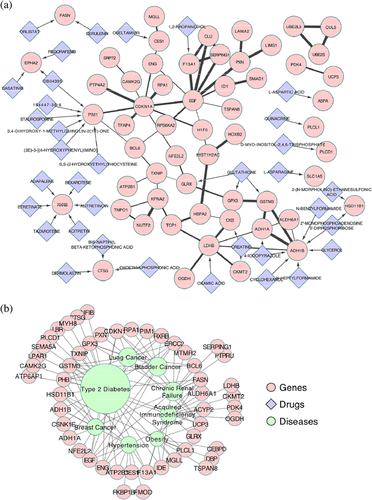
Protein–protein interactions of the identified differentially expressed genes were also analyzed using STRING v10.0 online tool that visualizes known and predicted protein-protein interactions (Szklarczyk et al., 2015). The clinically relevant drug-gene interactions were retrieved from DGIdb (Wagner et al., 2016). Finally, the Genetic Association Database was searched for the potential diseases that could be caused by the differentially expressed genes (Becker, Barnes, Bright, & Wang, 2004). The interactions and association results were all visualized using Cytoscape (Smoot, Ono, Ruscheinski, Wang, & Ideker, 2011).
3 RESULTS
3.1 Quality of datasets
Three microarray datasets of patient samples with type II diabetes were retrieved from GEO on July 17, 2017. A total of 60 cases and 63 controls were selected for further analysis (Figure 1a).
Six quality control measures were calculated (Table 1) and PCA biplots (Figure 1b) were plotted in order to visualize the quantitative measures. The first two PCs also captured high percentage of variance (90%). The datasets had good performances on IQC and EQC, which suggested that the datasets had good internal and external quality. However, the low CQCg, CQCp, AQCg, and AQCp hinted that the differentially expressed genes in the three datasets were inconsistent, which suggested the experiments were not reproducible. As a result, we thought that the shared differentially expressed genes from the three datasets were able to reflect the fact of diabetes.
| Study | IQC | EQC | CQCg | CQCp | AQCg | AQCp | Rank |
|---|---|---|---|---|---|---|---|
| GSE18732 | 20 | 3.15 | 0.05 | 0.93 | 0.55 | 1.05 | 1.67 |
| GSE12643 | 4 | 4 | 0.12 | 0.04 | 1.33 | 0.07 | 2 |
| GSE21340 | 2.67 | 1.69 | 0.16 | 0.74 | 0.19 | 0.67 | 2.33 |
3.2 Differentially expressed genes
Five main systematic analysis methods by combining p-value in MetaDE package were carried out including maxP, minP, roP, AW, and Fisher. The counts of differentially expressed genes by each independent datasets and by selected combined p-value were shown in Figures 1c and 1d. We used 0.01 of AW as the cutoff for the differentially expressed genes. Totally 96 differentially expressed genes were detected using this criteria.
The heatmap showed the expression profiles of these 96 differentially expressed genes. These genes had different patterns across the samples. For example, the top cluster included genes which were down-regulated in patients in all three datasets and the fifth cluster was genes that were highly expressed in the datasets but showed no differences in another dataset. All the identified genes were consistent in at least two datasets according to our method.
3.3 GO term enrichment
The GO term enrichment was carried out using PANTHER. There were totally 28 GO terms with a p value with Bonferroni adjustment lower than 0.05. The ontology involving the significantly enriched terms were plotted in Figure 2 and the GO terms contained less than one thousand genes were listed in Table 2

| GO term | Term ID | # In reference | # In gene set | Fold enrichment | Bonferroni |
|---|---|---|---|---|---|
| Response to corticosteroid | 31960 | 156 | 8 | 10.75 | 8.06E-03 |
| Response to glucocorticoid | 51384 | 141 | 7 | 10.41 | 4.89E-02 |
| Aging | 7568 | 262 | 9 | 7.2 | 4.30E-02 |
| Response to steroid hormone | 48545 | 330 | 11 | 6.99 | 4.86E-03 |
| Response to hormone | 9725 | 777 | 17 | 4.59 | 1.39E-03 |
| Enzyme-linked receptor protein signaling | 7167 | 714 | 15 | 4.41 | 1.33E-02 |
| Response to endogenous stimulus | 9719 | 1264 | 22 | 3.65 | 9.03E-04 |
One branch of the GO trees was the response to glucocorticoid, which was known important in the patients with type II diabetes. The genes differentially expressed in this GO terms might suggest the potential treatment target for this disease. There were seven genes involving in the gluconeogenesis were differentially expressed (Table 3). They were UBE2L3, PTPRU, UCP3, TFAP4, CDKN1A, ATP2B1, and ZFP36L1. Also, aging is another enriched terms, which were consistent with the fact that the risk of diabetes increased with aging. Moreover, the receptor signaling acted importantly (Figure 3).
| Symbol | Gene name | PANTHER protein class | AW | Regulation |
|---|---|---|---|---|
| UBE2L3 | Ubiquitin-conjugating enzyme E2 L3 | Ligase | 7.25E-03 | Up |
| PTPRU | Receptor-type tyrosine-protein phosphatase U | Protein phosphatase receptor | 2.71E-03 | Up |
| UCP3 | Mitochondrial uncoupling protein 3 | Amino acid transporter | 3.77E-03 | Down |
| Calmodulin | ||||
| Mitochondrial carrier protein | ||||
| Ribosomal protein | ||||
| Transfer/carrier protein | ||||
| TFAP4 | Transcription factor AP-4 | 1.69E-03 | Down | |
| CDKN1A | Cyclin-dependent kinase inhibitor 1 | Kinase inhibitor | 1.40E-03 | Up |
| Plasma membrane calcium-transporting | ||||
| ATP2B1 | ATPase 1 | Cation transporter | 2.28E-05 | Down |
| Hydrolase | ||||
| Ion channel | ||||
| ZFP36L1 | Zinc finger protein 36, C3H1 type-like 1 | RNA binding protein | 4.73E-03 | Down |

3.4 Network-based analysis
The differentially expressed genes were connected with each other based on the protein-protein interaction datasets (Figure 4a). Furthermore, over 30 drugs had clinical interaction with differentially expressed genes. The closely connected networks and potential targets of existed drugs suggested that some of the drugs might be applied to the treatment of diabetes as well.

Based on the Genetic Association Database, the differentially expressed genes were associated with type II diabetes as expected. Moreover, different kind of cancer, chronic renal failure, immunodeficiency, and hypertension were also associated with these differentially expressed genes. This hinted the possible relationship between diabetes and these diseases.
4 DISCUSSION
We integrated three microarray-based profiles of expression data in order to figure out the pathogenesis of type II diabetes. After the background removal, normalization and quality control, we identified 96 differentially expressed genes between patients with type II diabetes and the control. After that, we carried the functional analysis for these 96 genes. Our results showed that these genes were enriched in GO term “response to glucocorticoid”.
Under control of the hypothalamic-pituitary-adrenal axis, glucocorticoid hormones are produced by the adrenal cortex. Two intracellular receptors, including the glucocorticoid receptor and the mineralocorticoid receptor, bind to them and exert function (Di Dalmazi, Pagotto, Pasquali, & Vicennati, 2012). Glucocorticoids acted through its receptor and were able to reduce insulin sensitivity and impair β-cell function (van Raalte, Ouwens, & Diamant 2009). Glucocorticoids also impaired the uptake and the metabolism of glucose in β-cells through genomic actions, which affected the exocytotic process of insulin secretory vehicles (Seino, Shibasaki, & Minami, 2010). Hansen, Vilsboll, Bagger, Holst, and Knop (2010) reported that short-term exposure to glucocorticoids reduced the insulinotropic effects of GLP-1. More importantly, glucocorticoid excess exerted anti-insulin effects in liver, skeletal muscle, and adipose tissue. Insulin helps the uptake and storage of glucose as glycogen, reduces lipolysis and inhibits hepatic gluconeogenesis and glycogenolysis. Glucocorticoid excess might led to the development of insulin resistance by affecting all these biological activities (Di Dalmazi et al., 2012).
There were seven genes involving in the gluconeogenesis were differentially expressed. They were UBE2L3, PTPRU, UCP3, TFAP4, CDKN1A, ATP2B1, and ZFP36L1 (Table 3). UBE2L3, also named as UbcH7, was a key regulator of glucocorticoid receptor turnover and glucocorticoid sensitivity (Garside et al., 2006), which in further affected the insulin sensitivity. According to United States Patent 7897583, the antisense compounds targeted to PTPRU might be used for the prevention or treatment of diabetes (Mckay et al., 2011). Fritz et al. (2006) reported that low-intensity exercise increased skeletal muscle protein expression of UCP3 and in further improve the insulin sensitivity, which hinted that this protein involving in the regulation of mitochondrial biogenesis and metabolism. SOX4, which was associated with an increased risk of developing type II diabetes, allowed facultative beta-cell proliferation by repressing CDKN1A (Xu, Sasaki, Speckmann, Nian, & Lynn, 2017). ATP2B1 was reported to be associated with hypertension, which was common in patents with type II diabetes (Hirawa, Fujiwara, & Umemura, 2013). These seven genes might act importantly in the pathogenesis of type II diabetes. Tsujimoto et al. (2005) reported that TFAP4 were associated with glucocorticoid-induced cell death in murine thymic lymphomas. ZFP36L1 is a modulator of vascular endothelium growth factor (VEGF) mRNA stability, which participated in glucocorticoid directly (Hacker, Valchanova, Adams, & Munz, 2010).
Based on the Genetic Association Database, the differentially expressed gene in diabetes were also association with the different kinds of cancer, chronic renal failure, immunodeficiency, and hypertension. Giovannucci et al. (2010) reported that cancer incidence was positively correlated with diabetes as well as certain diabetes risk factors and diabetes treatments according to epidemiologic evidence. The possible biologic links between diabetes and cancer risk include hyperinsulinemia, hyperglycemia or chronic inflammation, but the underlying molecular mechanisms are still largely unknown (Giovannucci et al., 2010). Moreover, multiple studies reported the correlation of diabetes with immunity (Dandona, 2004; Wellen, 2005). For example, the increased concentrations of TNF-α and IL-6, associated with type II diabetes, might interfere with insulin action by suppressing insulin signal transduction. Future studies focused on these candidate genes might shed new light on the molecular mechanisms for the high risk of these diseases in diabetic patients.
In conclusion, we identified 96 differentially expressed genes in patients with type II diabetes and these genes were enriched in the response to glucocorticoid. Seven genes belonging to this term, including UBE2L3, PTPRU, UCP3, TFAP4, CDKN1A, ATP2B1, and ZFP36L1, might play critical role in the progression of diabetes and they might perform as targets of treatment. The network-based analysis also suggested the existed drug might also work for diabetes.
CONFLICT OF INTEREST
All authors declared no conflict of interest.


