Establishment of in vitro model of corneal scar pathophysiology
Abstract
Corneal scarring is the major source of permanent blindness worldwide. The complex pathophysiology of corneal scarring is not comprehensibly understood as it involves the interaction of a constellation of pro-fibrotic cytokines influencing several signaling pathways involved in corneal scar development. In the present study, an attempt has been made to generate a relatively simple in vitro corneal scar model using primary corneal keratocytes by exogenously providing an optimized dose of combination of cytokines (TGF-β1, IL-6, and IL-8) involved in scar formation in situ. Data obtained from gene and protein expression analysis depicted enhanced ECM production with discrete expression of myofibroblast specific markers. The protein–protein interactions associated these proteins to various pathways involved in wound healing, cellular migration, and cytoskeletal remodeling justifying high relevance to in vivo scar formation. Hence the developed model can be used to acquire understanding about corneal scar pathophysiology and thus might be useful for designing the treatment modalities and efficacies for controlling scar formation.
1 INTRODUCTION
Corneal scarring is the prime cause of permanent blindness worldwide (Wilson, El Haj, & Yang, 2012). The pathophysiology of corneal scar involves the interaction of a constellation of factors including external physical or chemical injury to internal responses releasing pro-fibrotic cytokines (Zieske, Takahashi, Hutcheon, & Dalbone, 2000). Impaired and prolonged wound healing induces continuous differentiation of keratocytes to myofibroblasts which demonstrate incessant proliferation and migration subsequently leading to enhanced extracellular matrix (ECM) synthesis alongwith increased and extended contraction of the wound site resulting in a scar (Karamichos, Guo, Hutcheon, & Zieske, 2010). However, the precise signaling mechanism and cytokines involved in differentiation are largely unknown. Transforming growth factor β1 (TGF-β1), a crucial cytokine involved in pathogenesis of fibrotic diseases, induces differentiation of keratocytes to myofibroblasts causing corneal fibrosis (Tandon, Tovey, Sharma, Gupta, & Mohan, 2010). At higher doses, it also regulates corneal ECM synthesis by controlling proliferatory, migratory, and differentiation related processes (Imanishi et al., 2000; Roberts, 1998; Saika, 2004). Apart from TGF-β1, a number of cytokines are upregulated following corneal injury. For example, expression of interleukin-6 (IL-6) is directly proportional to the extremity of injury (Sotozono et al., 1997), initiating signaling cascades for corneal wound healing and cellular migration (Nishida, Nakamura, Mishima, & Otori, 1992). Interleukin-8 (IL-8 or CXCL-8), predominantly secreted by fibroblasts and inflammatory cells, induces the secretion of collagen I (COL I), Tenascin (TNC) and Fibronectin (FN1) leading to enhanced ECM deposition/synthesis for wound healing. IL-8 in combination with TGF-β1 regulates the differentiation of fibroblasts to myofibroblasts inducing α-SMA expression (Desmoulière, Chaponnier, & Gabbiani, 2005; Feugate, Li, Wong, & Martins-Green, 2002). However, how these cytokines interact with each other and in turn influence the underlying signaling pathways is still not very well understood. Hence, a better understanding of this intricate process of scar formation will be useful in the future for precisely regulating the cellular activity to control scarring or developing in vitro model systems for screening efficacy of pharmaceutical molecules. Several key investigations focusing on broad spectrum pharmacological treatments have reportedly shown the regulation or inhibition of corneal scars (Majmudar et al., 2000; Netto et al., 2006; Tabbara, 2008) in animal models. For instance, Mitomycin C reduced corneal haze by inducing apoptosis of keratocytes and myofibroblasts in rabbit model (Netto et al., 2006). Prednisolone acetate reduced α-smooth muscle actin (α-SMA) production hence reducing scar formation in rabbit cornea (Sriram et al., 2014). However animal studies are often plagued with ethical issues and often provide contradictory results to in vitro data. Therefore, developing tissue engineered in vitro models which simulate their in vivo tissues hold tremendous potential to enhance our knowledge of the human disease pathology, with respect to inter-cellular and intra-cellular signaling pathways. This study will focus on establishing relatively simple in vitro corneal scar model system using primary goat corneal cells, with the aim to develop a prototype to get in depth understanding of disease origin and pathophysiology.
To develop an ideal in vitro corneal scar model, the experimental conditions should precisely regulate differentiation of keratocyte to myofibroblasts and express α-SMA eventually leading to matrix contraction, enhanced ECM synthesis, and expression of fibrotic markers (Berryhill, Kane, Stramer, Fini, & Hassell, 2003; Janin-Manificat et al., 2012; Trebaul, Chan, & Midwood, 2007). Majority of studies investigating in vitro scar models primarily focused on either enhancing ECM production to mimic the native microenvironment of scar (Karamichos et al., 2010) or understanding re-epithelisation and wound healing process. For instance, Karamichos et al. (2010) reported in vitro model of corneal fibrosis using primary corneal fibroblasts cultured with TGF-β1 and Vitamin C demonstrating extensive matrix deposition after 4 weeks. However, the model failed to address several aspects of scar formation including changes in cellular morphology during onset of scarring, expression of fibrotic markers like TNC, Secreted protein acidic and rich in cysteine (SPARC), and Thrombospondin-1 (THBS1) and the interaction between the supplemented cytokines at the molecular level. Another human cornea based ex vivo model in an air-liquid interface evaluated the effect of TGF-β1 on wound healing (Janin-Manificat et al., 2012). Cells expressed α-SMA and other fibrotic markers (TNC, SPARC, and THBS1), however only a single cytokine based response was evaluated in this model. This may not serve as an ideal model for comparison with native corneal tissue as a myriad of cytokines are involved in fibrotic response in vivo. Therefore, we believe that there is a strong need of a combinatorial cytokine based approach that would influence the differentiation of primary corneal keratocytes to myofibroblasts; can precisely recapitulate the in vivo scar pathophysiology at the molecular level. Hence, through this study we attempted to decipher the signaling crosstalks using an appropriate combination of the cytokines; TGF-β1, IL-6, and IL-8 with the aim to develop an in vitro corneal scar model and explore the underlying pathophysiological mechanism of the corneal scar that can open new insights into the cytokine based therapeutic strategies.
2 MATERIALS AND METHODS
2.1 Isolation of corneal keratocytes
Goat cornea was isolated from the ocular globe as described before (Nara et al., 2015) with approval from institutional ethical committee. Post-harvestation, stromal layer was sliced into small pieces, washed with antibiotic mix (phosphate buffer saline (PBS) containing 100 U/ml penicillin–streptomycin (Himedia, India), 50 µg/ml gentamicin sulphate (Himedia, India), and 100 µg/ml amphotericin B (Himedia, India)) and cultured for 7 days in Minimum essential medium alpha modification (alpha MEM, 1,000 mg/L glucose, Himedia) with 10% fetal bovine serum (Biological Industries, India). Freshly isolated keratocytes at passage 2 were used for further experiments.
2.2 Cell seeding on collagen coated matrices
Cell culture plates and coverslips were pre-coated with Collagen type I (50 μg/μl, Gibco, India), seeded with 10,000 keratocytes per well of 6 well culture plate and cultured for 3, 7, and 14 days, respectively. The experimental group for in vitro corneal scar (CS) model development consisted of pro-fibrotic cytokines; 10 ng/ml TGF-β1, 10 ng/ml IL-6, and 10 ng/ml IL-8 to differentiate keratocytes into myofibroblasts. This combination of cytokine was optimized following the gene expression analysis for Collagen-I at day 14 for different combinations of these cytokines as mentioned in Figure S1. The control group consisted of expansion media without cytokines. For comparison with in vitro conditions, native goat cornea was incubated with or without cytokines and subjected to gene expression analysis.
2.3 DNA content estimation
DNA content was measured using DNA extraction kit (Agilent, India) following the manufacturer's protocol. DNA purity and concentration was estimated using a Nanodrop 2000C (Thermo Scientific, Wilmington, DE).
2.4 Metabolic activity
Metabolic activity was estimated using the MTT ((3-(4, 5-dimethylthiazol-2-yl)-2, 5-diphenyltetrazolium bromide)) assay (CT01-5, Millipore, India) as described before (Chawla, Chameettachal, & Ghosh, 2015). Briefly, MTT was added in 1:10 ratio (MTT: culture media) for 3 hr at 37°C followed by dissolution with dimethyl sulphoxide (Merck, India) and absorbance was measured using iMark microplate absorbance reader (BIORAD, India) at 560 nm.
2.5 Scanning electron microscopy (SEM)
At respective time points, cell-seeded coverslips were fixed with 2.5% gluteraldehyde, alcohol dehydrated and coated using a gold sputter coater (EMITECH K550X, UK) for 1 min at 25 mA. Cell morphology was observed using SEM (model EVO 50, Zeiss, UK). Quantitative analysis on the average length of keratocytes was measured using Image J (NIH).
2.6 Histological analysis
Cell-seeded coverslips were fixed in 4% formalin and stained with hematoxylin and eosin (H&E) and Leishman and hematoxylin. Fourteen day samples were additionally stained with safranin-O dye and counter stained with hematoxylin.
2.7 Biochemical analysis
Hydroxyproline assay was used to measure the total collagen produced by the cultured cells (Kafienah & Sims, 2004) by days 1, 7, and 14. Dimethylmethylene blue assay was performed to measure the total Glycosoaminoglycans (GAG) produced by the cultured cells by day 14 (Kafienah & Sims, 2004). The estimated values for total collagen and GAG content were normalized to DNA content.
2.8 Quantitative Real time polymerase chain reaction (qRT-PCR)
Total RNA was isolated from cultured cells as well as native cornea with and without cytokines using RNeasy mini kit (Qiagen, India) according to manufacturer's protocol. Extracted RNA was reverse-transcribed into cDNA using first strand cDNA Synthesis Kit (Fermentas Life Sciences, India). Quantitative real-time RT-PCR was carried out using SYBR Green Master Mix using Rotor gene Q thermocycler (Qiagen, India). The Assay-on-demand (Qiagen, India) primers used were COL1 (QT00037793), FN1 (QT00038024), SPARC (QT00018620), TNC (QT00024409), Ras homolog gene family, member A (RHOA) (QT00044723), Matrix metallopeptidase 13 (MMP-13) (QT00001764), SMAD family member 4 (SMAD4) (QT00013174), β-catenin (QT00077882), Biglycan (BGN) (QT01870029), and Aggrecan (ACAN) (QT00001365). Glyceraldehyde 3-phosphate dehydrogenase (GAPDH) (QT00079247) was considered as housekeeping gene and 2D day 1 sample was taken as standard for all calculations. The analysis was carried out with the Rotor gene Q software using the 2−(ΔΔc(t)) method (Chawla, Kumar, Admane, Bandyopadhyay, & Ghosh, 2017). The primers were optimized with respect of cells of goat origin (Chameettachal, Murab, Vaid, Midha, & Ghosh, 2017).
2.9 Immunofluorescence analysis
Immunofluoroscence was carried out at days 3 and 14 on formalin-fixed samples (Chawla et al., 2015). Primary antibodies for anti-collagen I (4 µg/ml, Millipore), anti-SPARC (0.25 µg/5µl, BD Biosciences, India), anti-Tenascin (2 µg/ml, Sigma, India), anti-α-SMA (2 µg/ml, eBioscience, Thermo Fisher, India) with their respective secondary antibodies, Alexa Fluor 488 (Invitrogen), Alexa Fluor 546 (Invitrogen) were used. Nuclei were stained using DAPI (Invitrogen). Images were captured using Leica TCS SP5 (Leica Microsystems, Germany) inverted confocal laser scanning microscope, equipped with an argon laser (457–514 nm), a diode laser (405 nm), a DPSS laser (561 nm). The corrected total cell fluorescence was calculated as a measure of fluorescence intensity using ImageJ (NIH). DAPI stained images were converted to 3D using the Leica LAS X 3D Visualization software (Leica Microsystems, Germany). Further, nuclear depth was measured using Image J (NIH).
2.10 Protein expression analysis
After 14 days of culture, protein was extracted and identified from harvested samples as described before (Bhattacharjee et al., 2016). Briefly, protein was extracted with 7 M urea buffer, concentrated and separated on 12% SDS polyacrylamide gel. The gel was stained with coomassie brilliant blue R 250 with molecular weight marker range of 7.1–209 kDa used. Bands of interest were excised, trypsin digested and mixed with α-cyanohydroxycinnamic acid matrix in 1:2 v/v of acetonitrile in 0.1% Trifuoroacetic acid. A 1 μl of this mix was spotted on a MALDI target plate, 1,000 laser shots per MS spectra were acquired at 400 Hz pulse frequency. MALDI-TOF analysis was performed using AB SCIEX 5800 MALDI TOF-TOF (AB SCIEX, Shanghai, China). Further, MS analysis was done using protein pilot software V 3.0 (AB SCIEX). Protein identification was done using MASCOT search engine (Matrix Science) against the NCBI database in mammalian taxonomy. The protein sequences were analyzed for similarity searches by sequence search against NCBI non-redundant protein database (nr) in Capra hircus taxonomy using BLAST Tool. Protein–protein interactions were studied by STRING 10.0 (Search Tool for the Retrieval of Interacting Genes/Proteins) software.
2.11 Statistical analysis
Data are presented as mean ± SD, with n representing the number of experiments. Student's t-test was used to estimate statistical significance and probability at p < 0.01 and p < 0.05 (wherever applicable) was considered significant. n = 3 samples were considered for each experiment and each experiment was repeated twice.
3 RESULTS
3.1 Metabolic activity of the cells
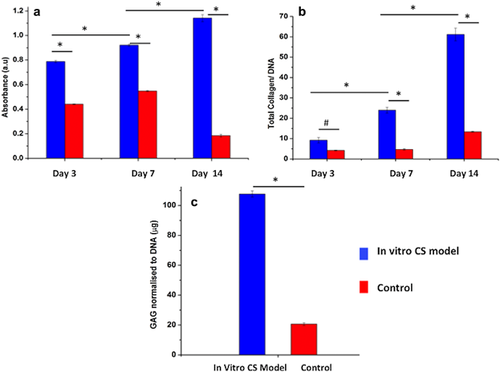
MTT assay revealed a significant increase in metabolic activity for both the groups with culture time (p < 0.01). Within the groups, in vitro CS model demonstrated 1.7 and 1.9 fold increase over control group (p < 0.01) by 3 and 14 days, respectively (Figure 1a).
3.2 Biochemical analysis
Total collagen content was estimated in order to measure the difference in the extent of ECM production by the cultured cells. Significant increase in normalized total collagen content was observed in both the groups (p < 0.01), with significantly higher values in in vitro CS model corresponding to 2.6 fold increase at day 3 and 6.6 fold at day 14 over the control group (Figure 1b).
Similarly, significant increase in GAG content (normalized to DNA content) was observed for both groups with culture time (p < 0.01), with in vitro CS model corresponding to 5.2 fold increase compared to the control group at day 14 (Figure 1c).
3.3 Morphological analysis of the cells
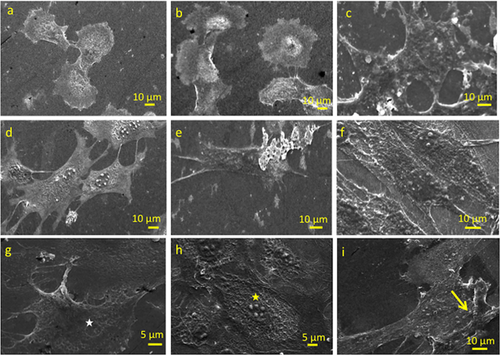
Corneal keratocytes cultured in the absence of cytokines showed inter-connected stellate-like morphology by day 3; characteristic morphology of corneal keratocytes (Fini, 1999; West-Mays & Dwivedi, 2006) (Figure 2a). At similar time point, a phenotypical transition from stellate to spread morphology of myofibroblasts was observed in in vitro CS model (Figure 2d). Moreover, considerable differences in the cellular length (defined by length of the major axis of the cells) were observed between the two experimental groups (Figure S2a), with in vitro CS model demonstrating a more elongated (73.45 ± 3.65 μm (day 3) and 87.79 ± 12.17 μm (day 7)) and flattened cell morphology with extended and interconnected filopodial protrusions as compared to the control group. By day 14, the in vitro CS model depicted conspicuous increase in cell size (126.79 ± 18.12 μm) with ruffled membranes containing moderate number of exocytotic vesicles (arrows) and stress fibres (arrowheads) in their cytoplasmic membrane (Figure 2e,f), while the cellular length was relatively consistent for the control group (Figures 2b,c and S2a). Another interesting observation was the presence of multiple nucleoli in cells of the in vitro CS model (Figure 2h) which was not observed in the control group (Figure 2g). After 14 days of culture, appearance of cells with thick bundles of fibres in the ECM of the in vitro CS model was evident (Figure 2i).
3.4 Histological analysis
Cell morphology was visualized using Leishman and hematoxylin staining. As also observed in SEM (Figure 2), cell morphology was more stellate to bipolar in the control group (Figure 3a,c,e), as opposed to being more elongated and flattened in in vitro CS model at all given time points (Figure 3b,d,f). The presence of multiple nucleoli in the in vitro CS model further validated the SEM results (inset Figure 3d). Presence of vacuoles and a large nucleus with dimensions of 23.75 ± 2.19 μm was evident in the in vitro CS model as compared to the control group (15.11 ± 2.09 μm).
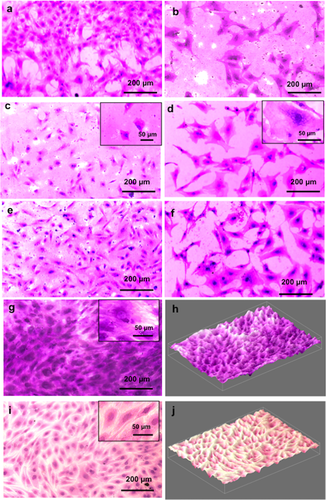
Safranin-O staining was performed to validate the GAG production in both groups (Figure 3). Light micrographs clearly demonstrated a more intense staining in in vitro CS model as compared to the control group. In addition, an extensive network of fibrous-like matrix within the acellular space immediately surrounding the cell bodies (inset image, Figure 3g) was clearly visible in the in vitro CS model. The difference in the GAG intensity could be clearly visualized from the respective 3D images of the test groups (Figure 3h for in vitro CS model and Figure 3j for control group).
3.5 Gene expression analysis
The expression of major ECM proteins COL1 and FN1; increased significantly with the increase in culture time (p < 0.01) for both the groups (in vitro CS model and control), however, significantly higher expression was noticed in the in vitro CS model at all time points (p < 0.01). By day 3, in vitro CS model showed a 23 fold upregulation of COL1 over the control group which further increased to 28 fold by day 14 (Figure 4a). Similarly for FN1 expression, in vitro CS model demonstrated 4.5 fold increase by day 3 and 5 fold at day 14 (Figure 4b) compared to control group. For native cornea, the addition of cytokines showed a significant increase (p < 0.01) in the mRNA levels of COL1 (17 fold) and FN1 (14 fold) over the control native tissue (without cytokines) by day 3.
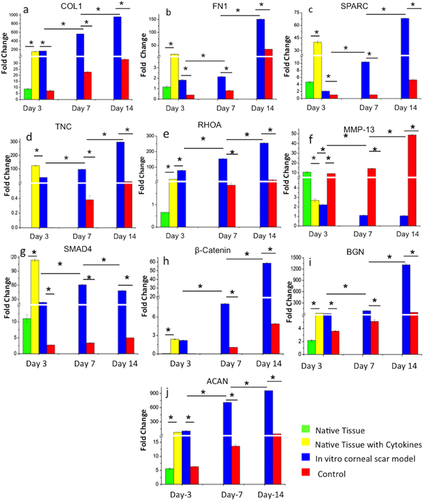
In order to characterize the myofibroblastic differentiation of corneal keratocytes, fibrotic markers such as SPARC and TNC were analyzed. The expression levels of both the genes increased with increasing culture time for both groups tested (p < 0.01). In in vitro CS model group, the expression of SPARC upregulated from 1.7 to 12.8 fold by day 14 (Figure 4c). By day 14, TNC expression was significantly upregulated (52 fold) in the in vitro CS model, over control group (p < 0.01) (Figure 4d). The native tissue with cytokines followed a similar pattern of expression for both markers with upregulated SPARC (8.5 fold) and TNC (124 fold) in the presence of cytokines over native control.
RHOA, major protein involved in matrix remodeling and cellular motility was found to be upregulated in both groups with culture time (p < 0.01), albeit expression was 14 fold upregulated in in vitro CS model over control by day 14 (significant at p < 0.01) (Figure 4e). For native cornea, RHOA was 33 fold upregulated in the presence of cytokines over native control tissue (significant at p < 0.01). MMP-13, key enzyme associated with matrix remodeling depicted an opposite trend in the two groups. The mRNA levels decreased significantly (p < 0.01) with progressing culture period for the in vitro CS model, while the expression increased significantly (4 to 45 fold) in the case of control group (p < 0.01) (Figure 4f). Similarly, native control showed 4 fold upregulation of MMP-13 (significant at p < 0.01) as compared to the corneal tissue treated with cytokines.
The gene expression of ECM proteoglycans, BGN (Figure 4i) and ACAN (Figure 4j) increased significantly with culture time (p < 0.01) for both the conditions, but was significantly higher in in vitro CS model (p < 0.01). In addition, the presence of cytokines in the native corneal tissue showed a significant increase for both markers (11 fold for BGN and 13 fold for ACAN; p < 0.01) as compared to the native corneal tissue.
3.6 SMAD and Wnt signaling pathways regulate myofibroblast differentiation
In order to understand the role of specific pathways involved in the induction of myofibroblast differentiation, expression of SMAD4 and β-catenin was monitored. The expression of SMAD4 increased initially (upto day 7) and then declined by day 14 in the in vitro CS model (p < 0.01), though the expression was significantly higher than the control at all time points (p < 0.01) (Figure 4g). For β-catenin, mRNA levels increased with culture time for both the groups (p < 0.01), with in vitro CS model demonstrating 12 fold upregulation over the control group by day 14 (p < 0.01) (Figure 4h). After the addition of cytokines, the expression of both SMAD4 (10 fold) and β-catenin (31 fold) was significantly higher in corneal tissue as compared to the native control (p < 0.01).
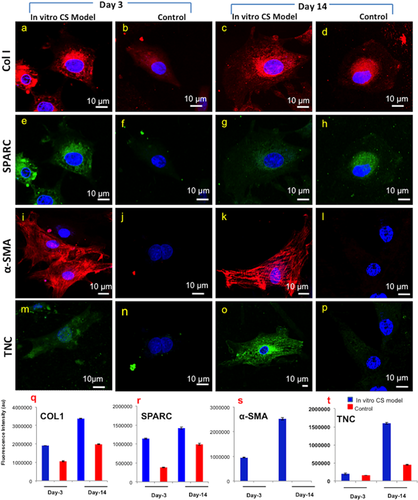
3.7 Immunofluorescence analysis
Immunofluorescence staining confirmed the presence of COL1, SPARC, and TNC in both in vitro CS model and control group (Figure 5). The modulation in fluorescence intensities were higher for in vitro CS model over control group, gene expression analysis (Figure 5q–t). α-SMA staining was only evident in the in vitro CS model indicating differentiation of cultured keratocytes to myofibroblasts in the presence of cytokines. Control group, without cytokines, demonstrated negligible staining. Quantitative analysis of α-SMA positive cells (Figure S3i,k) confirmed 34% myofibroblastic population by day 3 which increased to nearly 85% by day 14 in the in vitro CS model. In terms of nuclear depth, 5 μm depth was observed in the control group as compared to 2.8 μm in in vitro CS model (Figure S2c,d).
3.8 Protein expression analysis
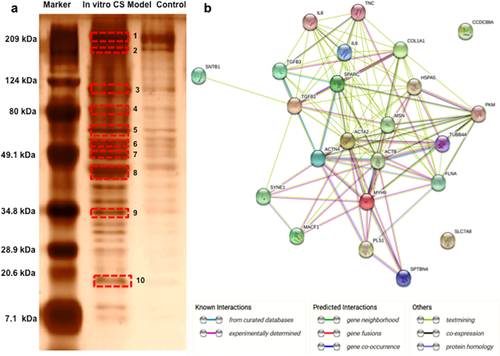
We further analyzed the differences in the protein expression profiles of the in vitro CS model and the control group by day 14 using Matrix-assisted laser desorption/ionization-Time of flight (MALDI-TOF) based protein analysis. The identified proteins are listed in Table 1. A total of 11 proteins were identified using MASCOT based NCBI database search under mammalian taxonomy. Further, BLAST results in the Capra hircus (Goat) taxonomy revealed a list of 22 proteins that were differentially upregulated in the in vitro scar model. STRING protein–protein interaction network disclosed a high degree of interconnections between the identified proteins (Figure 6b), with 22 hubs identified (a hub was identified as a gene with more than four connections). The gene ontology analysis revealed that the maximum connections identified were related to pathways involved in wounding, wound healing, actin cytoskeletal remodeling, and cellular migration suggesting close resemblance of our in vitro developed model with a typical scar tissue. The list of identified proteins included Col-I, TNC, and α-SMA that have been validated by the immunofluorescence analysis.
| Protein identified through MASCOT (Taxonomy:Mammalia) | |||||
|---|---|---|---|---|---|
| Band ID | Fold change | Score | Symbol | Name | BLAST results against capra hircus |
| 1 | 3.5 | 75 | FLNA | Filamin A | Filamin A Collagen type 1 α Spectrin Plastin |
| 2 | 2.1 | 92 | MYH9 | Myosin-9 | Nesprin Myosin-9 |
| 3 | 2.6 | 108 | ACTN4 | Alpha-actinin-4 | Girdin Alpha-actinin-4 Alpha-actinin-3 Spectrin Microtubule actin crosslinking factor 1 |
| 4 | 3.0 | 115 | MSN | Moesin | Moesin Radixin Ezrin |
| GRP78 | Glucose regulated protein 78 | 78 kDa glucoseregulated protein | |||
| 5 | 6.7 | 84 | PKM2 | M2 type pyruvate kinase | Puruvate kinase PKM |
| 6 | 3.3 | 64 | TUBB5 | Tubulin beta-5 chain | Tubulin beta chain |
| 7 | 6.7 | 70 | FAM166B | Family with sequence similarity 166, member B | Protein FAM166B |
| 8 | 50 | 87 | ACTB | Actin, cytoplasmic 1 | Actin, aortic smooth muscle Tenascin |
| 9 | 6.3 | 86 | LAT2 | Y+L amino acid transporter 2 | Y+L amino acid transporter 2 |
| 10 | 4.5 | 68 | SNTB1 | Beta-1-syntrophin | Beta-1-syntrophin Beta-2-syntrophin |
4 DISCUSSION
Corneal injury followed by chronic inflammation is one of the key events in the formation of corneal scar (Wilson et al., 2012). Previously, most studies either considered the effect of a single cytokine; TGF-β1 (Janin-Manificat et al., 2012; Karamichos et al., 2010; Wilson et al., 2012) or lacked an in depth investigation of the underlying key mechanisms. Since cytokine mediated fibrotic response is an outcome of crosstalk of a constellation of cytokines, using a single cytokine would not appropriately mimic the scar pathophysiology and microenvironment. One of the studies based on ex vivo human corneas was able to show an intense expression of fibrotic markers in the presence of TGF-β1 at 10 ng/ml (Trebaul et al., 2007) depicting in vivo like scar characteristics; therefore a similar concentration of TGF-β1 and other cytokines was used in our study. The uniqueness of our study is that we considered a combination of cytokines (TGF-β1, IL-6, IL-8) that play critical roles in scar formation hence resembling in vivo scenario more closely. Using this in vitro developed corneal scar model, we tried to address the following questions: (i) effect of the interaction of three different cytokines (TGF-β1, IL-6, IL-8) in the formation of corneal scar and (ii) exploring the complex signaling pathways involved in scar pathogenesis.
In native cornea, keratocytes are primarily involved in synthesizing normal stromal ECM which maintains transparency of the cornea. In case of injury, keratocytes differentiate toward fibroblastic lineage demonstrating typical fusiform morphology (Jester et al., 1994), eventually undergoing rapid differentiation into myofibroblasts under the influence of various cytokines (Wilson et al., 2012). In the process, several phenotypic changes are observed including increasing cell size (Fini, 1999), extended dendrites (West-Mays & Dwivedi, 2006) further connected by gap junctions (Ainscough, Linn, Barnard, Schwab, & Harkin, 2011), multiple nucleoli due to increased ribosome synthesis (Fini, 1999; West-Mays & Dwivedi, 2006); characteristics identical to our in vitro CS model, as seen in SEM (Figure 2) and histology (Figure 3) which emerged as early as day 3 in our study.
Once differentiated, these myofibroblasts are associated with uncontrolled proliferation subsequently leading to excessive ECM deposition (Gabbiani, 2003; Myrna, Pot, & Murphy, 2009; Simirski, 2014; Tuori, 1997). In agreement with this, we found drastic increase in metabolic activity of the cells throughout the culture period (Figure 1a), with enhanced ECM deposition, that is, collagen (Figure 1b) and GAG (Figures 1c and 3g), albeit only in the case of in vitro scar model. COL1 is typically associated with maintaining the structural integrity of the cornea through its unique structural organization (Fullwood, 2004). However, excessive and uncontrolled synthesis of collagen by myofibroblasts results in loss of transparency and altered mechanical strength during scar formation (Wilson et al., 2012). Corroborated to the above observation, we found significantly upregulated expression of COL1 in our in vitro CS model (biochemical (Figure 1b) and gene expression analysis). Fibronectin, which expresses within 8 hr of corneal scarring (Ding & Burstein, 2009), is reported to be involved in cell migration, adhesion (Mooradian, McCarthy, Skubitz, Cameron, & Furcht, 1993), and wound healing (Imanishi et al., 2000). During injury, the contractile apparatus of myofibroblasts attaches to the two ECM proteins, collagen and fibronectin, ligand binding through their respective receptors to cause extensive contraction of the cornea (Jester, Petroll, Barry, & Cavanagh, 1995; Masur, Cheung, & Antohi, 1993; Myrna et al., 2009). Thus, the drastic upregulation of FN1 in the in vitro CS model within 14 days of cytokine addition possibly indicated increased cellular migration and ECM synthesis as a representative of myofibroblastic differentiation with increased contraction leading to formation of scar. Also, myofibroblasts are known to deposit extensive fibrotic matrix comprising of TNC (Simirski, 2014; Tuori, 1997) and SPARC (Berryhill et al., 2003) that are known to be responsible for cell adhesion and migration during corneal wound healing. TNC upregulates within a day of the injury and mediates fibroblast recruitment to the site of injury (McKean et al., 2003; Tuori, 1997), substantially upregulated in our in vitro CS model within 3 days. While SPARC is involved in cellular migration, proliferation and maintenance of cells shape during corneal wounding as observed in a study on feline corneas (Berryhill et al., 2003; Latvala, Puolakkainen, Vesaluoma, & Tervo, 1996). Overall, the upregulated gene expression levels of COL1, FN1, TNC, and SPARC (Figure 4) in our in vitro CS model as validated by the immunofluorescence and proteomics analysis was in corroboration with the enhanced synthesis and deposition of these ECM components expressed during in vivo corneal scar formation (Funderburgh, Funderburgh, Mann, Corpuz, & Roth, 2001; Janin-Manificat et al., 2012; Latvala et al., 1996; Tuori, 1997). While increased expression of COL1, FN1, and TNC in response to TGF-β1 addition is reported previously, in both in vitro (Karamichos et al., 2010) and ex vivo models (Janin-Manificat et al., 2012), but these studies ignored the complex interplay of different cytokines involved in the in vivo scarring and hence failed to simulate the complex pathophysiology of corneal scar formation.
RHOA is as an important pro-contractile regulator that stimulates the contraction through its downstream effector ROCK (Rho-associated coiled coil-containing protein kinase), studies based on ROCK inhibition have been shown to have anti-fibrotic responses in a number of tissues including the ocular tissue (Bond et al., 2011). The higher gene expression of RHOA in our study is another clear indicator that our model closely demonstrated scar like contractility. The increased expression of fibrotic collagen III (COL-III) by the myofibroblast (Simirski, 2014) during scar can be connected with the decrease in the expression of matrix metalloproteinase MMP-13, which is a collagen III degrading enzyme (Ye, Maeda, Yu, Azar, 2000), thus, the minimal expression of MMP-13 could be considered as an indirect assumption for the possible secretion of fibrotic ECM in our in vitro CS model. Proteoglycans play an important role in corneal tissue morphogenesis by interacting with other components like collagen, controlling the fibril parameters like fibril size and diameter, thus controlling the swelling characteristics of the corneal matrix (Quantock & Young, 2008). BGN is a proteoglycan that expresses in chronic pathological corneal conditions and its enhanced expression within 24 hr of exogenous addition of TGF-β1 has been observed in vitro (Fumlerbiirgh et al., 1998). ACAN, another major proteoglycan that has been reported to show an upregulated expression during ocular diseases (Bouhenni, Hart, Al-Jastaneiah, Alkatan, & Edward, 2013) was conspicuously identified. Thus, the upregulated expression of these GAGs as observed from the gene expression, biochemical, and histological analysis are convincingly indicative of a microenvironment similar to in vivo corneal scar (Fumlerbiirgh et al., 1998).
Importantly, expression levels of pathway specific genes like SMAD4 and β-catenin was investigated in an attempt to get some valuable information concerning the pathways involved in the scar formation. SMAD4 is an important signal transduction element of the TGF-β/SMAD pathway; it forms the final complex with other SMAD molecules before their internalization to the nucleus for the transcriptional activation of myofibroblastic genes (Wilson et al., 2012). The upregulation of SMAD4 in in vitro CS model is indicative of an upregulated SMAD pathway that might be leading to the enhanced synthesis of various ECM molecules involved in scar formation. β-catenin is a key molecule of the canonical Wnt signaling that regulates the transcriptional control of scar specific genes (Carthy, Garmaroudi, Luo, & McManus, 2011) and thus is an important prospect for scar formation pathways. While the enhanced expression levels of β-catenin in in vitro CS model indicated of the involvement of Wnt signaling in scar formation, simultaneous upregulation of SMAD4 might be suggestive of the crosstalk between these two pathways to create a near perfect corneal scar model. Furthermore, the gene expression profile of the native corneal tissue with supplemented cytokines (TGF-β1, IL-6, and IL-8) as compared to the native controls (without treatment) further validated that standardised cytokine cocktail used in the study could effectively develop a 3D corneal scar model mimicking in vivo scar like properties.
Furthermore, myofibroblasts are responsible for α-SMA induced contraction of the wound site and production of excess ECM for closing the wound. The most interesting revelation of the immunofluorescence analysis was the expression of α-SMA; the most important fibrotic marker of wound healing event that regulates differentiation of activated keratocytes to myofibroblasts (Jester et al., 1995). The emergence of α-SMA positive cells as soon as day 3 was an indicator of an early fibrotic response which extended uptill day 14 with an increase in the number of α-SMA positive cells depicting phenotypically stable myofibroblasts, similar to earlier reports of in vivo and in vitro studies on fibrotic response and scar formation (Gronkiewicz et al., 2016; Janin-Manificat et al., 2012; Jester et al., 1995; Karamichos et al., 2010; Wilson et al., 2012). The increased expression of the fibrotic genes including the myofibroblastic marker α-SMA in our in vitro CS model could be related to the exogenous addition of IL-6 since IL-6 has been reported to act through JAK 1 activated ERK1/2 pathway for the induction of α-SMA expression in vivo (Gallucci, Lee, & Tomasek, 2006). IL-8 has been reported to work in combination with TGF-β1 for inducing the myofibroblast differentiation and expression of α-SMA (Desmoulière et al., 2005; Feugate et al., 2002). Moreover, there are reports of extensive crosstalk between TGF-β1 and IL-6 pathway mediated through a number of pathways like Smad2, p38, JNK, and Ras. Increased expression of IL-6 can stimulate the expression of TGF-β1 and vice versa. Since we added a combination of theses cytokines they probably acted in a positive feedback mechanism to stimulate the expression of each other. Thus, this crosstalk might be further acting for the transcriptional activation on of scar related genes and proteins leading to a better in vitro corneal scar model having close similarity with the in vivo corneal scar formation (Park et al., 2003).
Comparative proteome profiling revealed a range of proteins that were upregulated in our in vitro scar model as compared to control (Table 1). These mainly included the expression of proteins related to cytoskeletal remodeling and wound healing. For example, FLNA that mediates actin polymerization leading to increased contraction (Mohammadi et al., 2015) and further activation of P13/Akt (phosphatidylinositol 3/Akt) cell survival pathway (Gurtner & Bhatt, 2006) possibly leading to persistent proliferation of myofibroblasts. Further expression of other actin crosslinking proteins like Spectrin, MACF1, and Alpha-actinin-4 might be leading to a spread morphology (Metral et al., 2009) and stress fiber formation (Leung, Sun, Zheng, Knowles, & Liem, 1999; Welch, Odland, & Clark, 1990) in the in vitro CS model as validated by the expression of α-SMA in immunofluorescence analysis (Figure 5i,k). MACF1 expression has been directly related to β-catenin (Chen et al., 2006); thus it can be concluded that MACF1 is required to provide the necessary migratory signals for wound healing response through the Wnt/β-catenin signaling and its upregulated expression in our in vitro CS model could thus involve a similar migratory pathway. Furthermore, upregulated expression of Nesprin that forms connection between the nucleus and the cytoskeleton (Rajgor & Shanahan, 2013) could be responsible for the reduced depth of the nucleus in our in vitro CS model (Figure S3c,d), as knockdown of Nesprin has been associated earlier to increase in nuclear depth (Chancellory, Lee, Thodeti, & Lele, 2010). We also observed increased Moesin and Tubulin expression in our in vitro CS model, that are involved in the formation of cellular protrusions like the filopodia and lamillipodias (Wittmann & Waterman-Storer, 2001; Zhu et al., 2014). The list also included overexpression of ECM proteins (COL-I) and fibrotic markers (TNC and α-SMA), as also observed in immunofluorescence analysis (Figure 5). Taken together, protein–protein interaction based gene ontological analysis revealed that the protein overexpressed in in vitro scar model are mostly associated with cytoskeletal reorganization, wound healing and the cellular migratory pathways highlighting the uniqueness of the developed CS model to in vivo scar tissue.
To sum up, through the present study for the first time attempt has been made to show the interaction of a cocktail of pro-inflammatory cytokines (TGF-β1, IL-6, and IL-8) involved in corneal scar formation to establish an in vitro CS model using primary corneal keratocytes. The gene and protein expression analysis showed the expression of scar specific fibrotic ECM. Further, the protein–protein interaction disclosed a compelling link between the expressed proteins and various pathways specific to wound healing, cellular migration, and cytoskeletal remodeling suggesting close similarity to in vivo scar formation. Our results also revealed an evident crosstalk among these cytokines involving a number of signaling pathways like TGF-β/SMAD, WNT/β-catenin. Our model thus can be utilized as novel early-stage diagnostic tool facilitating inexpensive and rapid testing of therapeutic molecules targeted for the treatment of corneal scars. Therefore this study marks an important step toward ultimately replacing animal testing for drug development and toxicology studies using tissue engineered in vitro disease models. Concomitantly, it can open new avenues to understand the complex pathophysiology of the corneal scarring and could help in deciphering the complex molecular pathways involved in scar formation eventually facilitating development of low cost and effective treatment modalities.
Inspite of its stark resemblance with the in vivo corneal scar, our in vitro model has few limitations. Keratocytes of goat origin was used due to ease of availability. The present study needs to be validated on human keratocytes from non-diseased origin, from early passage number and preferably from young donor, which might be difficult to procure. This relatively simple in vitro model has been developed in 2D and hence warrants further validation in a 3D system. Also, the identified protein markers are all expressed in 2D microenvironment and thus a 3D model would simulate the layered corneal architecture more closely (Murab, Chameettachal, & Ghosh, 2016). Moreover, important detailing related to orientation of the cultured cells may also provide useful insights with respect to the resultant ECM organization and assembly. In future studies, we would attempt to fulfill the above requirements using a unified approach by using 3D bioprinting technique (Chawla et al., 2017; Das et al., 2015).
ACKNOWLEDGMENTS
This study was supported by intramural funding from IIT Delhi (High Impact project) and funding from Department of Biotechnology, Government of India (BT/PR5717/MED/32/244/2012 and BT/MB/Indo-US/VR/09/2013).


