Improvement of color stability using a chelating agent in model soft beverages subjected to Fenton reaction
Funding information: Université de Haute-Alsace, CNRS, IS2M UMR 7361, Mulhouse, France; PepsiCo Global Beverage Research and Development, New York, USA
Abstract
The colorants found in beverages are sensitive to degradation resulting in a loss of color, which can affect the perception of the product quality by the consumer. The Fenton reaction is one of the possible degradation pathways. The Fenton oxidation process is a catalytic reaction of hydrogen peroxide (H2O2) with ferrous ions (Fe2+) that generates hydroxyl radicals able to degrade the organic molecules present in the solution. In this work, the effect of the Fenton reaction in colored model soft beverages was studied using UV–visible spectrometry. The naphtol blue black was selected as a benchmark dye because it can be easily followed to probe the Fenton process. The percent degradation of this synthetic dye in an aqueous solution at pH = 3.4, simulating conditions in beverages, was monitored in the presence of FeSO4 and H2O2. Other pHs (pH = 2.7, 6.1, and 10) were also tested to obtain a full picture of the phenomenon. In an attempt to prevent the dye degradation by the Fenton reaction occurring in beverages, the effect of the addition of EDTA, a chelating metal agent able to form complexes with iron ions, was evaluated, as a model. The effect of the EDTA concentration and the influence of the pH were also explored.
1 INTRODUCTION
Food color influences the taste and flavor perception of the products.[1-3] Therefore, a loss or change of color can be considered by the consumers as a decrease in the product's quality. To avoid this, studying the factors that influence the stability of colorants in the food matrix is essential.
In beverages, numerous factors can lead to the degradation of the dyes. For instance, natural colorants are sensitive to environmental factors (such as the heat, the light, the presence of oxygen), to the pH, or to the presence of other molecules in solution.[4-6] Among these factors, the Fenton oxidation process (due to the presence of low content of Fe2+ in water) can be a potential degradation pathway of dyes in beverages.
Note that Equation (1) refers to the core reaction, but the Fenton process includes other chemical reactions as reported in the literature.[10-13]
The Fenton reaction can be harmful to beverages because of the generation of hydroxyl radicals (HO●) in the medium. Indeed, as with other free radicals, hydroxyl radicals play a major role in food degradation.[14, 15] They are extremely reactive and are able to extract hydrogen atoms from a wide range of organic molecules and can consequently degrade them. In the case of dyes, this degradation can lead to a loss of color, which is problematic for the food industry. Unfortunately, in beverages, all the conditions can be gathered to trigger a Fenton reaction. Indeed, drinking water contains traces of iron in the solution.[16-22] As for H2O2, it can be produced from the degradation of the constituents of the beverages by an auto-oxidation process due to the presence of air. For instance, H2O2 has been reported to be mainly generated by the reduction of oxygen O2 in the presence of hydrogen donating species such as phenolic compounds[23-26] found in food and beverages. Therefore, the Fenton reaction deserves attention. However, although the Fenton reaction can be a degradation pathway for the constituents of beverages, it has not been studied extensively for the stability of food products.
In the food science field, the main investigations on the Fenton reaction have focused on its application for wastewater treatment such as the discoloration and mineralization of effluents from the food industry.[27-30]
In beverages, a few studies investigated the degradation of compounds by the Fenton reaction (e.g., coffee flavor compound furfuryl mercaptan,[31] anthocyanins,[32] or sugars[33]) or by photo-induced Fenton reaction (e.g., Sunset Yellow dye[34]) but the attention is mainly focused on the understanding of wine aging[35-38] or beer stability.[39-41] A few solutions have been proposed to prevent the degradation of the compounds in beverages by the Fenton reaction, for example, the addition of SO2 that seems to scavenge the hydroxide peroxide in wine.[37] Some antioxidants (e.g., caffeic acid, vanillic acid, or catechin) have also shown their capacity for scavenging hydroxyl radicals, with the Fenton reaction as the hydroxyl radical generation system.[42] However, most of the studies on the Fenton reaction in beverages are limited to the understanding of the compound degradation due to the Fenton reaction, and solutions to prevent this reaction remain rather scarce.
In this work, the Fenton reaction was studied in a model soft beverage at pH = 3.4 on the naphtol blue black (NBB), a synthetic dye whose degradation can be easily followed by UV–visible spectroscopy.[43, 44] In addition, the study was done at other pHs (pH = 2.7, 6.1, and 10) to have a full picture of the phenomenon. Note that although the NBB is not authorized in food by the U.S. Food and Drug Administration (FDA), it constitutes a relevant dye model for this study. Indeed, this work being focused on the Fenton reaction, avoiding other sources of degradation was essential. For example, natural dyes added currently in beverages (e.g. anthocyanins[5, 6]) can be sensitive to the light, the heat, and the presence of oxygen or other organic molecules. This is why a stable synthetic dye was preferred for the study. Moreover, the absorbance peak of NBB (λ = 618 nm) does not overlap with the absorbance of the other species in the solution, allowing analyses by UV–visible spectrometry.
To avoid the dye degradation due to the Fenton reaction, the stabilization effect of the addition of ethylenediaminetetraacetic acid (EDTA) was studied. Indeed, EDTA is known to form stable metal complexes being a chelating agent[45, 46]; and has been found to prevent the iron ions to initiate the Fenton reaction in food matrices.[47] The concentration effect of EDTA, as a model chelating agent, and the influence of the pH were explored.
2 EXPERIMENTAL
2.1 Chemicals
The compounds used in this study were commercially purchased and employed without further purification: naphtol blue black BioReagent ≈ 85% dye (Sigma), iron(II) sulphate heptahydrate 99.5% for analysis (Acros Organics), hydrogen peroxide Solution 30% (w/w), puriss. p.a. (Sigma–Aldrich), EDTA BioUltra ≥99.0% (Sigma–Aldrich), buffer pH = 2 citric acid/hydrochloric acid/sodium hydroxide Normex (Carlo Erba), buffer pH = 3 citric acid/hydrochloric acid/sodium hydroxide Normex (Carlo Erba), buffer pH = 6 citric acid/sodium hydroxide Normex (Carlo Erba), buffer pH = 10 boric acid/sodium hydroxide/potassium chloride (Carlo Erba).
2.2 Preparation and analysis of solutions
Buffer solutions were prepared in Milli–Q water at pH = 2.7, 3.4, 6.1, and 10. Stock solutions (NBB solution, FeSO4 solution, and EDTA solution) were freshly prepared by dissolving in Milli–Q water NBB, FeSO4, and EDTA powders, respectively.
The stability of the dye in the solutions was followed at room temperature by UV–visible spectrometry, a simple and quantitative method for the study of colored solutions.
For the experiments, the solutions were prepared directly in the quartz cuvette used for the UV–visible analysis. For one–compound solutions, the buffer solution was introduced first in the cuvette. Then, a small quantity of the stock solution of the compound of interest was introduced directly into the cuvette with a micropipette. A magnetic bar was added and the solution was stirred. All one–compound solutions were prepared that way. For solutions containing several compounds, the solutions were prepared as follows. The buffer solution was introduced first in the cuvette. A magnetic bar was added. Then a given volume of each compound stock solution was added with a micropipette into the buffer solution in the cuvette. The concentrations used in this study are given in each Figure legend. Between each addition, the solution was stirred for 2 min, and a UV–visible spectrum was recorded. The order of addition is mentioned in the caption of each Figure. For the solutions containing NBB + FeSO4 + H2O2, H2O2 was introduced in the NBB + FeSO4 solution present in the cuvette, and a spectrum was immediately recorded (corresponding to t = 0 s). After that, the solution was stirred and a spectrum was recorded after 100, 200, and 300 s. After 300 s, the absorbance of the solution remained constant. For the solutions containing NBB + FeSO4 + EDTA + H2O2, H2O2 was introduced in the NBB + FeSO4 + EDTA solution present in the cuvette. The analysis was carried out similarly to the solution containing NBB + FeSO4 + H2O2.
The UV–visible analyses of the solutions were performed by a Cary 3 Varian UV–visible spectrophotometer with the spectra processed with the CaryWin UV scan Application software Version 2.0. Before the analyses, a blank solvent (buffer) was recorded and the presented spectra of this study were plotted by subtracting the rough spectra from the blank spectrum.
2.3 Evaluation of the dye stability
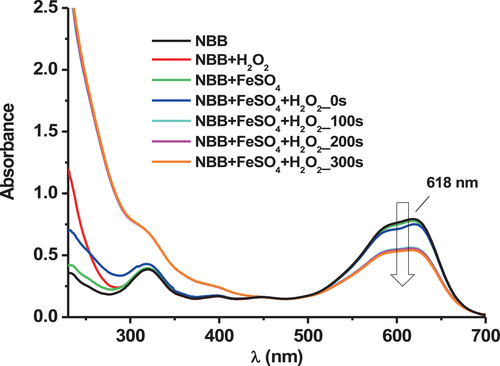
To evaluate the stability of the dye NBB in the presence of FeSO4 and H2O2 (Fenton reagents) with or without EDTA, the evolution of the absorbance of NBB, A(NBB), at its maximum absorption wavelength in the visible range (λ = 618 nm) was followed (Figure 1).
A good experimental repeatability was found (typically ≤±5%). The experimental data in the Figures correspond to the average value calculated from the results of three sets of samples. The error bars correspond to the standard deviation.
3 RESULTS AND DISCUSSION
3.1 Fenton reaction: Discoloration of NBB in the presence of FeSO4 and H2O2
3.1.1 At pH = 3.4
To evaluate the possibility of a Fenton reaction in soft beverages, the dye (NBB) was placed in conditions favorable to the Fenton reaction, i.e. in the presence of iron ions (Fe2+) and H2O2, in a citrate buffer solution (5–10% citric acid monohydrate) at pH = 3.4, close to the pH of many soft drinks.[48] Indeed, soft beverages can contain both iron and H2O2.
An amount of 0.38 mM of FeSO4 (i.e. 58 mg FeSO4/L) was introduced in the model soft beverages of this study. Drinking waters contain traces of iron in the solution. Actually, studies on bottled or tap waters all over Europe, USA, and Asia reported concentrations in the range of 0.1–700 μg iron/L.[16-22] In addition, the presence of iron can also result from the introduction of fruits in the beverages (e.g., melon seed beverages can contain 1.8 mg iron/L[49]) or of fortificants[50] (e.g., at a concentration of 50 mg iron/L[51]) to avoid nutritional iron-deficiency. The concentration used in this study was therefore higher than the natural amount of iron in drinking water but it allowed to clearly observe the Fenton reaction consequences on the dye degradation. Moreover, even if a low quantity of iron is present in drinking water, Fe2+ can be regenerated through different reactions involved in the Fenton reaction process.[10-13]
The concentration of H2O2 used for the study was on the order of 16 mM. In literature, values of produced H2O2 were reported to be in the range of 0.1 μM–1.3 mM depending on various factors such as the composition of the beverages, the pH, the storage conditions, etc. For instance, Clapp et al.[52] found that polyphenols at a concentration of 0.2–2 mM could lead to a concentration up to ~1.2 mM of H2O2 in solution, as a function of time and pH. Chai et al.[53] showed that red wine or 10 g solid/L of dried green tee could generate up to ~200 μM of H2O2 depending on the incubation time and concentration of the stock solution in the samples. Akagawa et al.[25] demonstrated that 250 μM of polyphenols could produce up to ~400 μM of H2O2 related to the pH, temperature, or incubation time, and 5 g solid/L of extracts from green tea leaves, black tea leaves, or coffee beans up to ~1.3 mM of H2O2. Grzesik et al.[54] revealed that numerous dietary antioxidants, mainly polyphenols, at a concentration of 1.1 mM could generate up to ~160 μM of H2O2 depending on the compound and media. Uppu et al.[55] reported concentrations in the range of 0.1–0.8 mM of H2O2 in freshly brewed coffee samples (1.4 g solid/L) linked to the duration and the temperature of storage. Bopitiya et al.[26] observed that the rate of produced H2O2 was correlated with beverage ingredients. Thus, the concentration of H2O2 used for the study was higher than the concentrations reported in literature. However, this quantity was chosen because the change of the dye concentration through the decrease of absorbance could be easily followed. Moreover, the quantity of produced H2O2 strongly depends on the composition, the pH, and the storage of the beverages. Consequently, a higher concentration of, for instance, polyphenols in the solution could enhance the production of H2O2.
The experimental results are given in Figure 1. The absorbance of the solution was followed by UV–visible spectrometry.
A discoloration of the dye was observed in the presence of FeSO4 and H2O2 added together in the solution, represented by the decrease of the absorbance peak of the dye at λ = 618 nm. However, no or negligible loss of color occurred when the dye was in the presence of FeSO4 or H2O2 alone. This suggests a synergic effect between the three compounds–the dye, the iron, and the hydrogen peroxide–therefore a Fenton reaction.
3.1.2 Effect of pH on the Fenton reaction
The same experiment was applied at other pHs (Figure 2 and Figure S1). The acidic pH at 2.7 and the higher pH at 6.1 were chosen (in addition to the pH at 3.4) to cover the range of most soft drinks in the USA.[48] The experiments at pH = 10 were carried out to understand the observations and for a broader scientific perspective than beverage chemistry.
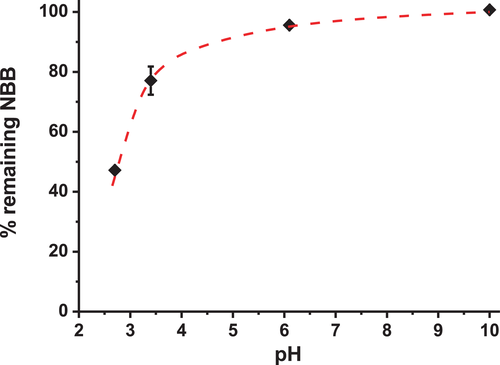
The degradation of the dye seems to increase by decreasing the pH, consistent with the literature.[56, 57] Indeed, at acidic pH (≈3), the loss of color is significant. At pH ≥ 6, there is no or negligible degradation of the dye; the Fenton reaction does not seem to occur. These observations strengthen the hypothesis of a Fenton reaction. Actually, this reaction occurs when the iron ion in the solution is at an oxidation state of +II, which can be the case at acidic pH (≈3), according to the simplified Pourbaix diagram of iron (Figure S2a). Note that at acidic pH, the iron ion could also be at an oxidation state of +III in the solution, as it has been observed in wine (pH 3–4) in the presence of organic acids.[58-60] However, in the conditions (species in solution) of the study at hand, the hypothesis of the presence of iron at a state of +II is privileged.
At pH = 6.1, the iron can be in equilibrium between iron ions and hydroxide irons (Figure S2a). This can explain the low or negligible degradation of the dye. Indeed, the Fenton reaction occurs in the presence of iron ions (and not in the presence of hydroxide irons) and at this pH, their concentration is lower than at acidic pH.
At pH = 10, the dye does not seem to degrade. This is consistent with the presence of hydroxide irons formed at this pH (Figure S2b). Since they are not involved in the Fenton reaction, the degradation of the dye does not occur.
Therefore the discoloration of the dye due to the Fenton reaction is strongly pH-dependent. Here the rate of the Fenton reaction seems to be favored while decreasing the pH. Other studies have observed the opposite,[61-63] which shows the strong dependence of the experimental conditions and the species in solution on the reaction rate of the Fenton reaction.
3.2 Formation of a Fe–EDTA complex
Since a Fenton reaction is likely to occur in model soft beverage solutions, it can be problematic for beverages industries using colorants. Indeed, a loss of color is not perceived well by the consumer and the degradation products could be unhealthy. To avoid the degradation by the Fenton reaction, it is necessary to stop it, for example by preventing the involvement of Fe(II) in the reaction. For instance, Fe(II) can be complexed to become harmless. EDTA is known to complex with Fe(II)[45, 46] or with Fe(III),[46, 60, 64] therefore the complexation with EDTA was studied in this work. Note that, while EDTA has been used in food,[47, 65-67] the controversy among chemical additives has encouraged the search for natural alternatives.[67] However, in this study, EDTA was used as a model complexing agent.
3.2.1 At pH = 3.4
The evolution of the absorbance of the mixture of EDTA and FeSO4, added together at different [EDTA]/[FeSO4] ratios in solution at pH = 3.4, was followed by UV–visible spectrometry and compared with the absorbance of EDTA and FeSO4 alone in solution. The spectra are given in Figure 3 (and in Figure S3b).
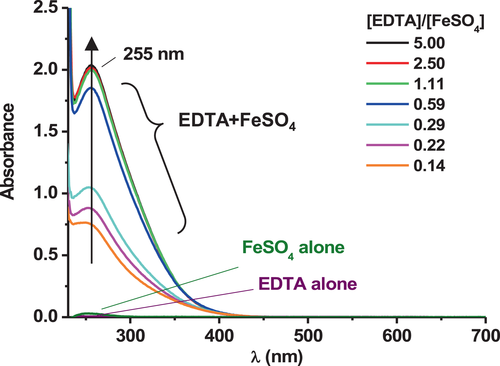
An increase of absorbance at λ = 255 nm is observed when EDTA and FeSO4 are present together in the solution, and this does not correspond to the addition of their absorbance alone in solution. This strongly suggests the formation of a Fe–EDTA complex.
According to the simplified Pourbaix diagram (Figure S2a), the complex that forms between the iron ion and EDTA in solution likely involves the iron ion at an oxidation state of +II leading to a ferrous Fe(II)–EDTA complex. However, as mentioned previously, the iron ions might also be at an oxidation degree of +III leading to a Fe(III)–EDTA complex.[46, 60, 64, 68] It could be consistent with the absorbance spectra in Figure 3. Indeed, a similar absorbance profile was found by Zhang et al.[64] for the Fe(III)–EDTA complex in acidic solution (pH < 2), with a maximum around 257 nm. Nonetheless, in the experimental conditions of the study at hand and because of the complexity of an auto-oxidation of Fe(II) into Fe(III),[69, 70] the hypothesis of the presence of iron at a state of +II is privileged.
Note that citric acid is also known to be a complexing agent of iron ions.[71, 72] Thus, a part of iron ions in the solution could complex with the citric acid of the buffer solution. However, in this study, this effect should be negligible because the dye is degrading in the Fenton conditions despite the presence of citric acid (Figure 1).
3.2.2 Effect of pH on the formation of a Fe–EDTA complex
The same experiment was reproduced at a lower pH, pH = 2.7, and at higher pHs, pH = 6.1 and 10 (Figures S3a,c,d). Figure 4 shows the evolution of the absorbance peak at λ = 255 nm of the aqueous solution containing FeSO4 and EDTA at these different pHs as a function of [EDTA]/[FeSO4] ratio.
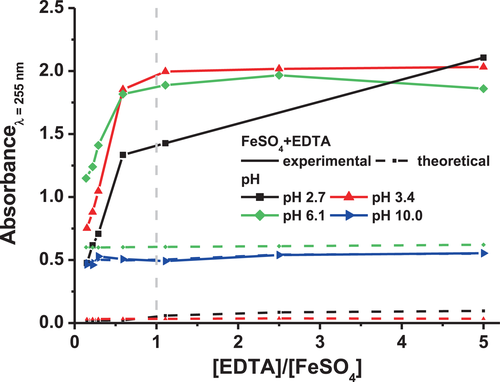
For pH = 2.7, 3.4, and 6.1, the experimental absorbance of the solution increases with the EDTA concentration, compared to the theoretical absorbance (i.e. the addition of the absorbance values of EDTA and FeSO4 alone in solution). This corroborates the formation of a Fe–EDTA complex at acidic pH, consistent with the literature which reported stable Fe–EDTA complexes in solution at these pHs.[45, 73]
However, one should notice that at pH = 6.1, even if the absorbance at λ = 255 nm seems similar to the absorbance of the solutions at lower pHs, a lower difference is observed between the theoretical and the experimental absorbance of the solution containing FeSO4 and EDTA. Indeed, the absorbance intensity value is not only attributed to the formation of the Fe–EDTA complex, but also to a higher absorbance value of FeSO4 alone at this pH (Figure S3c). Therefore, it suggests that although a Fe–EDTA complex is formed at pH = 6.1, a fewer quantity of complex might be formed compared to pH = 2.7 or 3.4. This is consistent with an equilibrium between iron ions and hydroxide irons at this pH: there are less iron ions available to complex with EDTA in the solution. In soil and plant science, a decrease in stability or a total instability of the Fe–EDTA chelate was reported from pH ≈ 6–7, for instance by Boxma et al.[74] in sphagnum peat, a sort of moss, by Novell et al.[75] in soil suspension or by Bugter et al.[76] in standard nutrition solutions used for delivering iron to the plant roots in soilless cultures.
At an alkaline pH (pH = 10), the absorbance of the solution containing FeSO4 and EDTA corresponds to the addition of the experimental absorbance of FeSO4 and EDTA alone in the solution. No Fe–EDTA complex seems to form at pH = 10 in the conditions of this study. It could be due to the state of the iron molecules at this pH. Indeed, according to the simplified Pourbaix diagram (Figure S2a), at pH = 10, the iron should form an insoluble hydroxide iron, thus unable to form a complex with EDTA.[46]
3.3 Stoichiometry of the Fe–EDTA complex
The determination of the stoichiometry allows to know the minimum amount of EDTA needed to complex the whole quantity of iron irons. Indeed, in food, using a minimum amount of food additives while keeping their properties is required in the food industry for economic reasons as well as a matter of public health.
At pH = 3.4 and 6.1, the absorbance at λ = 255 nm of the solution containing FeSO4 and EDTA increases with the [EDTA]/[FeSO4] ratio until it achieves a plateau at an [EDTA]/[FeSO4] ratio of about 1 (Figure 4). This suggests that all the available iron molecules are complexed by the EDTA when [EDTA] = [FeSO4]. This concentration of EDTA is the minimum required to complex the iron ions. Above it, i.e. when supplementary EDTA is added, the slight increase of absorbance results only from the absorbance of EDTA alone, since no more complex is formed. Thus, this suggests that only one iron molecule complexes with one EDTA molecule (stoichiometry Fe–EDTA 1:1). This contrasts with Mozuraityte et al.[69] who found that a complete inhibition of Fe2+ oxidation occurred in liposome solution at pH = 5.5 (attributed to the chelation of Fe2+ by EDTA) when the concentration ratio between EDTA and iron was 2:1. But this discrepancy could be attributed to the different solvent composition used in the study that could influence the interactions between the ligand and the metal.
At pH = 2.7, the absorbance at λ = 255 nm does not reach a plateau from [EDTA] = [FeSO4] (Figure 4). This indicates a different stoichiometry at this pH compared to the one at pH = 3.4 or 6.1 (Fe–EDTA 1:1). At pH = 2.7, the Fe–EDTA chelate seems to be composed of several EDTA molecules for one iron molecule. This could be due to a different protonated form of the EDTA molecule which is strongly pH-dependent (Figure S4). This is consistent with the study of Zhang et al.[64] which showed that in the case of Fe(III)–EDTA complexes at pH < 2, the best complexing effect was obtained with an EDTA:Fe(III) mole ratio > 1.
3.4 Effect of the Fe–EDTA complex formation on the NBB stability
3.4.1 At pH = 3.4
Since a Fe–EDTA complex seems to be formed at acidic pH, it could prevent the Fenton reaction by avoiding the core reaction (Equation [1]) to occur. This hypothesis was evaluated by observing the effect of the EDTA addition on the dye stability in a solution propitious to the Fenton reaction. The stability of the dye in the presence of FeSO4, H2O2, and EDTA was determined at pH = 3.4 with different [EDTA]/[FeSO4] ratios.
Figure 5 gives an example of the effect of EDTA addition on the absorbance of the dye solution by comparing the dye stability in the absence and in the presence of EDTA at a fixed [EDTA]/[FeSO4] ratio.
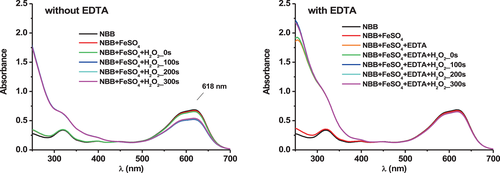
Figure 6 shows the % stabilization (Equation 3) of the dye in the presence of EDTA at different [EDTA]/[FeSO4] ratios.
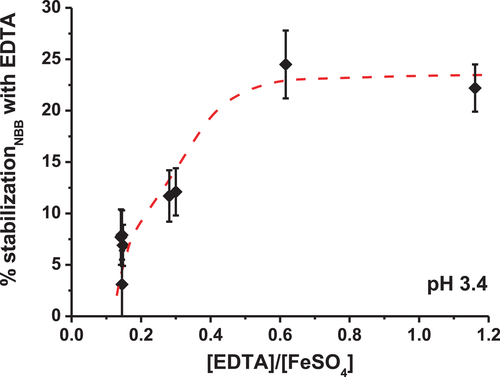
Adding EDTA to the solution helps to stabilize the dye: the loss of color decreases significantly in the presence of EDTA. Moreover, the dye is more stabilized when the concentration of EDTA increases, which is consistent with the formation of a Fe–EDTA complex. Decker et al.[47] also indicated that EDTA is very effective in beverages where it forms stable metal complexes and prevents metal ions from initiating the Fenton reaction, but without giving specific experimental details. Linxiang et al.[77] claimed that the decrease of the hydroxyl radicals formed by the Fenton reaction should occur by a quenching effect enhanced by the presence of the chelating agents rather than by the formation of chelates with the iron ions. However, EDTA seems not to be an effective quencher or radical scavenger in model beverage solutions,[78] therefore the hypothesis of the dye stabilization by the formation of a Fe–EDTA complex is here privileged. The inhibitory effect of EDTA on the decolorization of NBB at acidic pH could also be due to the scavenging effect of the Fe-EDTA complex on hydroxyl radicals (HO●).[79] In addition, EDTA could protect the dye against the Fenton reaction by preventing the recycling of iron (III) back to iron (II).[60, 68]
Regarding the [EDTA]/[FeSO4] ratio, the stabilization of the dye seems to reach a plateau at a ratio of around 0.6 (Figure 6). Messele et al.[80] observed a similar trend in the treatment of phenol as effluent in wastewaters: the presence of EDTA inhibits the phenol conversion at an [EDTA]/[FeSO4] ratio above 0.5 under Fenton reaction at pH = 3.
3.4.2 Effect of pH on the stability of NBB in the presence of EDTA
The effect of EDTA was also examined at pH = 2.7 and 6.1 (Table 1) because it was shown (Figure 4) that a Fe–EDTA complex could be formed at these pHs.
| pH | [EDTA]/[FeSO4] ratio (±0.01) | % stabilization NBBa |
|---|---|---|
| 2.7 | 0.15 | ~1%–2% |
| 0.29 | ~13%–15% | |
| 3.4 | 0.15 | ~4%–9% |
| 0.29 | ~9%–15% | |
| 1.17 | ~20%–25% | |
| 6.1 | 0.15 | ~0% |
| 1.17 | ~0%–1% |
- a Calculated from Equation (3).
The % stabilization of the dye is similar at pH = 2.7 and 3.4 for an [EDTA]/[FeSO4] ratio of 0.29. At a lower ratio (0.15), the stabilization seems slightly lower at pH = 2.7 than at pH = 3.4. This might be explained by a lower quantity of complexed iron ions (Figure 4) and therefore a lower stabilization.
At pH = 6.1, even for a high [EDTA]/[FeSO4] ratio (1.17), the addition of EDTA leads to a negligible improvement of the stabilization compared to the one at pH = 3.4. The EDTA has a negligible effect, but this is due to the already high stability of the dye at this pH even without EDTA (Figure 2); therefore the prevention of the Fenton reaction is less noticeable at pH = 6.1. Note that this trend is not necessarily similar to other organic molecules. Indeed, the addition of EDTA in the dye solution has a negligible stabilization effect but does not degrade the dye, whereas a clear degradation of the phenol due to the presence of EDTA has been observed for pHs between 6 and 8 by Messele et al. at an [EDTA]/[FeSO4] ratio of 0.3.[80]
3.5 Summary of the experiments
All the experimental results suggest that a Fenton reaction seems to occur in model soft beverages at pH ≈ 3 when the dye solution contains FeSO4 and H2O2. The resulting formation of hydroxyl radicals (HO●) is believed to cause the degradation of the dye.
At acidic pH, the solution contains ferrous iron (Fe2+) able to react with H2O2 through the Fenton reaction. This leads to the formation of hydroxyl radicals (Equation [1]) which degrade the dye. If a complexing agent such as EDTA is added to the solution, a Fe–EDTA complex is formed and the Fenton reaction can be prevented, therefore the stability of the dye can be insured.
At alkaline pH, the solution contains iron ions which can precipitate into hydroxide irons, consequently, the Fenton reaction (Equation [1]) cannot occur so no dye degradation is observed. Moreover, in aqueous solutions containing FeSO4, after the addition of EDTA, no Fe–EDTA complex seems to be formed at this pH.
At a pH between 6 and 8, the solution contains a mixture of iron ions and hydroxide irons. Thus, a Fenton reaction can partially happen. The degradation of the dye can be prevented by the formation of a Fe–EDTA complex when EDTA is added to the solution. But the effect of EDTA is less significant compared to acidic pH since the dye degradation is already low.
4 CONCLUSIONS
This study has demonstrated that a Fenton reaction could occur in a model soft beverage solution in acidic conditions (e.g., pH = 3.4) in the presence of iron molecules and H2O2. This suggests that the Fenton reaction could be a potential degradation pathway for dyes in such beverages. To avoid their discoloration, the addition of a compound, that can form a complex with iron ions, can be added. Indeed, by complexing iron ions, the chelating agent (here EDTA) should prevent iron ions (II) from reacting with H2O2, or scavenge hydroxyl radicals (HO●). Besides, it could also prevent the redox cycling of iron (III) back to iron (II).
This work provides an example of a protocol, simple but effective, to investigate the Fenton reaction in soft beverages and participates in the improvement of the quality of beverages, an important issue for the industry.
To go further, this study should be applied to dyes used in beverages and in a more complex matrix close to real beverages. In addition, other complexing compounds than EDTA should be tested, for example, tannic acid, chlorogenic acid, or quercetin, which were shown recently to be efficient chelators in beer model solutions to remove metal ions such as Fe(II).[41] Indeed, extrapolating the results of this study to other solutions is not simple. The reaction rate of the Fenton reaction depends on the extent of organic complexation of Fe(II), the pH, the ionic strength, the iron-to-ligand ratio, and the nature of the organic compounds in the solution.
AUTHOR CONTRIBUTIONS
Violaine Gérard: Visualization, Writing - Review & Editing. Emel Ay: Methodology, Investigation. Valentin Launay: Investigation. Christophe Galopin: Conceptualization. Fabrice Morlet-Savary: Supervision. Jacques Lalevée: Supervision, Methodology, Resources.
ACKNOWLEDGMENT
This research was supported by PepsiCo Global Beverage Research and Development, New York (USA) in collaboration with IS2M-CNRS, Mulhouse (France).


