An algorithm for very high pressure molecular dynamics simulations
Abstract
We describe a method to run simulations of ground or excited state dynamics under extremely high pressures. The method is based on the introduction of a fictitious ideal gas that exerts the required pressure on a molecular sample and is therefore called XP-GAS (eXtreme Pressure by Gas Atoms in a Sphere). The algorithm is most suitable for approximately spherical clusters of molecules described by quantum chemistry methods, Molecular Mechanics or mixed QM/MM approaches. We compare the results obtained by the algorithm here presented and by the XP-PCM approach, based on a continuum description of the environment. As a test case, we study the conformational dynamics of 1,3-butadiene either as an isolated molecule (“naked” butadiene) or embedded in a cluster of argon atoms, under pressures up to 15 GPa. Overall, our results show that the XP-GAS QM/MM simulation method is in good agreement with the XP-PCM QM/Continuum model (Cammi model) in describing the effect of the pressure on static properties as the equilibrium geometry of butadiene in the ground state. Furthermore, the comparison of XP-GAS simulations with naked butadiene and butadiene in argon shows the importance, for XP-GAS and related methods, of a realistic representation of the medium in modelling pressure effects.
1 INTRODUCTION
Molecular properties and chemical reactions under extremely high pressures (XP, i.e., several GPa) generated by diamond or tungsten carbide anvils are currently studied, mainly by spectroscopic methods.1-6 It has been shown that photoinduced processes can also be affected, even at lower pressures ( GPa).7, 8 Theoretical studies have shed light on the peculiar features of XP chemistry.6, 9-21 The extension of the Polarizable Continuum Model22 put forward by one of us11-13 accounts for the structural, electronic and energetic changes induced by high pressures on molecular systems, both at stable geometries and at transition states. The XP-PCM method (eXtreme Pressure Polarizable Continuum Model) has been therefore applied to study XP effects on thermal reaction kinetics and equilibria.12, 15, 16 Excited state energetics are also accessible, so data relevant to understanding the photochemistry can be provided by XP-PCM.14 However, the field of excited state molecular dynamics simulations in the extreme high pressure regime is, to the best of our knowledge, still completely unexplored.
Our aim in this paper is to develop a basic ingredient to perform such type of studies, namely a suitable barostat for extreme high pressures that should be added in the simplest way to the algorithms describing molecular dynamics by semiclassical methods, such as surface hopping.23-25 In this context, the environment is often represented as a finite cluster, an approximation compatible with many short time processes (in the range of tens of picoseconds or less) occurring in photochemistry and photophysics. The QM/MM approach is normally adopted, whereby the chromophore(s) and the reaction center are described by quantum chemistry methods and the environment by Molecular Mechanics.26-28 Molecular Dynamics simulations have been run under high pressure conditions with periodic boundary conditions (PBC).9, 19-21, 29 However, performing QM/MM excited state dynamics with PBC requires ad hoc approximations and extensive modifications of the software.30-35 This is why we prefer the cluster models, whereby the pressure can be imposed by an external computational device, without changing the algorithms describing the dynamics of the physical system. For approximately spherical systems (for instance, liquid droplets) one can use spherical boundary conditions,30 but to apply an isotropic pressure to a sample of different shape, one needs some sort of model fluid. Fictitious atomic liquids with model interatomic potentials were first proposed.36-39 Next, Grünwald and Dellago40-42 introduced an even simpler medium, namely an ideal gas bath, made of particles that interact only with the atoms of the sample. Their approach was later modified by Plotnikov and Martínez.43 In both variants of the method, the trajectories of the gas particles are only computed within a bounding box of variable shape, not much larger than the physical sample. For the sake of efficiency, the bounding box has the minimal volume compatible with its planar walls and the radius of interaction between the gas particles and the real atoms. Here we present a new version of Grünwald and Dellago's method, where the main innovation is the use of a spherical box, more suitable for clusters of solvent molecules or other (possibly isotropic) media surrounding a reaction center. However, as already noted, the applicability of the method is quite general as to the shape of the sample and its modelization (QM, MM or QM/MM). The new barostat will be called XP-GAS (eXtreme Pressure by Gas Atoms in a Sphere).
We describe the XP-GAS method in Sections 2 and 3. The XP-PCM method is briefly recalled in Section 4. We compare the results obtained with XP-GAS and XP-PCM as applied to the conformational dynamics of butadiene in Section 5. The XP-GAS simulation is based on a QM/MM description of butadiene in a cluster of Ar atoms, with the molecule treated at QM level by a semiempirical method.25
2 THE XP-GAS METHOD
Here we arbitrarily fix kJ/mol, while is a user defined parameter. The cutoff radius determines the interaction zone between the sample and a gas atom. Computational efficiency suggests to choose small values of and , in order to reduce the number of interactions to be computed. Moreover, as we shall see, decreasing also decreases the number of gas atoms to be considered. On the other hand, if is too small the gas atoms can easily penetrate the sample instead of applying a pressure on it. Reasonable values of are of the order of few Å.
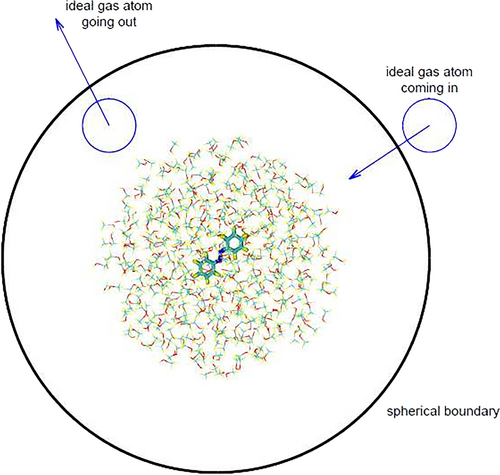
Given a temperature , which is the same for the sample and the gas, at equilibrium, the pressure can be controlled by adjusting the number density of the gas particles, since they do not interact among themselves: . Note that is the density in the region where the gas atoms do not interact with the sample: where such interactions are not negligible, the density is altered in a non trivial way. The ideal gas properties are therefore exploited by considering a sphere that contains the whole system. The surface of the sphere is external to the region where the gas atoms interact with the sample. By going through the surface of the gas atoms enter or leave the system. The inward flux is regulated according to the ideal gas laws.
We choose to put the center of the sphere in the center of mass of the sample. If is the distance of the farthest atom of the sample from , the radius of the sphere must be at least , so that the gas atoms entering the sphere are initially in the region of no interaction with the sample. To be on the safe side, we set . The volume contained inside the sphere , where we must calculate the trajectories of the gas atoms, quite clearly increases with , and the same is true for the number of the gas atoms themselves.
The mass is an arbitrary parameter. With a larger number of incoming gas atoms we can obtain a more uniform pressure, so it is convenient to choose as small as possible. However, the smaller , the higher will be the atom velocities, which can deteriorate the integration accuracy and require to reduce the time step . As a compromise, we choose a.m.u. = kg, close to the mass of the hydrogen atom, that is, the smallest mass normally present in the sample. With a pressure GPa, K, a reasonably large sphere ( Å) and fs as normally used in nonadiabatic dynamics, we get 1.7 incoming gas atoms per time step, in the average.
However, using the Poisson formula is computationally more expensive and we have left this alternative as a user option. Of course, for each time step the Poisson distribution is much broader than the choice between two integers implies, but the combination of many binary choices along a simulation partially reduces this discrepancy. Moreover, our aim is not to generate a fictitious ideal gas with the correct statistical properties (including fluctuations), but rather to apply a steady, uniform and isotropic pressure on the sample. A comparison of the two options is presented in Section S1.1.
3 ALGORITHM
In this section we shall see all the operations that must be performed to progress from time to time . We shall attach to all dynamical quantities a subscript indicating the time step: for instance, and will be the sphere parameters, , and the vectors of the gas atom positions, velocities and accelerations. Since gas atoms enter and exit the system during every time step, we must update the list of gas atoms and their total number, . The Beeman trajectory integrator,25, 44 applied to the sample atoms as well, yields the position and velocity vectors , and requires the knowledge of , , and . The accelerations, including also , are computed once the corresponding position vector is known, as , where is the potential energy function that also depends on the positions of the sample atoms.
The center of mass of the sample, and with it the center of the sphere , does move, if nothing else because of the random force exerted by the gas. Moreover, the radius of the sphere can also change in time, therefore the spheres at time steps and do not coincide. Part of the volume of the latter, the sphere , may be external to the former, the sphere . Then, it must be populated with gas atoms, choosing their positions and velocities randomly, according to the ideal gas laws seen above. Viceversa, part of the volume of may not belong to , which means the gas atoms contained in it must be removed from the list.
- Compute the number of gas atoms that will enter the sphere , as seen at the end of the previous section.
- Assign to each of the “new” gas atoms a random entry position on the surface of the sphere . We use a system of polar coordinates centered in : , and . We assign with the probability proportional to using von Neumann's rejection technique, and with no probability bias.
- Assign to each of the “new” gas atoms the radial and the tangential components of the velocity. The negative radial component is randomly sampled from the distribution , where . This distribution derives from Equation (3) by dividing both members by and ignoring all factors not dependent on . The other two components are instead sampled from the distribution (4).
- Assign to each of the “new” gas atoms its position at the beginning of the time step. We make use of its entry position on the spherical surface, with polar coordinates assigned at point 2, and of its velocity assigned at point 3. Its initial position is set as , with randomly chosen in the range . This means the gas atom is found at time in a randomly chosen point of its linear trajectory, such that during the next time step it will enter the sphere .
- Compute the “external” pressure that would be exerted, during the time step , if the ingoing gas atoms would bounce back. is proportional to the sum of the modules of the radial velocities of the ingoing atoms:
(7)where, as before, the index denotes the time step and the index is introduced to label the gas atoms (it is omitted for simplicity when describing operations that concern one atom at a time).
- Propagate to time the positions of all the particles of the system with Beeman's formula. Since we need the accelerations at step , we set to zero those of the newly generated gas atoms, that do not interact with the sample yet.
- Compute the accelerations at time with the new positions and propagate the velocities to time .
-
Remove the gas atoms that, because of their own motion, have left the sphere . At the same time, compute the “internal” pressure that would be exerted, during the time step, if the outgoing gas atoms would bounce back:
(8)where is the number of outgoing atoms during step . See Section S1.2 for the determination of the radial velocities.
- Compute the temperature of the gas particles in the sphere : , where is the total kinetic energy computed with the velocities and is the number of gas atoms at this stage (further changes will occur at points 11 and 12 to complete the transition from to ). Note that, in the long run, the gas inside the sphere will have the same temperature which is imposed to the ingoing gas atoms, and will also act as a thermostat on the sample. However, the gas thermostatic action on a large sample (thousands of atoms or more) would be quite slow. In the simulations discussed in Section 5 we applied a more efficient thermostat45 directly to the sample atoms.
- Update the center of the sphere and its radius according to their definitions given in the previous section, from to .
- Remove from the list the gas atoms contained in the sphere but not in the sphere . See Section S1.3 for details.
- Add new gas atoms in the region of sphere not belonging to . See again Section S1.3 for details. The number of gas atoms is now .
The barostat here described is implemented in a version of the semiempirical MOPAC program46 called MOPAC-PI,47 modified and developed by the Pisa research group on excited state dynamics. MOPAC-PI has been coupled with the TINKER software48 to perform QM/MM calculations. The MOPAC-PI package is currently used to run simulations of nonadiabatic dynamics by the surface hopping method, either for isolated molecules49, 50 or for more complex systems.26-28, 51
4 XP-PCM METHOD
We compared the results of simulations conducted with the method described in Sections 2 and 3 with those of XP-PCM,11, 12 using its latest version.13 XP-PCM is an extension of the PCM (Polarizable Continuum Model22), whereby the molecular “target”, described quantum-mechanically, interacts electrostatically with the polarizable continuum medium (the “solvent”) in which it is embedded. The potential energy surface (PES) of the system is then modified and takes the status of a free energy, because the solvent is represented by its equilibrium average properties. The molecular target is contained in a cavity made of interlocking spheres centered on the nuclei of the constituent atoms. Another contribution to the total free energy is the cavitation energy, that is, the work done to separate the solvent molecules when the cavity is created to accommodate the target: such energy term becomes very important at high pressures.
Within XP-PCM, the effect of the external pressure on a molecular target is introduced by a repulsive potential that represents Pauli's repulsion and limits the volume accessible to the electrons of the target. The repulsive potential vanishes inside the cavity, while outside it takes the constant value , proportional to the electron density of the solvent. The latter is equal to the number density of the solvent molecules times the number of their valence electrons. The radii of the interlocking spheres are those of Bondi (see Table 1), scaled by a factor which depends on pressure and is normally at . The volume of the cavity then also changes with pressure, and the factor is adjusted to satisfy the thermodynamic relationship . The repulsion contains a factor that depends on the pressure through the cavity volume: , where is a user supplied semiempirical parameter. The repulsive potential, as well as the electrostatic interactions, is added to the electronic hamiltonian. This way, the electronic wavefunctions and properties of the target, along with the PESs, are modified by the applied pressure.
| Atom | OPLS-AA | Bondi's | |
|---|---|---|---|
| radii | |||
| C | 0.0760 | 3.550 | 2.040 |
| H | 0.0300 | 2.420 | 1.440 |
| Ar | 0.2339 | 3.401 | 1.880 |
In the present application, energies and optimized geometries were computed with the DFT method, using the B3LYP hybrid functional and Dunning's cc-pVDZ basis set. Liquid argon was used as a compressing external medium (dielectric constant , density 1.3954 g/cm). The value of the Pauli repulsion parameter was . The scaling factor ranged from 1.2 to 0.9. The geometry optimizations were performed using the Z-Matrix internal coordinates with the constraints of symmetry. For compressed butadiene, three kinds of calculations were performed: potential energy curves as functions of the dihedral angle , with the geometries obtained in vacuo (); geometry optimizations at selected values of , for the bond lengths only, with bond angles and dihedrals fixed at their values to speed up convergence; the same with the CCC bond angles also optimized. All the XP-PCM calculations were performed using a locally modified version of the Gaussian 16 suite of programs.52
5 SIMULATIONS OF THE CONFORMATIONAL DYNAMICS OF BUTADIENE
Although the main purpose of the development of XP-GAS is the simulation of photochemistry at extreme pressures, we can as well simulate ground state dynamics. The latter is inherently simpler and lends itself to comparison with the XP-PCM method. Therefore, as a first test, we choose to simulate the effect of pressure on the equilibrium geometries and the conformational dynamics of 1,3-butadiene. No high pressure experiments concerning 1,3-butadiene were previously performed, to the best of our knowledge, with the exception of a study of the phase diagram of solid butadiene.55 The purpose of the simulations here presented is not to assess the accuracy of our predictions versus experimental results. In fact, the overall accuracy depends more on the quality of the ground state PES of butadiene than on the details of the barostat. Our aim is rather to provide an example of the working of XP-GAS and of the kind of information one can extract from the high pressure simulations. Moreover, we run distinct simulations with a “naked” butadiene molecule and with the same molecule surrounded by a cluster of Ar atoms, in order to test the importance of a realistic description of the medium.
5.1 Reparameterization of the semiempirical hamiltonian
- TBD for --butadiene;
- GBD for -butadiene;
- CBD for --butadiene;
- TS for the transition state between TBD and GBD.
A very accurate study of such stationary points was performed by Feller and Craig.56 They made use of the coupled clusters theory at the CCSD(T) level, with the cc-pVQZ basis set, plus further corrections. Their results are in excellent agreement with Raman spectroscopy data by Engeln et al.57 We then took these computational and experimental results as reference for the reparameterization of the semiempirical hamiltonian.
We performed geometry optimizations of the four critical points TBD, GBD, CBD and TS. Table 2 shows that the semiempirical methods implemented in MOPAC46, 47 (MNDO, AM1, PM3, PM5) with their standard parameters fail to predict the correct energy differences between the target critical points. Overall the potential energy curve as a function of the torsion angle is too flat in comparison with the computational56 and experimental57 references. A plausible explanation could be the well known weakness of dispersion and repulsion potentials of PM3 and related semiempirical hamiltonians.58 Therefore, we added Lennard-Jones potentials between all pairs of C and H atoms, using the parameters and rules of OPLS-AA48, 53 (see Table 1). This modification results in a modest improvement, as shown in Table 2. The low values of the TS energy obtained with all the tested semiempirical methods suggest that the conjugation effect is underestimated.
| GBD | CBD | TS | |||
|---|---|---|---|---|---|
| Method | |||||
| ab initioa | 35.5 | 0.131 | 0.151 | 101.7 | 0.278 |
| B3LYPb | 29.9 | 0.159 | 0.168 | 100.0 | 0.328 |
| Ramanc | 42.5 | 0.123 | 0.173 | 103.4 | 0.257 |
| MNDO | 36.0 | 0.013 | 0.020 | 92.6 | 0.020 |
| AM1 | 14.3 | 0.033 | 0.034 | 91.1 | 0.085 |
| PM3 | 26.7 | 0.031 | 0.031 | 92.1 | 0.065 |
| PM5 | 35.4 | 0.005 | 0.016 | 97.6 | 0.037 |
| MNDO+LJ | 55.8 | 0.011 | 0.025 | 89.7 | 0.013 |
| AM1+LJ | 35.4 | 0.050 | 0.055 | 89.0 | 0.075 |
| PM3+LJ | 35.6 | 0.046 | 0.058 | 88.3 | 0.055 |
| PM5+LJ | 47.0 | 0.014 | 0.037 | 95.6 | 0.028 |
| R-AM1+LJ | 33.9 | 0.133 | 0.169 | 101.6 | 0.250 |
- Note: For TBD, and for CBD, =0. Four semiempirical hamiltonians were tested, with or without the addition of Lennard-Jones potentials as indicated by the +LJ label (see text). The last line refers to the reparameterized AM1 hamiltonian with the addition of Lennard-Jones terms.
- a Feller and Craig.56
- b This work, B3LYP with the cc-pVDZ basis set.
- c Engeln et al.57
We then proceeded to reparameterize the semiempirical hamiltonian. The procedure59 consists in defining a set of relevant target values (energy differences, equilibrium coordinates, vibrational frequencies) that are known with sufficient accuracy, and to train the semiempirical method to reproduce them as best as possible. The target data were: the energies of the CBD, GBD and TS critical points with respect to TBD; the C-C bond lengths and C-C-C bond angles of the four critical points; the and dihedral angles of the GBD and TS structures (the dihedral refers to the terminal H atom which is close to be eclipsed); and, the four lowest vibrational frequencies60 of TBD. All data, with the exception of the experimental vibrational frequencies, were taken from Feller and Craig.56 Twelve parameters were optimized, that is, all those involved in the determination of the semiempirical wavefunctions and pertaining to the C atoms. The parameters of the core-core potentials and all those of the H atoms were left unchanged. Details of the procedure and of its outcome are given in Section S2. The best results were obtained by starting from the AM1 parameters with the addition of Lennard-Jones potentials. The last line of Table 2, labelled R-AM1+LJ (reparameterized AM1 + Lennard-Jones), summarizes such results. We see that the dihedrals we obtained are very close to the target ones.56 Also the energy differences are well reproduced: actually, the two energy data that show relatively large discrepancies with respect to the targets (CBD and TS) are closer to the experimental estimates.57
5.2 XP-GAS simulations
We ran two sets of simulations: in the first set the sample was just one molecule of butadiene (“naked” butadiene), while in the second the butadiene molecule was surrounded by a large cluster of argon atoms (butadiene in Ar). In both cases the simulations lasted 20 ps and two initial conformations were tried, TBD and GBD. Pressures up to 15 GPa were applied, including , that is, the free sample in vacuo. The radius of the gas atoms was set to Å. In all simulations the temperature was K. We applied the Langevin thermostat45 to the sample atoms.
Butadiene was represented by the R-AM1+LJ semiempirical method. The pair interactions Ar-Ar, Ar-C and Ar-H were computed by the OPLS-AA force-field, which in this case reduces to Lennard-Jones potentials (see Table 1 for the parameters). The Ar cluster was approximately spherical, with radius of about 20 Å, and contained initially 1048 atoms, spaced by 3.76 Å (twice the van der Waals radius). Some atoms in the center were removed to host the butadiene molecule, so the cluster surrounding TBD reduced to 1036 Ar atoms, and the one with GBD, to 1039. All simulations, with the exception of those with , were preceded by an equilibration run of at least 6 ps, whereby the sample atoms did not move, in order to save computing time. During the equilibration we monitored the internal pressure , which was initially zero. We stopped the equilibration at the time , when the time average of over the interval was found to differ from the desired value by less than .
One of the relevant properties of the sample is its volume, which was evaluated by considering all atoms as spheres with fixed radii. We used the van der Waals radii as compiled by Bondi,54 scaled by a factor 1.2, that is, the same radii taken as reference in XP-PCM (see Table 1). The atom spheres in a molecule do overlap, and computing the volume of such a solid is a non-trivial problem. We used the algorithm developed by Buša et al.61 and their freely available software ARVO.
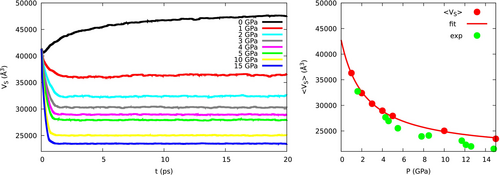
Here GPa is a compressibility parameter, Å is the extrapolation of the volume at vanishing pressure (the value at was not included in the fitting), while Å is the asymptotic value that would be reached at large pressures of the order of 100 GPa. Almost identical results are obtained with GBD instead of TBD, since the contribution of butadiene to the volume is small, and the difference between the two conformers, as we shall see, is less than 0.3 Å. These data compare well with the experimental ones, obtained by static measurements,62 but the difference tends to increase at the highest pressures, because the OPLS potential is slightly too repulsive at short Ar-Ar distances (see Patkowski et al.63 for a very accurate potential).
5.3 Conformational dynamics
As a preliminary consideration, it is worth to compare the volumes of the four optimized conformations for the isolated molecule: we list them in Table 3, along with the C-C bond distances, the and bond angles and the dihedral. According to the R-AM1+LJ semiempirical geometry optimizations, the two stable conformers show the largest volume difference: Å. At the B3LYP geometries the volume changes follow a similar pattern, but the difference is smaller ( Å) and the volume of CBD is smaller than that of GBD. In both cases, GBD and CBD are stabilized with respect to TBD at high pressures because of their smaller volumes. The GBDTBD free energy difference is also decreased by the entropic contribution , due to the existence of two GBD enantiomers: at K, this amounts to eV.
| R-AM1+LJ | B3LYP/cc-pVDZ | |||||||
|---|---|---|---|---|---|---|---|---|
| TBD | GBD | CBD | TS | TBD | GBD | CBD | TS | |
| 1.374 | 1.373 | 1.371 | 1.370 | 1.343 | 1.341 | 1.342 | 1.337 | |
| 1.468 | 1.470 | 1.468 | 1.476 | 1.459 | 1.471 | 1.473 | 1.488 | |
| 117.7 | 121.1 | 124.4 | 119.5 | 124.3 | 125.9 | 127.3 | 124.8 | |
| 180.0 | 33.9 | 0.0 | 101.6 | 180.0 | 30.6 | 0.0 | 99.0 | |
| Volume | 98.120 | 97.863 | 97.895 | 98.261 | 99.283 | 99.160 | 99.050 | 99.553 |
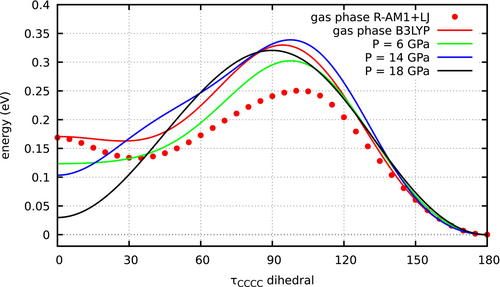
The molecular volumes do change when applying large pressures, mainly due to deformations of the molecular geometry but also to the confinement of the electronic cloud. The XP-PCM method takes into account both effects. In Figure 3 we show the potential energy curves of butadiene in gas phase, as a function of the torsion angle , obtained by optimizing all the other internal coordinates at B3LYP/cc-pVDZ and R-AM1+LJ levels. Three more curves represent the free energies obtained at , 14 and 18 GPa by the XP-PCM method (remember that by XP-PCM the PESs acquire the status of free energies–see Section 4–yet can be directly compared with ordinary PES computed for the isolated molecule). Taking as starting point the geometries obtained in vacuo, the bond lengths were reoptimized, keeping the bond angles and the dihedrals fixed. The further optimization of the C-C-C bond angles did not result in noticeable changes in the geometries and free energies (see Table S4). The effect of pressure is to stabilize CBD with respect to TBD: at 18 GPa, the free energies of the two conformers only differ by about 0.03 eV. This effect is mainly due to bond shortening, rather than to the confinement of the electronic cloud. In fact, the free energy curves computed by XP-PCM with the in vacuo geometries show a much smaller dependence on pressure (see Figure S4 and Table S4).
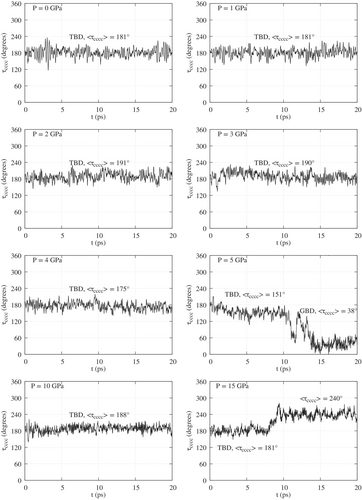
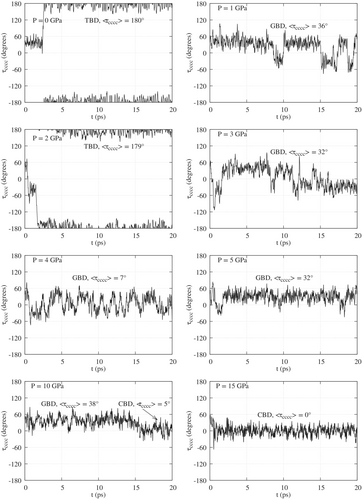
The conformations of butadiene are mainly characterized by the torsion angle . The values of as a function of time are shown in Figures 4 and 5, respectively for simulations starting with TBD and GBD in Ar, at different pressures. Figures S6 and S7 display the same data for a “naked” butadiene molecule. To facilitate the reading of the figures, the symbols TBD, GBD or CBD and the corresponding average values of mark the time intervals where one finds (meta)stable conformations, as detailed in Tables S5–S8. We see that TBD is favored at low pressures and GBD at high pressures, as expected from their relative volumes. GBD can switch frequently between its enantiomers or, at 10 or 15 GPa in argon, stabilize in the intermediate CBD conformation. The TBD GBD interconversion is instead much slower, due to the higher barrier, and occurs once or not at all in the simulations of standard duration (20 ps). In order to observe a statistically significant number of conformational transitions, we ran two much longer simulations (200 ps) for butadiene in argon, starting from either TBD or GBD geometries (Figure S5). We chose the pressure of 5 GPa, whereby we had observed a TBD GBD transition during the first 20 ps. In the simulation starting from TBD we observed eight TBD GBD and seven GBD TBD transitions in 200 ps. On the contrary, the initial GBD conformer did not convert to TBD during the whole simulation (Figure S5). This result shows the important effect of the cage of Ar atoms at high pressures: when the cage is modelled on the flat TBD geometry, 5 GPa is about the pressure that makes the two conformers equally probable. On the contrary, the cage shaped around GBD makes the conversion to TBD much less likely.
Of course, the cage itself can rearrange in response to conformational changes of the hosted molecule, but apparently this event occurs in a still longer time scale at such extreme pressures. The dynamics of fast photoprocesses may also require the disruption of the high pressure cage. However, to really affect the photodynamics, the cage change must occur in a short time, namely before the quenching of excitation and the loss of vibrational energy to the environment have dissipated the energy excess acquired by photon absorption. So, slow cage rearrangements are likely irrelevant to our main goal, that is, to run high pressure simulations of photodynamics.
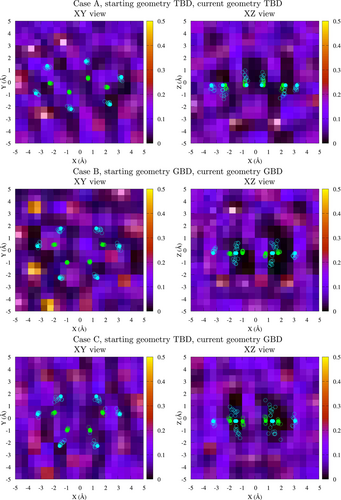
Figure 6 shows three different density maps of Ar atoms at 5 GPa: around TBD in the simulation starting at the TBD geometry (case A); around GBD in the simulation starting at the GBD geometry (case B) and around GBD obtained starting at the TBD geometry (case C). The B and C maps show marked differences: namely, the positions of the Ar atoms in case C are much less defined than in case B, meaning the butadiene molecule is more mobile with respect to the Ar cage. The maps were obtained as projections on two different planes of the densities computed for a cubic box of 10 Å side (see Section S6 for details). The average number of Ar atoms contained in the Å box is 35.95 for TBD (case A), 36.07 for the “native” GBD (case B) and 36.41 for GBD derived from TBD (case C). Since the volume occupied by an argon atom at this pressure can be estimated between 25 and 27 Å, the excluded volume difference between the TBD and GBD at 5 GPa is about 3 and 12 Å for cases B and C, respectively. These differences are much larger than those computed for the isolated molecule (see Table 3), showing that GBD is more compressible than TBD.
In conclusion, the two methods, XP-GAS/R-AM1+LJ and XP-PCM/B3LYP/cc-pVDZ show overall the same trends as to the effect of pressure on the conformational equilibrium between TBD and GBD/CBD. However, at the R-AM1+LJ semiempirical level the conformational equilibrium of butadiene is more sensitive to pressure than at XP-PCM/B3LYP/cc-pVDZ level. In fact, in the latter case we have seen that pressures of the order of 20 GPa are needed to make CBD and TBD about equally stable. Sources of this difference can be that the geometry optimizations performed at XP-PCM level did not consider all the internal coordinates, and possibly an overestimated compressibility of GBD and CBD with respect to TBD, at R-AM1+LJ level. Another minor difference is that both GBD and CBD can be found as relatively stable structures in the XP-GAS simulations, while XP-PCM does not predict a GBD minimum at any of the three pressures investigated. This is in part due to the fact that, even in vacuo, the GBD minimum is much shallower by B3LYP/cc-pVDZ than by R-AM1+LJ.
5.4 Effect of pressure on molecular geometries
As already noted, the compressibility of a single butadiene molecule is mainly due to changes in its internal coordinates. The averages and standard deviations of the latter are listed in Tables S5 and S6 for the simulations of butadiene in argon, and in Tables S7 and S8 for the naked butadiene. The averages were computed for well defined conformations, that is, along time ranges in which the dihedral oscillates around some fixed value. When appropriate, such time ranges are labelled TBD, GBD or CBD in Figures 4, 5, S6 and S7. The averages for the TBD structure were computed with reference to the interval, while for GBD and CBD the interval was (see notes in Tables S6, S7 and S8 for further details). With few exceptions described below, the average structures are symmetric, that is, and . For pressures up to 4 GPa the average of TBD does not deviate by more than 11° from the equilibrium value of 180°. In this range of pressures, the largest deviations from planarity are found for butadiene in Ar, at 2 and 3 GPa (Table S5). At 5 GPa we find , and Figure 6(case A, XZ view) clearly shows that the distorsion is due to the shape of the Ar atoms cage. An even larger distortion () is found at 15 GPa, along with a slightly asymmetric structure (). GBD in most cases, especially at relatively low pressures, has between and (equilibrium value, ). At higher pressures (10 or 15 GPa) we observe three different behaviours: in Ar, starting from the GBD geometry, the symmetric CBD conformation prevails, with low values (see Table S6); the naked butadiene, initially TBD, assumes an asymmetric geometry with or, almost equivalently, 292° (Table S7); and again the naked butadiene, initially GBD, becomes strongly asymmetric and almost flat, with (Table S8).
The dependence of the internal coordinates on pressure is shown in Figure 7, where we plot the time averages listed in Tables S5, S6, S7 and S8. Since most of the structures are symmetric, we plot the averages and instead of the single distances and angles. Under the label TBD, we plot data belonging to conformations with . The label GBD collects conformations with , so including also geometries close to CBD. In few cases we have two values for the same conformer, pressure and environment (with or without Ar), because that conformer was obtained starting from the TBD and from the GBD geometries: in such cases, the averaged coordinates derived from the two simulations are quite close to each other. The XP-PCM results for TBD are also represented in Figure 7 and are in good agreement with the XP-GAS simulations of TBD in argon. TBD, among other molecules, was recently taken as a test case for the eXtended Hydro-static Compression Force Field (X-HCFF) model.18 X-HCFF is based on a relatively simple mechanochemical approach, whereby the pressure is converted into forces acting on the atoms of the sample. The bond lengths obtained by X-HCFF were also in good agreement with the present calculations.
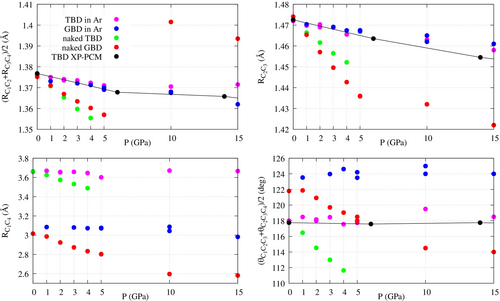
In Figure 7 we see that the C=C and C-C bond lengths decrease regularly with pressure up to 5 GPa. The dependence on pressure is much more marked for naked butadiene than in argon. At higher pressures the presence of more distorted and asymmetric geometries as discussed above makes the progression less regular. The CCC bond angles also decrease with pressure for naked butadiene, producing more compact geometries. On the contrary, for the angles of butadiene in Ar one cannot identify a decreasing trend. By inspecting the density maps of Figure 6, we see that the closest Ar atoms are placed above and below the (approximate) molecular plane and avoid being on top of the C atoms. Given their positions, the Ar atoms, pressed towards the butadiene molecule, can force a bond angle to increase or decrease, mainly depending on whether they are internal or external to the angle in the XY view. The distance, which can be taken as a proxy of the overall length of the molecule, depends mainly on the bond angles rather than on the bond lengths: in fact, it can change much more than the latter and it follows the same trends as the former. Of course, it is also affected by the dihedral, as shown by the large difference in between TBD and GBD.
Overall, the plots of Figure 7 show striking differences between butadiene in Ar and naked butadiene. The latter behaves in a more straightforward way, reducing bond lengths and bond angles so as to decrease the molecular volume. The cage of Ar atoms very effectively reduces the pressure action, in part because of the Ar-Ar repulsive forces that hinder the shrinking of the cage itself. Moreover, depending on their position, some Ar atoms pushing against the molecule tend to open the C-C-C bond angles instead of closing them. These considerations show the importance of introducing a realistic description of the medium in modelling pressure effects by XP-GAS and similar methods.40-43
6 CONCLUSIONS
We present the XP-GAS barostat for extremely high pressures, well suited to run simulations of molecules in different environments, described at MM, QM or QM/MM levels. The XP-GAS approach consists in embedding the molecular sample in a fictitious ideal gas as in previous proposals,40-43 so producing the wanted uniform and constant pressure with good approximation. The major new feature of XP-GAS is the shape of the boundary containing the ideal gas, which is spherical, to guarantee isotropy. The barostat is implemented in the Pisa version of the semiempirical MOPAC package, called MOPAC-PI,47 currently used to run simulations with nonadiabatic trajectories.25-28, 49-51
While the main purpose of the XP-GAS barostat is to investigate the dynamics of photoprocesses at extreme pressures, in this work we tested it by simulating the conformational behaviour of 1,3-butadiene. Two kinds of simulations were run, where the sample subject to extreme pressures was, respectively, a single molecule of “naked” butadiene and the same embedded in a cluster of Ar atoms, as common in nano-anvil experiments. The transitions between the -, - and conformations, as well as the geometry changes induced by pressure, show important differences when comparing naked butadiene with butadiene in argon. We found a good agreement between the time-averaged bond lengths and bond angles computed by XP-GAS simulations of butadiene in argon, and the geometries optimized by the XP-PCM method, put forward by one of us.11-13 Overall, these results show that the XP-GAS QM/MM simulation method is in good agreement with the XP-PCM QM/Continuum model (Cammi model) in describing the effect of the pressure on static properties as the equilibrium geometry of butadiene in the ground state. Furthermore, the comparison of XP-GAS simulations with naked butadiene and butadiene in argon shows the importance, for XP-GAS and related methods,40-43 of a realistic representation of the medium in modelling pressure effects.
ACKNOWLEDGMENTS
We are grateful to Dr. Lorenzo Cupellini for valuable suggestions. This work was supported by grants of the University of Pisa. GG acknowledges funding from CN1, "HPC, Big Data, Quantum Computing", Spoke 6, Multiscale Modeling and Engineering Applications. Open access publishing facilitated by Universita degli Studi di Pisa, as part of the Wiley - CRUI-CARE agreement.
Open Research
DATA AVAILABILITY STATEMENT
The data that support the findings of this study are available within the article and its supplementary material. These data were derived from the following resources available in the public domain: MOPAC-PI package, https://gitlab.com/granucci/mopacpi.


