Platelet microparticles-derived miR-25-3p promotes the hepatocyte proliferation and cell autophagy via reducing B-cell translocation gene 2
Abstract
Platelets are critical regulators of liver regeneration, but the mechanisms are still not fully understood. Platelets have been shown to contain a wide variety of microRNAs (miRNAs) and play an important role in many diseases. However, the mechanism that how the platelet microparticles (PMPs)-derived miRNA regulate the hepatocyte proliferation is not very clear. In this study, we have successfully isolated and identified PMPs. We also found that PMPs, which could be well integrated into the HHL-5 cells, could upregulate the level of miR-25-3p in HHL-5 cells. Meanwhile, we found that PMPs-derived miR-25-3p promoted HHL-5 cells proliferation by accelerating cells into the S phase, and enhanced the autophagy by increasing the LC3II expression and reducing the P62 expression. Then, we proved that the miR-25-3p could target the B-cell translocation gene 2 (BTG2) and downregulate the expression levels of the BTG2 gene in HHL-5 cells. In addition, the overexpression of BTG2 significantly inhibited the proliferation and autophagy abilities of HHL-5 cells, while cotransfected miR-25-3p mimics or PMPs could partially rescue HHL-5 cells proliferation and autophagy. Furthermore, we proved that PMPs accelerated hepatocyte proliferation by regulating autophagy pathways. Therefore, PMPs-derived miR-25-3p promoted HHL-5 cell proliferation and autophagy by targeting BTG2, which may be a new therapeutic method for liver regeneration.
1 INTRODUCTION
The liver is the unique organ of the human body with a remarkable capacity to regenerate1. When attacked by various physical and chemical factors, the residual hepatocytes will soon enter into a complex and orderly regenerative process, so as to restore the function of the liver.2 In the current clinical work, however, both surgeons and physicians are still faced with many cases who die due to insufficient liver regeneration.3 For example, the residual liver tissue of patients with major hepatectomy fails to regenerate to full size and lead to the occurrence of posthepatectomy liver failure,4, 5 liver failure occurs in recipients of live donor liver transplantation due to the small-for-size syndrome,6 and in patients with acute or chronic viral hepatitis, drug-induced liver damage, and alcoholic liver disease due to ineffective liver regeneration.7 The mortality of patients with liver failure remains high, which causes a heavy burden on society and families. Therefore, it has been urgent to explore the mechanism of liver regeneration and provide new therapeutic targets for patients with liver failure.
The regulation mechanism of liver regeneration is sophisticated, involving the interaction between liver parenchymal cells, hepatic sinusoidal endothelial cells, Kupffer cells, lymphocytes, and hepatic stellate cells.8 In recent years, platelets, as anucleate cells, have been demonstrated to play critical roles in liver regeneration.9 Mickael et al10 first discovered that platelet-derived serotonin was involved in the initiation of liver regeneration. Platelet transfusion promoted liver regeneration in mice and rats model with 70% hepatectomy.11, 12 Clinical research confirmed that low immediate postoperative platelet count was an independent risk factor for hepatic insufficiency after major liver resection and was associated with inhibited liver regeneration.13 In live donor liver transplantation, platelet transfusion could promote the postoperative liver regeneration of recipients.14
Although a lot of evidence about platelets promoting liver regeneration has been presented in experimental and clinical studies, the underlying mechanisms responsible for these effects are not fully understood. When activated, platelets can release platelet microparticles (PMPs), containing various microRNAs (miRNAs) derived from platelets, which can act as mediators for the dialogue between platelets and vascular endothelial cells, tumor cells, and liver cells, regulating the proliferation and function of these cells and participating in the pathophysiological processes of various diseases.15, 16 Marc et al17 demonstrated that platelets stimulated hepatocyte proliferation via the internalization of platelets by hepatocytes followed by functional transfer of RNA stored in the anucleate platelets. A previous study has certified that miR-25 could be relatively abundant in human platelets with a content of 3.5% through high-throughput-sequencing techniques.18 However, the effect of platelet-derived miR-25 on hepatocyte regeneration has not been reported.
B-cell translocation gene 2 (BTG2) is the first gene identified in the BTG/Tob family and belongs to the antiproliferative gene family.19 BTG2 gene is involved in many important biological functions of tumor cells, including differentiation, DNA repair, proliferation, and apoptosis of tumor cells. Recent research have shown that BTG2 suppresses the invasion and proliferation of gastric cancer cells.20, 21 In addition, BTG2 overexpression can inhibit the proliferation of lung cancer cells by inhibiting cyclin D1 and matrix metalloproteinases 1 and 2.22, 23 However, the regulatory mechanisms of BTG2 in hepatocyte regeneration remain unclear. In the preliminary experiment, we found that there was a binding site between BTG2 and miR-25-3p while the role of miR-25-3p on BTG2 has not been completely elucidated.
In this study, we investigated the effect of PMPs-derived miR-25-3p on the proliferation of HHL-5 cells and further determined that the BTG2 might bind with miR-25-3p, which inhibited the proliferation of HHL-5 and might regulate the liver regeneration.
2 MATERIALS AND METHODS
2.1 Cell lines and cell culture
HHL-5, obtained from the Cell Bank of the Chinese Academy of Sciences (Shanghai, China), was cultured in Dulbecco's modified Eagle's medium (DMEM) (Gibco, Detroit, MI) medium with addition 10% fetal bovine serum (Hyclone Laboratories Inc) at 37°C with 5% CO2.
2.2 Nanosight analysis
As previous studies have displayed24, 25 that the extractive PMPs were suspended by phosphate-buffered saline (PBS) of the same volume, and PMPs were diluted to the right concentration, and the particle size and quantity of PMPs were confirmed using NanoSight NS300 system (Malvern Instruments Company).
2.3 PMPs isolation and incubation with HHL-5
Blood samples were obtained from healthy participants at the Nanfang Hospital, Southern Medical University (Guangzhou, Guangdong, China). Before the study, written informed consent was acquired from all participants and the project procedure was approved by the Ethics Committee of the Nanfang Hospital, Southern Medical University. PMP rich plasma was obtained by gradient centrifugation and white membrane collection. To isolate PMPs, a PMP-enriched plasma was collected by centrifuged platelets in platelet-rich plasma (PRP) at 3000g at 4°C for 20 minutes. Then, the PMP-enriched plasma was centrifuged again at 100 000g for 1 hour at 4°C in a TL-100 ultracentrifuge (Beckman Coulter). Lastly, PMPs were collected and resuspended in Roswell Park Memorial Institute (RPMI) 1640 medium. PMPs were quantified using a human PMP ELISA Kit (SPBIO, Wuhan, Hubei, China) based on previous research.15
To incubate the PMPs, the HHL-5 cells were seeded on six-well dishes before adding 100 μM clathrin inhibitor for 30 minutes, then treated with 100 μL PMPs (300 μg, 2 × 10⁵ microparticles/well),26 which was labeled with a Dil-C16 fluorescent probe obtained from platelets into each well. After 24 hours, HHL-5 were collected for quantitative reverse transcription-polymerase chain reaction (qRT-PCR) and immunofluorescence detection.
2.4 Experimental design and cell treatment
For the first experimental study: the HHL-5 cells were divided into five groups: negative control (NC), miR-25-3p mimics, miR-25-3p inhibitor, miR-25-3p mimics + PMPs, and miR-25-3p inhibitor + PMPs; for the second experimental study, the HHL-5 cells were also divided into five groups: vector, BTG2, BTG2 + NC, BTG2 + mimics, and BTG2 + PMPs; for the three experimental studies, the HHL-5 cells were also divided into five groups: control, PMPs, autophagy inducer (rapamycin [RAPA], 100 nM), and PMPs + autophagy inhibitor (3-methyladenine [3-MA], 10 mM). For cell transient transfection: normal liver cells HHL-5 were inoculated with a six-well plate (density of approximately 50%), and cultured in DMEM medium containing no serum and antibiotics. MiR-25-3p mimics, miR-25-3p inhibitor, and NC were purchased from GenePharma (Shanghai). The recombinant plasmid pcDNA3.0-BTG2 was purchased from VIPOTION (Guangzhou). The miR-25-3p mimics (50 nm/L), miR-25-3p inhibitor (100 nm/L), and the NC were transfected according to the specific procedures on the Lipofectamine 2000 (Invitrogen) instructions. The pcDNA3.0-BTG2 (500 ng/mL) and the pcDNA3.0-vector were also transfected by using Lipofectamine 2000. After 48 hours, the cells were collected to complete the subsequent experiments. For PMPs treatment: 5 × 10⁴ transfected HHL-5 cells were treated every 24 hours with 300 μg freshly isolated PMPs for 48 hours. In this study, to demonstrate direct enrichment of miR-25-3p in PMPs, platelets were first collected using the Tyrode's buffer, then 1.5 × 10⁸ platelets were transfected with 2.4 nmol miR-25-3p inhibitors by Lipofectamine reagent. And then the production of microsomes was induced by 0.1 U/mL thrombin for 12 hours at 37°C through gentle agitation. PMPs were collected by centrifugation (15 000 g for 90 minutes at 18°C), and the precipitation was resuspended in RPMI 1640 medium.
2.5 RNA extraction and qRT-PCR assay
Total RNA was extracted from the cell by using TRIzol reagent (Invitrogen) following the manufacturer's instruction. For the messenger RNA (mRNA) of BTG2 analysis, complementary DNA (cDNA) was synthesized using the iScript cDNA Synthesis Kit (Bio-Rad, and subjected to qPCR in the CFX96™ Real-Time PCR Detection System (Bio-Rad). The Hairpin-it miRNA qPCR Quantitation Kit (GenePharma, China) was used to analyze the expression of miR-25-3p. Glyceraldehyde-3-phosphate dehydrogenase (GAPDH) and U6 were used as internal controls for BTG2 and miR-25-3p, respectively. The sequences of primers were displayed in Table 1. The relative expression levels of BTG2 and miR-25-3p were calculated via a  method.
| ID | Sequence (5′-3′) | Product length (base pair) |
|---|---|---|
| GAPDH F | TGTTCGTCATGGGTGTGAAC | 154 |
| GAPDH R | ATGGCATGGACTGTGGTCAT | |
| BTG2 F | CCTGTGGGTGGACCCCTAT | 76 |
| BTG2 R | GGCCTCCTCGTACAAGACG | |
| U6 F | CTCGCTTCGGCAGCACA | |
| U6 R | AACGCTTCACGAATTTGCGT | |
| All R | CTCAACTGGTGTCGTGGA | |
| hsa-mir-25 | CATTGCACTTGTCTCGGTCTGA | |
| hsa-mir-25 RT | CTCAACTGGTGTCGTGGAGTCGGCAATTCAGTTGAGTCAGACCG | |
| hsa-mir-25 F | ACACTCCAGCTGGGCATTGCACTTGTCTCG |
- Abbreviations: BTG2, B-cell translocation gene 2; F, forward; GAPDH, glyceraldehyde-3-phosphate dehydrogenase; R, reverse.
2.6 The measurement of absolute quantification
The extractive RNA (2 μL) was identified in 2% agarose gel using electrophoresis. The RNA standard was diluted to a concentration of 10 μM and further diluted to a gradient of 1 μM, 100 nM, 10 nM, 1 nM, 100 pM, 10 pM, and 1 pM to prepare the standard curve. After reverse transcription, qPCR of miR-25-3p was performed as the procedure in qRT-PCR assay. Finally, the absolute quantification of miR-25-3p was calculated based on the copy number.
2.7 Western blot analysis assay
The total HHL-5 cell lysate was prepared in radioimmunoprecipitation assay buffer (Sigma-Aldrich, St. Louis, MO). The concentrations of proteins were confirmed by Coomassie Plus Assay Kit (Pierce, Rockford, IL). The proteins were separated on 12% sodium dodecyl sulfate-polyacrylamide gel electrophoresis and then transferred to polyvinylidene difluoride membranes (Bio-Rad). Then, the membranes were incubated with primary antibody anti-CD63 (1:2000 dilution; Abcam), anti-CD41 (1:2000 dilution; Abcam), anti-BTG2 (1:2000 dilution; Abcam), anti-cyclin A (1:2000 dilution; Abcam), anti-CDK2 (diluted 1:1000; Cell Signaling Technology), anti-p62 (1:2000 dilution; Abcam), anti-LC3B (1:1000 dilution; Abcam), and anti-GAPDH (1:2000 dilution; Abcam) overnight at 4°C. The protein bands were visualized via enhanced chemiluminescence after incubation with corresponding horseradish peroxidase-conjugated secondary antibody. GAPDH protein was used as an internal control.
2.8 Luciferase reporter assay
The luciferase reporter assay was performed to test the direct binding of miR-25-3p to the target gene BTG2. The two position of the 3′-untranslated region (3′-UTR) of BTG gene was PCR amplified. The PCR products were inserted into the psiCHECK2 (Ambion) and confirmed by sequencing. To test the binding specificity, the sequences that interacted with the miR-25-3p were mutated, and the two mutant BTG2 3′-UTR were also inserted into the psiCHECK2 (Ambion). For luciferase reporter assays, HHL-5 cells were cultured in 24-well plates and then lysed 48 hours later after transfection. The cell lysates were collected and added to the luminescence plate. Read the background value with GloMax bioluminescence detector, and add LARII working fluid to read the value. Finally, add the Stop & Glo Reagent for each sample and put it into the light detector, then save the data. The relative activity of luciferase was determined via the Dual-Luciferase Reporter Assay System (Promega) and reported as Renilla Luciferase/Luciferase activity.
2.9 Immunofluorescence assay
The slides coated with the HHL-5 cells were fixed with 4% paraformaldehyde and soaked with 0.5% Triton X-100 (prepared by PBS) at room temperature. Then, the slides were blocked with normal goat serum for 30 minutes. The diluted primary antibody, anti-BTG2 (diluted 1:1000; Cell Signaling Technology), and anti-LC3B (1:1000 dilution; Abcam) were added to each glass slide and incubated at 4°C overnights. The fluorescent secondary antibody was incubated at 20°C to 37°C for 1 hour, 4′,6-diamidino-2-phenylindole (DAPI) was added and incubated in the dark for 5 minutes, and the samples were stained with PBST at 5 minutes for four times to remove the excess DAPI. Dry the liquid on the glass slide with absorbent paper, seal the slide with the sealing liquid containing antifluorescence quenching agent, and observe and collect the images under the fluorescence microscope (Nikon A1R/A1, Japan).
2.10 Cell proliferation assay
A density of 2.0 × 10⁴ transfected HHL-5 cells seeded into each well of 96-well plate. After treatment with PMPs for 24, 48, and 72 hours. The Cell Counting Kit-8 (CCK-8) (Beyotime Biotechnology, Shanghai) in accordance with the manufacturer's protocol was used to detect cell proliferation. Then, the absorbance for each well at a wavelength of 450 nm (optical density value) was detected by using an auto microplate reader.
2.11 Colony formation assay
Plate colony formation assay was used to evaluate the cell colony formation ability. Cells were plated in six-well plates at 1 × 10³ cells per well and incubated for 10 to 14 days. Then, wash the plate gently, and the crystal violet was used to stain the plate. Place the plate under an inverted microscope and observe the number of cell clones.
2.12 5-Ethynyl-2-deoxyuridine analysis
Cells were cultured in 96-well plates at 6 × 10³ cells per well for 48 hours, and then labeled with 50 μM 5-ethynyl-2-deoxyuridine (EdU) labeling medium (RiboBio, Guangzhou). The cells were stained with anti-EdU working solution after treating with 4% paraformaldehyde and 0.5% Triton X-100. Finally, the cell nuclei were labeled by DAPI. The fluorescent microscopy was used to calculate the percentage of EdU-positive cells.
2.13 Cell cycle analysis by flow cytometry
The cells were collected and fixed by ice-cold 70% ethanol for 30 minutes. The cell pellets were resuspended in RNase-containing PBS buffer after washing with ice-cold PBS for three times. Finally, the cells were stained with propidium iodide (Sigma-Aldrich) for 30 minutes in the dark, and then analyzed using a flow cytometer. Cell cycle phases were counted from histograms of linear FL-2 area plots of the singlet gated region thought CellQuest Pro Software (BD Biosciences), and the data were analyzed.
2.14 Statistical analysis
All experiments were repeated at least three times. The data are presented as the mean ± standard deviation. SPSS17.0 and GraphPad Prism 8.0 software was used for statistical analysis. The Student t test was applied to analyze the data between the two groups: one-way analysis of variance with Tukey's post hoc tests were adopted to analyze the data in more than two groups. P < .05 was considered statistically significant.
3 RESULTS
3.1 PMPs promotes proliferation of HHL-5 cells in vitro
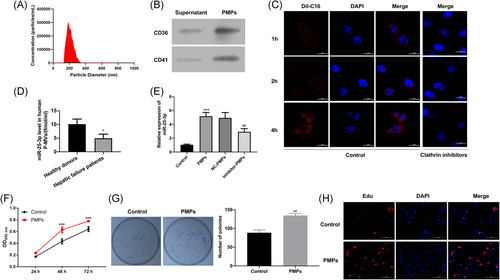
First, we separated PMPs from PRP by centrifugation. The results revealed that the diameter of microparticles was 200 to 400 nm, and the number of microparticles was probably 1.7 × 10⁵ particles/mL (Figure 1A). CD41 is a specific marker of PMPs, and CD63 is expressed in both PMPs and exosomes. In this study, we also analyzed the expressions of CD41 and CD63 in the residual supernatant after centrifugation of PMPs and PMPs. As displayed in Figure 1B, CD41 and CD63 be significantly highly expressed in PMPs, while the levels of CD41 and CD63 were very low in the residual supernatant. Therefore, we have successfully isolated PMPs from PRP (Figure 1B). Second, HHL-5 cells fused with PMPs were detected by immunofluorescence at 1, 2, and 4 hours. The red fluorescence was not obvious at 1 hour, it could be observed at 2 hours and increased at 4 hours. Besides, we discovered that the pretreatment of clathrin inhibitors markedly reduced the red fluorescence at 1, 2, and 4 hours (Figure 1C), which suggested that PMPs are able to enter cells in a short time. In addition, we revealed that the absolute quantification of miR-25-3p was significantly increased in the PMPs of healthy donors compared to the PMPs of hepatic failure patients (Figure 1D). Then, we detected the expression level of miR-25-3p in hepatic cells HHL-5 cultured with or without PMPs. The qRT-PCR result found that the miR-25-3p level was markedly upregulated in HHL-5 cells with PMPs treatment, while PMPs derived from platelets with miR-25-3p inhibitors transfection dramatically downregulated miR-25-3p expression in HHL-5 cells (Figure 1E). Furthermore, to investigate the role of PMPs during the proliferative phase of liver regeneration, we performed CCK-8 to examine the proliferative ability of HHL-5 cells with or without PMPs at 24, 48, and 72 hours. Results showed that the proliferative ability of HHL-5 cells treated with PMPs was increased compared to control (Figure 1F). Meanwhile, the results of colony formation and EdU assays also showed that PMP's treatment could significantly enhance the proliferative ability of HHL-5 cells (Figure 1G,H).
3.2 PMP delivered miR-25-3p promoted proliferation, suppressed cell cycle arrest, and activated autophagy of HHL-5 cells
After miR-25-3p mimics or inhibitor transfection, the HHL-5 cells were treated with PMPs. In our preliminary experiment, we discovered that there was no significant difference for miR-25-3p expression and proliferation in NC mimics and NC inhibitor groups (Figure S1). Therefore, we adopted an NC control group in the following experiments. First, the expression level of miR-25-3p was confirmed in different groups, and results revealed that mimics transfection could upregulate the miR-25-3p expression level, while the inhibitor transfection downregulated the miR-25-3p expression level. However, the miR-25-3p expression was increased when added with PMPs compared to mimics or inhibitor groups (Figure 2A). Next, we performed CCK-8, EdU, and clone-formation assays to explore the impact of miR-25-3p on the proliferation of HHL-5 cells. The data indicated that the proliferation rate of HHL-5 cells with miR-25-3p mimics transfection was dramatically increased in comparison to the cells with NC transfection, while the HHL-5 cells with miR-25-3p inhibitor transfection decreased HHL-5 cells proliferation. However, when added with PMPs, the proliferation rate of HHL-5 cells was increased compared to mimics or inhibitor groups, respectively (Figures 2B-D and 2F). These results suggested that miR-25-3p promotes cell proliferation of HHL-5 cells in vitro, and PMPs could accelerate the proliferation of HHL-5 cells remarkably.
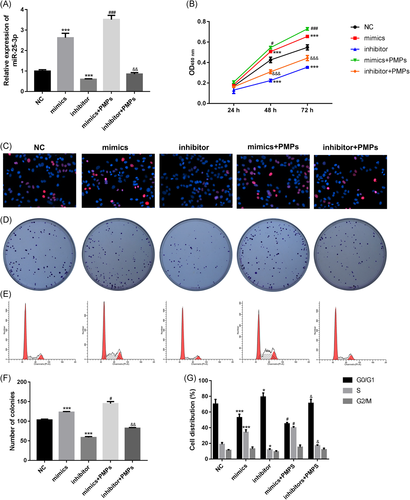
In addition, we performed a flow cytometry assay to survey the role of miR-25-3p on the cell cycle. Compared to NC groups, HHL-5 cells with miR-25-3p mimics transfection induced high percentages of S phase cells, while HHL-5 cells with miR-25-3p inhibitor transfection decreased the percentages of S phase cells; when added with PMPs, the percent of S phase cells were all increased compared to mimics or inhibitor groups, while the percentages of G1 phase cells obtained the opposite results (Figures 2E and 2G), which indicated that miR-25-3p promoted HHL-5 cells regeneration by accelerating cells into S phase, and added PMPs could additionally accelerate HHL-5 cell regeneration.
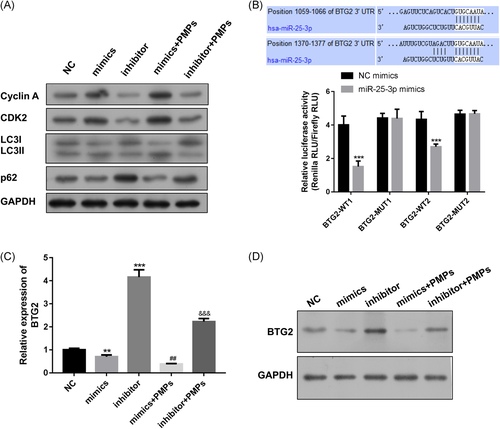
Furthermore, we detected the expression level of cell cycle-related proteins. Western blot revealed that the cyclin A and cyclin-dependent kinases-2 (CDK2) protein, which function in the S phase, was upregulation via transfection with miR-25-3p mimics, while downregulated with miR-25-3p inhibitor, and the addition of PMPs increased the expression levels of cyclin A and CDK2, compared to mimics or inhibitor groups, respectively (Figure 3A). Meanwhile, we measured the expression level of autophagy-related proteins p62 and light chain 3β (LC3B). P62 is degraded by autophagosome-lysosomal fusion, and LC3B is an autophagosome marker. Results showed that overexpression of miR-25-3p in HHL-5 cells inhibited p62 expression but promoted LC3II expression, and knockdown miR-25-3p expression obtained opposite results (Figures 3A and S2A). However, added with PMPs could increase LC3II expression, but decrease p62 expression compared with mimics or inhibitor groups, respectively (Figures 3A and S2A), which suggested that PMPs-derived miR-25-3p might promote HHL-5 cells autophagy in the process of liver regeneration.
3.3 BTG2 could directly bind with miR-25-3p
To identify the target gene of miR-25-3p, we used TargetScan to predict the potential target genes. It revealed that the 3′-UTR of BTG2 contained two potential miR-25-3p-binding. Luciferase reporter assay indicated that miR-25-3p mimics significantly decreased luciferase activity of wild-type 3′-UTRs of BTG2, while the mutant 3′-UTR sequences prevented binding of miR-25-3p have no significant effect on relative luciferase activity (Figure 3B). Next, we detected the mRNA and protein levels of BTG2 in different groups. Result showed that compared to NC groups, HHL-5 cells with miR-25-3p mimics transfection suppressed BTG2 expression, while HHL-5 cells with miR-25-3p inhibitor transfection increased BTG2 expression (Figures 3C,D and S2B), and added PMPs could additionally inhibit BTG2 expression compared to mimics or inhibitor groups, respectively. These results proved that BTG2 is a target for miR-25-3p, and PMPs could inhibit the BTG2 expression.
3.4 BTG2 reversed the effects of PMPs-derived miR-25-3p on cell proliferation, cell cycle, and autophagy of HHL-5 cells
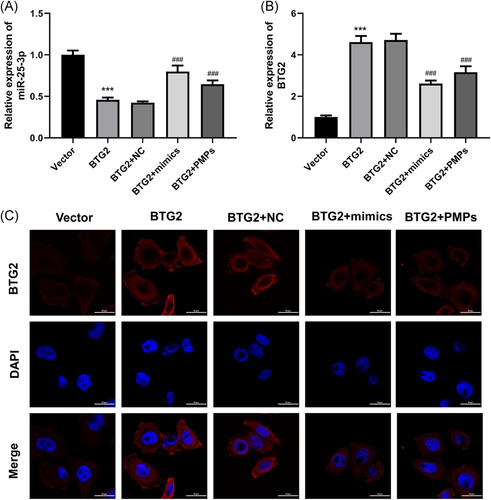
To further evaluate the contribution of BTG2 as a target gene of miR-25-3p in the proliferation of hepatocytes, overexpression of BTG2 was accomplished in HHL-5 cells through the transfection of BTG2 plasmid, then BTG2-overexpressed HHL-5 cells were treated with miR-25-3p mimics or PMPs. Results of qRT-PCR assay suggested that the overexpression of BTG2 dramatically inhibited miR-25-3p expression, this inhibition mediated by BTG2 overexpression could also be reserved by miR-25-3p mimics or PMPs treatment (Figure 4A). Meanwhile, our results revealed that the overexpression of BTG2 signally upregulated BTG2 expression, this upregulation mediated by BTG2 overexpression could also be partly reserved by miR-25-3p mimics or PMPs treatment (Figure 4B). The expression of BTG2 in each group was also detected by immunofluorescence assay, and the same results were obtained (Figure 4C).
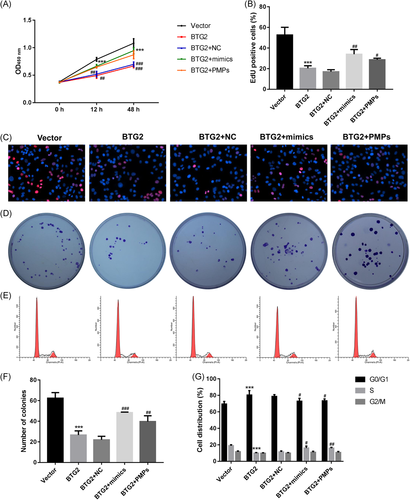
The effect of BTG2 on HHL-5 cell proliferation was also confirmed by CCK-8, EdU, and clone-formation assays. The results revealed that transfected with BTG2 plasmids significantly inhibited proliferation in HHL-5 cells, while treated with miR-25-3p mimics or PMPs could partially rescue HHL-5 cell proliferation (Figures 5A-D and 5F). These results suggested that BTG2 could inhibit HHL-5 cell proliferation induced by miR-25-3p mimic or PMPs. Next, flow cytometric assay suggested that the overexpression of BTG2 inhibited the HHL-5 cells from the G1 phase to the S phase, while the treatment with miR-25-3p mimics or PMPs could partially rescue HHL-5 cells progression (Figures 5E and 5G).
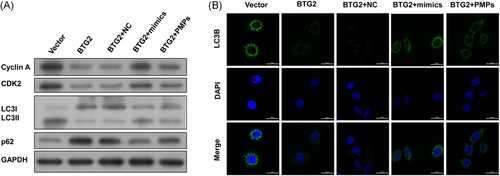
Further Western blot assay was performed to detect the cell cycle-related proteins and got the same results, which indicate that BTG2 inhibited the HHL-5 cell cycle induced by miR-25-3p mimic or PMPs (Figures 6A and S2C). Finally, we detected the expression levels of autophagy-related proteins p62 and LC3B in different groups. Results showed that the overexpression of BTG2 in HHL-5 cells could increase the expression level of p62, but reduced the expression level of LC3II, while cotreated with miR-25-3p mimics or PMPs, the expression levels of p62 and LC3II were partially recovered by PMPs (Figures 6A and S2C). Furthermore, the results of immunofluorescence detection also obtained the same results (Figure 6B), which suggested that BTG2-inhibited HHL-5 cells autophagy. Taken together, these data confirmed that PMPs-derived miR-25-3p promoted proliferation and autophagy of HHL-5 cells by targeting BTG2 in the process of liver regeneration.
3.5 3-MA could attenuate PMPs-mediated proliferation, cell cycle, and autophagy promotions in HHL-5 cells
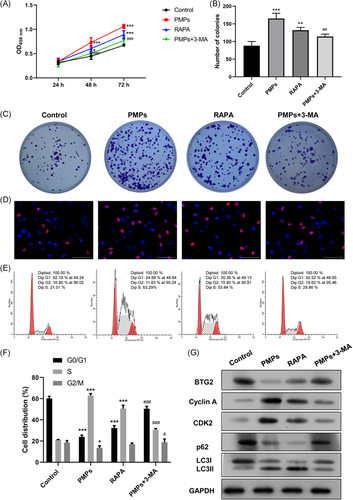
Moreover, we further explored the role of autophagy in PMPs-mediated hepatocyte proliferation. After treatment with PMPs, RAPA, or/and 3-MA, we found that PMPs or RAPA (autophagy inducer) could accelerate hepatocyte proliferation and cell cycle progression of HHL-5 cells, whereas PMPs-mediated proliferation and cell cycle promotion could be markedly reversed by 3-MA (Figure 7A-F). As a result, these findings suggested that 3-MA treatment could reverse the simulative effect of PMPs on HHL-5 cell proliferation. Moreover, to further prove whether autophagy is related to the promoting effect of PMPs on the proliferation of HHL-5 cells on the mechanism, we adopted Western blot analysis to examine the levels of cell cycle and autophagy-related proteins in HHL-5 cells after treatment with PMPs, RAPA, or/and 3-MA. As exhibited in Figures 7G and S2D, PMPs or RAPA prominently reduced BTG2, p62, and LC3I expressions, and notably elevated cyclin A, CDK2, and LC3II expressions, while their expressions mediated by PMPs, could be reversed by 3-MA in HHL-5 cells.
4 DISCUSSION
Hepatocytes are the main proliferating cells in the process of liver regeneration, which are differentiated cells with the ability of regeneration.2, 27, 28 They can proliferate induced by various stimulating factors to compensate liver volume and restore liver function.3, 29 With the in-depth study of the liver regeneration process, it is found that miRNAs are closely linked to liver regeneration.30 In this study, we demonstrated that PMPs-derived miR-25-3p promoted proliferation of HHL-5 cells via targeting the BTG2 gene in vitro.
Platelets contain more than 490 different miRNAs.18 Many studies have confirmed the ability of PMPs to transfer miRNA and downregulate the gene expression in various cell types.31 Liang et al15 demonstrated that platelet-secreted miR-223 could promote the lung cancer cell invasion via targeting tumor suppressor EPB41L3. In addition, a recent study indicated that PMPs-delivered miRNA-Let-7a promoted the angiogenic switch through directly targeting the 3′-UTR of antiangiogenic thrombospondin-1 (THBS-1) mRNA and reducing the production of THBS-1.32 This study revealed the new role of PMP-derived miRNA-Let-7a in promoting angiogenesis and showed for the first time that PMPs could induce angiogenic responses through miRNA regulation of human umbilical vein endothelial cells.32 Gidlöf et al33 demonstrated that miR-320b in PMPs released by activated platelets was absorbed by endothelial cells and inhibited the expression of intercellular adhesion molecule 1. In this study, we found that the PMPs-derived miR-25-3p was upregulated and promoted the proliferation of liver cell lines HHL-5, which is the first study that PMPs-derived miRNAs are related to liver regeneration.
In recent years, much attention has been focused on the relationship between BTG2 and miRNA in human cancer.21 Studies also indicated that miR-21 regulates cell proliferation, invasion, migration, and apoptosis in HepG2 cells, via its effects on the expression of BTG2.34 Recent advances shown that the tumor suppressor gene BTG2 was coregulated by of multiple miRNAs, including miR-21, miR-23a, and miR-27a.21, 23, 35 However, whether miR-25-3p was a binding target of BTG2 in liver regeneration remains unclear. Our results proved that miR-25-3p directly bound to BTG2 in HHL-5 cells suppressed its expression and promoted liver regeneration.
BTG2 is an early transient response gene and the expression of BTG2 can be enhanced by a classical pathway that relies on p53.36 The upregulation of BTG2 could directly inhibit the expression of cyclin D1, cyclin E, and other cell cycle-related proteins, arrested cells in G1 phase, and inhibited cell proliferation.37 Cyclin and CDK are important proteins in the cell cycle regulatory system. Cyclin A is the most important positive regulator of the cell cycle, and it binds to and activates CDK2 activity, initiates the transcription of S- and M-related genes, and promotes the cells from G1 phase to S phase, which accelerates cell proliferation.38 Here, our results also indicated that BTG2 could inhibit the expression of cyclin A and CDK2, thus arrest the cell into G1 phase and restrain the HHL-5 cell proliferation.
In addition, autophagy acts as a vital function in liver regeneration, which utilizes proteins, nucleic acids, and other cellular components to synthesize ATP required for cell proliferation.39 Autophagy initiates and regulates the liver regeneration process through the expression of autophagy-related genes.40 In our study, the protein levels of autophagy marker molecules LC3B and p62 were detected by Western blot, p62 was decreased, but LC3B protein was increased in HHL-5 cells with PMPs group; however, BTG2 gene overexpression obtained the opposite result, so we concluded that PMPs-derived miR-25-3p could activate autophagy and promoted liver cell lines HHL-5 proliferation, which was consistent with previous results. Meanwhile, we demonstrated that autophagy was closely related to the promoting effect of PMPs on the proliferation of HHL-5 cells.
5 CONCLUSION
Taken together, our research suggested that PMPs-derived miR-25-3p might promote HHL-5 cell proliferation and cell autophagy to expedite liver regeneration by targeting the BTG2 gene. The regulation of PMPs-derived miR-25-3p might be an available therapeutic strategy to promote liver regeneration.
ACKNOWLEDGMENT
This study was supported by Guangdong Basic and Applied Basic Research Foundation (2020A1515011343).
CONFLICT OF INTERESTS
The authors declare that there are no conflict of interests.
AUTHOR CONTRIBUTIONS
XX, YX, and JP conceived and designed the study. YX, WL, and GL performed the experiments. XX and YX analyzed the data and wrote the manuscript. All authors had full access to the final version of the report and agreed to the submission.
Open Research
DATA AVAILABILITY STATEMENT
The data used in this study are available from the corresponding author on reasonable request.


