Protein kinase C-α upregulates sodium channel Nav1.9 in nociceptive dorsal root ganglion neurons in an inflammatory arthritis pain model of rat
Qian Bai and Jinping Shao contributed equally to this study.
Abstract
Previous studies have found that increased expression of Nav1.9 and protein kinase C (PKC) contributes to pain hypersensitivity in a couple of inflammatory pain models. Here we want to observe if PKC can regulate the expression of Nav1.9 in dorsal root ganglion (DRG) in rheumatoid arthritis (RA) pain model. A chronic knee joint inflammation model was produced by intra-articular injection of the complete Freund's adjuvant (CFA) in rats. Nociceptive behaviors including mechanical, cold, and heat hyperalgesia were examined. The expression of Nav1.9 and PKCα in DRG was detected by a quantitative polymerase chain reaction, Western blot, and immunofluorescence. The in vitro and in vivo effects of a PKC activator (phorbol 12-myristate 13-acetate [PMA]) and a PKC inhibitor (GF-109203X) on the expression of Nav1.9 were examined. Moreover, the effects of PKC modulators on nociceptive behaviors were studied. Increased mechanical, heat, and cold sensitivity was observed 3 to 14 days after CFA injection. Parallel increases in messenger RNA and protein expression of Nav1.9 and PKCα were found. Immunofluorescence experiments found that Nav1.9 was preferentially colocalized with IB4+DRG neurons in RA rats. In cultured DRG neurons, PMA increased Nav1.9 expression while GF-109203X prevented the effect of PMA. PMA increased Nav1.9 expression in naïve rats while GF-109203X decreased Nav1.9 expression in RA rats. In naïve rats, PMA caused mechanical and cold hyperalgesia. On the other hand, GF-109203X attenuated mechanical and cold hyperalgesia in RA-pain model. Nav1.9 might be upregulated by PKCα in DRG, which contributes to pain hypersensitivity in CFA-induced chronic knee joint inflammation model of RA pain.
Abbreviations
-
- CFA
-
- complete Freund's adjuvant
-
- CWT
-
- cold withdraw threshold
-
- DRG
-
- dorsal root ganglion
-
- HWT
-
- heat withdraw threshold
-
- MWT
-
- mechanical withdraw threshold
-
- PKC
-
- protein kinase C
1 INTRODUCTION
Chronic arthritis pain associated with rheumatoid arthritis (RA) is often intractable and severely decreases the quality of life in patients.1 Majority of studies on chronic knee joint pain have been focused on the molecular mechanisms of cartilage loss. However, chronic knee pain may process independent of cartilage loss, especially when the cartilage loss can not define symptoms and the disability of chronic inflammatory knee joint pain. On the other hand, hyperexcitability of primary sensory neurons resulted from increased expression of excitatory ion channels has been generally accepted as an important cause of chronic knee pain. For instance, it has been reported that increased expression of sodium channel Nav1.8 contributes to hyperexcitability of dorsal root ganglion (DRG) neurons in an intra-articular injection of sodium monoiodoacetate (MIA) osteoarthritis pain model.2, 3 Compared with other sodium channel isoforms, Nav1.9 has preferentially expressed in a subset of nociceptor DRG neurons and mediates a tetrodotoxin-resistant, persistent (TTX-RP) sodium current.4 Moreover, Nav1.9 is involved in both inherited human pain conditions and experimental inflammatory pain models.5-11
Protein kinase C (PKC) is an important regulator of ion channel and membrane excitability in DRG neurons.12 It has been reported that phosphorylated PKC is increased in DRGs of MIA-induced rat joint pain.13 PKC can control Nav1.8-mediated tetrodotoxin-resistant (TTX-R) currents in neonatal nodose ganglion neurons,14 and can also modulate Nav1.9-mediated TTX-RP currents in DRG neurons.15, 16 However, it remains unknown if PKC regulates the expression of Nav1.9 in arthritis pain conditions. In the present study, we studied the expression of Nav1.9 and PKC in DRG using a complete Freund's adjuvant (CFA)-induced RA model of rats.17 We also studied the role of PKC in the regulation of Nav1.9 expression and in the pain behaviors of CFA-RA rats.
2 MATERIALS AND METHODS
2.1 Animal preparations
Male Sprague-Dawley rats weighing 200 to 300 g were obtained from Animal Center of Zhengzhou University. All rats were housed two or one per cage (12-hour light/dark cycle) with free access to water and pellet diet. All experimental protocols were approved by the Animal Care and Use Committee at Zhengzhou University. All procedures were conducted in accordance with the ethical guidelines of the China National Institutes of Health and the International Association for the Study of Pain.
2.2 Intrathecal catheter implantation and drug administration
Rats were anesthetized with 5% isoflurane and then sustained with 3% isoflurane anesthesia. A polyethylene 10 catheter was first placed into the subarachnoid space between the L4 and L5 vertebrae and was further driven by 20 to 25 mm to reach the lumbar enlargement of the spinal cord.18, 19 Animals which exhibited postoperative neurological deficits (eg, paralysis) or poor grooming habits after catheter insertion surgery were excluded. A total of 10 µL of PKC inhibitor GF-109203X (0.73 nmol; Selleck Chemicals)20, 21 was dissolved in 10% dimethyl sulfoxide (DMSO) in saline or 10% DMSO was injected intrathecal followed by an additional 10 µL of saline flush 30 minutes before CFA injection, and every day after CFA injection for 7 days, pain behavioral tests were carried 1 hour after GF-109203X injection on the 7th day. As for PKC activator (phorbol 12-myristate 13-acetate [PMA]) (0.1 nmol, S1819; Beyotime Biotechnology, China)21 or 10% DMSO was injected intrathecally in the naïve group and pain behavioral tests were carried 1 hour after the injection.
2.3 The chronic knee joint inflammation model
Rats were anesthetized with 5% isoflurane, had their knee shaved, and were disinfected with a 10% povidone-iodine solution. Rats were then injected with 150 µL of CFA (1 mg/mL Mycobacterium tuberculosis; Sigma, UK) through the patella tendon into the right knee joint space using a 29-gauge needle (BD Microfine),17, 22 and injected 150 µL of normal saline into the left knee joint space as control. We did nothing for the naïve group.
2.4 Behavioral tests
Mechanical behavioral tests were carried out, as we described previously.23, 24 Briefly, paw withdrawal responses (in rats) were measured by von Frey filaments, and paw withdrawal thresholds were calculated according to a formula provided by Coggeshall et al.25 Paw withdrawal latency to cold was measured by acetone test, latency of flinching or licking responses was recorded, and 40 seconds was set as the cut-off time. The cold response was repeated for three times with a 5-minute interval.26 Paw withdrawal threshold to noxious heat was measured with a model 336 analgesia meter (IITC Inc Life Science Instruments, Woodland Hills, CA) as described previously.23 A cut-off time of 15 seconds was used to avoid tissue damage to the heat.
2.5 Hematoxylin and eosin staining in the sham group and complete Freund's adjuvant group
The serial sections were stained with hematoxylin and eosin (H&E) to observe histological changes in the articular cartilage. On 7th day post-CFA-induced monoarthritis, the knee joint samples were collected, washed in phosphate-buffered saline (PBS), and subject to a standard fixation with 4% paraformaldehyde in 0.1 M PBS for 24 hours at 4°C. Samples were further decalcified with 10% EDTA for 2 weeks,27 dehydrated with a graded ethanol series before subjecting to xylene and embedding in paraffin. Series sections were carried out in frontal, sagittal, and horizontal planes of the embedded samples. Total 4-µm sections were produced and deparaffinized and stained with H&E as described before.27
2.6 Dorsal root ganglion neuronal culture and drug administration
The culture of DRG neurons was carried out as described.28, 29 At 3 weeks of age, all DRGs were dissected out of rats after euthanization with isoflurane. DRGs were then digested by 5 mg/mL dispase and 1 mg/mL type I collagenase in the Hank's Balanced Salt Solution buffer without Ca2+ and Mg2+ (Gibco/Thermo Fisher Scientific). Dispersed cells were obtained in the culture medium and plated in a six-well plate coated with 50 µg/mL poly-d-lysine (Sigma, St Louis, MO). The culture medium is based on Neurobasal Medium (Gibco/Thermo Fisher Scientific), supplemented with 10% fetal bovine serum (JR Scientific, Woodland, CA), and 100 units/mL Penicillin and Streptomycin (Quality Biological, Gaithersburg, MD). The cells were incubated at 95% O2, 5% CO2, and 37°C. One day later, PKC activator (PMA) (1 µM, S1819; Beyotime Biotechnology, China),20, 30, 31 DMSO (final concentration of DMSO was ≤10%; Sigma), and PMA and PKC inhibitor GF-109203X (1 µM, Selleck Chemicals)31 were added to each 2 mL well, respectively. The cells were collected 10 hours after the treatment for further study.
2.7 Quantitative reverse transcription-polymerase chain reaction
For quantitative reverse transcription-polymerase chain reaction (RT-PCR), the TRIzol method (Invitrogen/Thermo Fisher Scientific) was used for the extraction of the total RNA of the rats’ DRGs. The extracted RNA was subjected to DNase I (New England Bio Labs, Ipswich, MA), and then the ThermoScript reverse transcriptase (Invitrogen/Thermo Fisher Scientific) for DNA digestion and reverse transcription, respectively. PCR reactions were conducted using advanced Universal SYBR Green Supermix (Bio-Rad Laboratories, Hercules, CA) in a Bio-Rad CFX96 Real-Time PCR system. Ratio messenger RNA (mRNA) levels of each treatment group to the control group were calculated. Glyceraldehyde 3-phosphate dehydrogenase was used for data normalization.23 The sequences of the following primers: PKCα Forward: 5′-CGTAGGAGTGTCCGTGGA-3′, Reverse: 5′-TCGGAAAACCATGTATCG-3′32; SCN11A Forward: 5′-TCTCCACCCCTACCTCACTG-3′, Reverse: 5′-CGTTCAGCCAAAAACACAGA-3′.33
2.8 Immunohistochemistry
Immunohistochemistry was carried out as described in our previous publications.23, 34 Dissection, postfixation, and dehydration were conducted before frozen section in (20 µm) for L4 DRGs. Sections of DRGs were blocked using 0.01 M PBS that contains 5% goat serum and 0.3% Triton X-100. After 1 hour blocking at room temperature, DRG sections were incubated with the primary antibodies at 4°C overnight. The antibodies include rabbit anti-Nav1.9 (1:200; Alomone Labs, Israel),33 mouse anti-NF200 (1:500; Sigma), mouse anti-IB4 (1:400; Sigma), mouse anti-CGRP (1:200; Abcam, England), and mouse anti-NeuN (1:500; Sigma). A negative control without primary antibodies, or with primary antibodies replaced by the normal mouse or rabbit serum was used. After being incubated with second antibodies for 2 hours at room temperature, the immunofluorescence of the DRG sections was detected by a Leica DMI4000 fluorescence microscope and captured by a DFC365FX camera (Leica, Germany). Neurons with single or double fluorescence labelings were counted manually or automatic using NIH ImageJ Software.
2.9 Western blot analysis
L4 DRGs were homogenized and the cultured cells were ultrasonicated in chilled lysis buffer (10 mM Tris, 1 mM phenylmethylsulfonyl fluoride, 5 mM MgCl2, 5 mM EGTA, 1 mM EDTA, 1 mM DTT, 40 mM leupeptin, and 250 mM sucrose). After centrifugation (15 minutes at 1000g, 4°C), the supernatant was collected to isolate the protein for Nav1.9 detection as we did before.23, 35 As for the membrane protein and cytosolic protein extraction, we used Mem-PER Plus Membrane Protein Extraction Kit (#89842; Thermo Fisher Scientific).36 The protein concentration was detected by the Bio-Rad protein assay, followed by heating the samples at 99°C for 5 minutes before being loaded to the sodium dodecyl sulfate-polyacrylamide gel (Bio-Rad). After protein transfer, the polyvinylidene difluoride membrane (Bio-Rad) were blocked with 3% nonfat milk in Tris-buffered saline containing 0.1% Tween-20 for 1 hour. Primary antibodies used include: rabbit anti-Nav1.9 (1:200; Alomone Labs, Israel),33 mouse anti-PKCα (1:100; Boster, China),37 rabbit anti-β-actin (1:1000; Santa Cruz), rabbit anti-Na+/K+-ATPase (1:1000; Santa Cruz). Anti-mouse or anti-rabbit secondary antibody (1:3000; Jackson ImmunoResearch) conjugated with horseradish peroxidase, western peroxide reagent and luminol/enhancer reagent (Clarity Western ECL Substrate; Bio-Rad), and ChemiDoc XRS and System with Image Lab software (Bio-Rad) were used for detection, visualization, and the explosion of protein. Densitometry using Image Lab software (Bio-Rad) was used for quantification of the blots. All whole protein and cytosolic protein bands were normalized to actin, whereas all membrane proteins were normalized to Na+/K+-ATPase.
2.10 Statistical analysis
Statistical data are presented as means ± SEM. The Student t test was used for the comparison between two groups. One-way or two-way analysis of variance (ANOVA) was used for comparison of multiple groups and/or multiple factors. The significance level was set at P < .05.
3 RESULTS
3.1 Behavioral characteristics of CFA-induced monoarthritis
Joint inflammation pain is characterized by increased nociception. Compared with naïve and saline control, intra-articular CFA induced mechanical, heat and cold hyperalgesia from 3 to 14 days after injection. CFA gradually decreased mechanical withdrawal threshold (MWT) from POD3 to POD14 postinjection (P < .001; two-way ANOVA; Figure 1A). On the other hand, CFA decreased heat withdrawal latency (HWL) (P < .001; two-way ANOVA; Figure 1B) and cold withdrawal latency (CWL) (P < .001; two-way ANOVA; Figure 1C) similarly over POD3 to POD14.
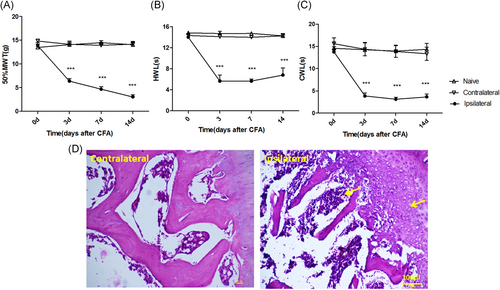
Effects of intra-articular CFA on pain behaviors and joint structure. A, Response threshold to mechanical stimuli in the von Frey test. B, Response latency to radiant heat stimuli (Hargreaves' test). C, Response latency to cold stimuli (acetone test) was strongly decreased at the ipsilateral side (treated with CFA) and was unchanged at the contralateral side (treated with saline) or in naïve animals. Data are expressed as mean ± SEM, n = 6 for each group, two-way repeated-measures ANOVA for behavioral study. ***P < .001 vs CFA group. D, H&E staining of the knee cartilage from the contralateral side (treated with saline) and the ipsilateral side (treated with CFA) (×200) revealed that CFA injection resulted in had an effect on cellularity and cell morphology of articular cartilage and infiltration of inflammatory cells in the knee joint. ANOVA, analysis of variance; CFA, complete Freund's adjuvant; H&E, hematoxylin and eosin; MWT, mechanical withdrawal threshold; HWL, heat withdrawal latency; CWL, cold withdrawal latency
3.2 Histological characteristics of CFA-induced monoarthritis
We chose POD7, the middle time point, for the histological study. Representative H&E staining of the knee cartilage from the contralateral side (saline) and the ipsilateral side (CFA) is shown in Figure 1D. Infiltration of a large number of immune cells (indicated by the yellow arrow) and bone destruction (indicated by the yellow arrow) was found in the ipsilateral side compared with the contralateral side (scale bar: 100 μm; Figure 1D).
3.3 Upregulation of Nav1.9 and protein kinase C in dorsal root ganglion after CFA injection
The total mRNA and protein were extracted from rats without CFA injection (Naïve group) or post-CFA injection different time point (CFA groups). Expression of mRNA and protein of Nav1.9 ( Figure 2A and 2B) and PKC (Figure 2C and 2D) in DRG was assessed by qPCR and western blot analysis, respectively. Compared with the naïve group (mean ± SEM: 1.0 ± 0.09), the expression of SCN11A increased similarly at POD3 (mean ± SEM: 1.84 ± 0.29; P < .05), POD7 (mean ± SEM: 2.24 ± 0.19; P < .01) and POD14 (mean ± SEM: 2.18 ± 0.23; P < .01) (two-way ANOVA; Figure 2A) after CFA injection. However, compared to the naïve group (mean ± SEM: 0.22 ± 0.03), the expression of Nav1.9 protein gradually increased at POD7 (mean ± SEM: 0.44 ± 0.02) and POD14 (mean ± SEM: 0.78 ± 0.03) (P < .001; two-way ANOVA; Figure 2B). There is no difference in protein expression of Nav1.9 among different time points post-CFA injection or between the contralateral side (saline control) and naïve rats (Figure S1). Compared with the naïve group (mean ± SEM: 1.05 ± 0.09), the mRNA expression of PKCα increased similarly at POD3 (mean ± SEM: 1.98 ± 0.19), POD7 (mean ± SEM: 2.04 ± 0.10), and POD14 (mean ± SEM: 1.92 ± 0.39), (P < .05; two-way ANOVA; Figure 2C). Compared with the naïve group (mean ± SEM: 0.39 ± 0.03), the membrane protein expression, but not the cytosolic protein expression of PKCα increased at POD3 (mean ± SEM: 0.88 ± 0.09), POD7 (mean ± SEM: 0.84 ± 0.10), and POD14 (mean ± SEM: 0.74 ± 0.11), (P < .001; two-way ANOVA; n = 4; Figure 2E and 2F). There is no difference in either membrane or cytosolic protein expression of PKCα among different time points post-CFA injection or between the contralateral side (saline control) and naïve rats (Figure S1). Using immunohistochemistry, it was found that compared with the saline group (contralateral side), the expression of Nav1.9 protein increased similarly at POD7 (mean ± SEM: 28 ± 10% vs 78 ± 10%) and POD14 (mean ± SEM: 29 ± 11% vs 82 ± 9%) (scale bar: 100 μm, P < .001; two-way ANOVA; Figure 3A and 3B) after CFA injection.
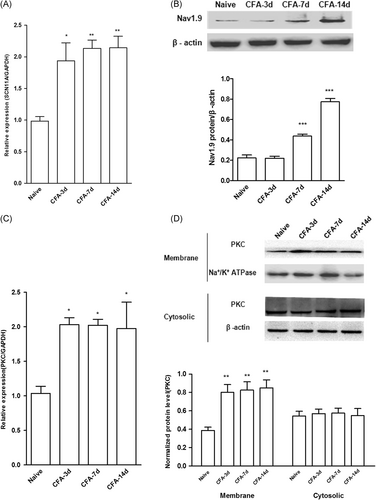
Effects of intra-articular CFA on the expression of Nav1.9 and PKCα in DRG. Tissues were extracted from L4 DRG fromnaïve or CFA rats. A, B, mRNA (A) and protein (B) expression of Nav1.9 was assessed by qPCR and Western blot analysis, respectively. Data are expressed as mean ± SEM (n = 4 for each group, two-way repeated-measures ANOVA. *P < .05, **P < .01, ***P < .001 vs naïve). C, D, mRNA (C) and protein (D) expression of PKCα was assessed by qPCR and Western blot analysis, respectively. Data were expressed as mean ± SEM (n = 4 for each group, two-way repeated-measures ANOVA; *P < .05, **P < .01, ***P < .001 vs naïve). ANOVA, analysis of variance; CFA, complete Freund's adjuvant; DRG, dorsal root ganglion; mRNA, messenger RNA; PKCα, protein kinase Cα; qPCR, quantitative polymerase chain reaction
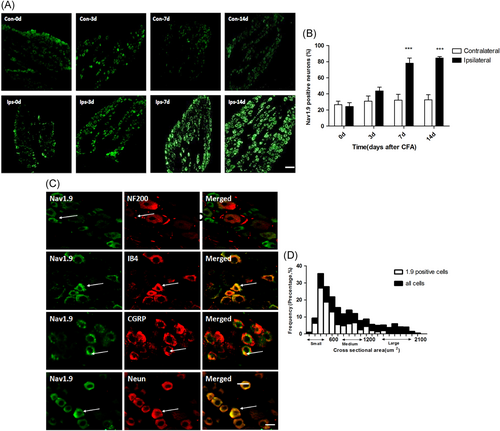
Effects of intra-articular CFA on the expression of Nav1.9 in DRG neurons. A, B, Using immunohistochemistry, it was found that compared with the contralateral side (saline), the expression of Nav1.9 protein at the ipsilateral side (CFA) was increased at POD7 and POD14 (scale bar = 100 μm; P < .001; two-way ANOVA; n = 4). C, Double staining of Nav1.9 with NF200 (top), IB4 (middle-top), CGRP (middle-bottom), and NeuN (bottom). Note that Nav1.9-labeled cells lacked NF-200 signal and that almost all Nav1.9-positive neurons were also positive for IB4. D, Histogram showing that 5.8% of Nav1.9 positive neurons are large, 28.3% medium, and 65.8% small in the L4 DRG on Day 7 post-CFA injection. (Scale bar = 20 μm; n = 4). ANOVA, analysis of variance; CFA, complete Freund's adjuvant; DRG, dorsal root ganglion
3.4 Colocalization of Nav1.9 protein with neuronal markers of DRG in CFA-rheumatoid arthritis rats
Double staining experiments found that Nav1.9 was colocalized with neurons (NeuN) including both IB4+ neurons (a subset of nociceptive neurons), and CGRP+ neurons (peptidergic neurons). In contrast, Nav1.9 was not colocalized with NF200+ neurons (large myelinated non-nociceptive neurons) (Figure 3C). Histogram showing the distribution of Nav1.9 neurons (Figure 3D). Percentages of colocalization between Nav1.9 and neuronal markers were as follows: NF200− (96.9 ± 1.2), IB4+ (89.4 ± 2.3), CGRP+ (38.6 ± 4.7) in the CFA-RA rats (Table 1).
| NF200 (5.8-7.9) | IB4 (50.7-54) | CGRP (34.6-36.3) | Neun (59.3-64.5) | |||||
|---|---|---|---|---|---|---|---|---|
| NA+/NF200+ | NA+/NF200− | NA+/IB4+ | NA+/IB4− | NA+/CGRP+ | NA+/CGRP− | NA+/Neun+ | NA+/Neun− | |
| Nav1.9 | 0 | 96.9 ± 1.2 | 89.4 ± 2.3 | 54.5 ± 2.1 | 38.6 ± 4.7 | 47.1 ± 1.6 | 89.3 ± 2.6 | 1.9 ± 0.4 |
- Note: Numbers in parentheses are mean percentages of the neurons expressing the corresponding protein in all neuronal profiles in four quantified serial sections. x/y means the percentage of x-positive expressing cells in y-positive (+) or y-negative (–) population. Mean ± SD (n = 4). Only IB4-negative small profiles (1000 µm2) were selected.
- Abbreviations: CGRP, calcitonin gene-related peptide; IB4, isolectin B4; NF200, neurofilaments 200.
3.5 PKC contributes to the regulation of Nav1.9 expression
We first investigated whether the mRNA expression of Nav1.9 can be regulated by PKC modulators in cultured DRG neurons. Compared with the DMSO control (mean ± SEM: 1.001 ± 0.05), the expression of SCN11A was increased by PMA (mean ± SEM: 1.64 ± 0.07; P < .05; one-way ANOVA; Figure 4A). Compared with the PMA group (mean ± SEM: 1.64 ± 0.07), the expression of SCN11A was decreased by PMA+GF-109203X (mean ± SEM: 1.06 ± 0.05; P < .05; one-way ANOVA; Figure 4A). A similar pattern of effects of PMA and PMA+GF-109203X was observed on the protein expression of Nav1.9 (Figure 4B). Furthermore, we investigated whether PKC involved in the regulation of Nav1.9 expression in vivo in CFA-RA rats. The effects of PKC inhibitor or activator on Nav1.9 protein expression at 7 days after CFA injection was evaluated by immunofluorescent experiments. The expression of Nav1.9 was increased by PMA in naïve rats (mean ± SEM: 58 ± 6% vs 25.8 ± 4; P < .01); and PKC inhibitor GF-109203X decreased Nav1.9 in CFA rats (mean ± SEM: 46.3 ± 5% vs 84.3 ± 3%; P < .001; one-way ANOVA; Figure 4C). We also studied the protein expression using Western blot. A similar pattern of effects of PMA and CFA+GF-109203X was observed on the protein expression of Nav1.9 (Figure 4D).
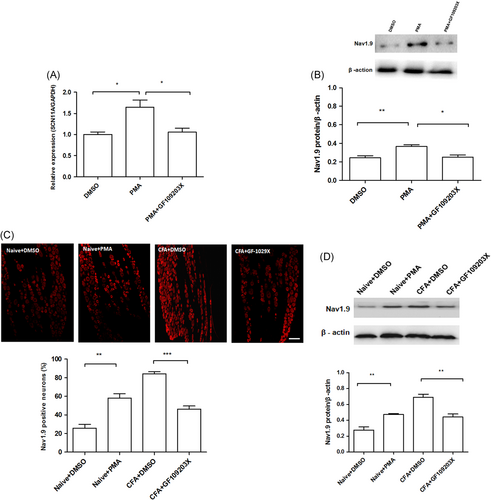
Effects of PKC modulators on the expression of Nav1.9 in vitro and in vivo. The in vitro effects of PKC modulators were tested using cultured DRG neurons. A, Compared with DMSO, the expression of SCN11A was increased by PMA (*P < .05); Compared to the PMA group, the expression of SCN11A was decreased by PMA+GF-109203X (*P < .05). B, Compared with the DMSO group, the protein expression of Nav1.9 was increased in the PMA group (**P < .01); Compared with the PMA group, the expression of Nav1.9 was decreased in the PMA+GF-109203X group (*P < .05). PKC modulators were administrated intrathecally to examine the in vivo effects. C, Immunofluorescent results showed that the expression of Nav1.9 in DRG neurons was increased by PMA in naïve rats (**P < .01) and was decreased by GF-109203X in CFA rats (***P < .001; scale bar = 100 μm). D, Western blot analysis results showed that expression of the Nav1.9 in DRG was increased by PMA in naïve rats (**P < .01) and was decreased by GF-109203X in CFA rats (**P < .01). CFA, complete Freund's adjuvant; DMSO, dimethyl sulfoxide; DRG, dorsal root ganglion; PKC, protein kinase C; PMA, phorbol 12-myristate 13-acetate
3.6 The effects of PKC inhibitor and activator on CFA-induced hyperalgesia
Compared with the control, PMA significantly decreased the MWT (mean ± SEM: 6.86 ± 0.47 g vs 13.45 ± 0.70 g, P < .01) and CWL (mean ± SEM: 6.52 ± 0.21 seconds vs 15.24 ± 1.30 seconds; P < .01). However, PMA did not reduce the HWL significantly (mean ± SEM: 13.73 ± 0.65 seconds vs 8.35 ± 0.79 seconds; P = .75). Compared with the CFA+DMSO group, GF-109203X significantly decreased MWT (mean ± SEM: 7.75 ± 0.47 g vs 2.74 ± 0.43 g; P < .01) and CWL (mean ± SEM: 7.66 ± 0.29 seconds vs 3.96 ± 0.79 seconds; P < .01) in CFA-RA rats. However, GF-109203X did not reduce the HWL significantly (mean ± SEM: 6.63 ± 0.58 seconds vs 5.3 ± 0.99 seconds; P = .754) (one-way ANOVA; Figure 5A-C).

Effects of PKC modulators on CFA-induced monoarthritis hyperalgesia. A-C, PMA significantly decreased MWT (**P < .01) and CWL (**P < .01) in naïve rats; GF-109203X significantly increased MWT (**P < .01) and CWL (**P < .01) in CFA rats (**P < .01). CFA, complete Freund's adjuvant; MWT, mechanical withdrawal threshold; PKC, protein kinase C; PMA, phorbol 12-myristate 13-acetate; HWL, heat withdrawal latency; CWL, cold withdrawal latency
4 DISCUSSION
Chronic knee patients often report pain that is outside the area of knee joint, particularly mechanical allodynia in areas distant to the affected joint.38 In the present study, we found that intra-articular injection of CFA into the rat knee joint produced mechanical and thermal pain hypersensitivity in hind paws. It has been reported that chronic inflammatory knee joint pain can last for more than 2 months.17 In our study, we found that CFA-induced mechanical and thermal hyperalgesia persisted during the whole test period from POD3 to POD14.
Using the RA pain rat model, we found that both mRNA and protein expression of Nav1.9 was increased after CFA injection. However, the increase in mRNA started at POD3, while the increase in protein started at POD6. It is suggested that increased mRNA of Nav1.9 contributes to the increased protein expression of Nav1.9 at POD6 and POD14. It is also suggested that increased protein expression of Nav1.9 might contribute to the pain hyperalgesia at POD6 and POD14 in CFA-RA rats. Compared with Nav1.9, both mRNA and protein expression of PKCα increased from POD3 to POD14. These data suggest that upregulated expression of mRNA contributes to the increased protein expression of PKCα that contributes to the pain hyperalgesia from POD3 to POD14 in CFA-RA rats. Moreover, it is suggested that increased protein expression of PKCα is earlier than that of Nav1.9 after intra-articular CFA injection.
In addition to an earlier increase in PKCα compared with Nav1.9, our in vitro studies found that a PKC agonist (PMA) increased expression of Nav1.9 that was reversed by a PKC antagonist (GF-109203X). Furthermore, in vivo studies found that PMA increased expression of Nav1.9 in control rats, while GF-109203X decreased expression of Nav1.9 in CFA-RA animals. Therefore it is suggested that PKCα contributes to the upregulation of Nav1.9 in DRG neurons following CFA injection. Behavior studies found that PKC activation produced mechanical and thermal hyperalgesia in control rats, while PKC inhibition reduced mechanical and thermal hyperalgesia in CFA-RA animals. These results suggest that increased PKCα contributes to the pain hypersensitivity after CFA injection. Taken together, it is suggested that PKCα contributes to the upregulation of Nav1.9 in DRG neurons that contributes to the pain hyperalgesia in CFA-RA rats.
Immunostaining experiments found that almost all Nav1.9-labeled small cells lacked NF-200 signal, and almost all Nav1.9-positive neurons were positive for IB4 and CGRP (Figure 3C and Table 1). These results were consistent with a former study39, 40 and suggest that increased Nav1.9 might contribute to the increased membrane excitability of nociceptive DRG neurons that directly contributes to the increased pain sensitivity in CFA-RA rats.
5 CONCLUSIONS
Upregulation of Nav1.9, mediated by PKCα, in nociceptive DRG neurons may contribute to the neuronal hyperexcitability of nociceptive nerves, and the generation of chronic pain in the condition of arthritic knee inflammation.
ACKNOWLEDGMENTS
This study was supported by the Henan Science and Technology Department Science and Technology Project (grant number: 182102310450) and the Natural Science Foundation of Henan province (grant number: 182300410387).
CONFLICT OF INTERESTS
The authors declare that there are no conflict of interests.
AUTHOR CONTRIBUTIONS
W-DZ and TD conceived the project and supervised all experiments, they should be considered joint senior authors. QB and J-PS designed the project, these two authors should be considered joint first authors. QB, JC, X-HR, W-HC, and S-XS performed molecular, biochemical, and behavioral experiments. QB analyzed the data and wrote the manuscript. SG provided language help. ZT revised the manuscript. All the authors read, discussed, and approved the manuscript.
ETHICAL APPROVAL
All experimental protocols were approved by the Animal Care and Use Committee at Zhengzhou University. All procedures were conducted in accordance with the ethical guidelines of the China National Institutes of Health and the International Association for the Study of Pain.


