DNA hypomethylation promotes invasion and metastasis of gastric cancer cells by regulating the binding of SP1 to the CDCA3 promoter
Jiawei Yu and Ruheng Hua contributed equally as first authors
Abstract
Background
Cell division cycle associated protein-3 (CDCA3) has been reported frequently upregulated in various cancers. It has been progressively realized that changed DNA methylations occur in diverse carcinomas. However, the concrete involvement of CDCA3 and DNA methylation in gastric cancer (GC) still needs to be further elucidated.
Methods
In this study, quantitative reverse-transcription polymerase chain reaction (PCR) was utilized to determine the relative expressions of CDCA3 in GC and normal tissue samples. The methylation condition of CDCA3 was determined by bisulfite-sequencing PCR (BSP) and methylation-specific PCR (MSP). A chromatin immunoprecipitation (ChIP) assay and luciferase activity assay was used for the interaction between transcription factors and promoters and binding site determination, respectively. The effects of knockdown or overexpression of specificity protein 1 (SP1) or CDCA3 on GC cells in vitro were further assessed via wound healing assay, colony formation assay, and matrigel invasion assay.
Results
In comparison to paired normal tissues, CDCA3 expressions were significantly increased in the GC tissues. The CDCA3 expression was regulated by DNA methylation, with the CpG island hypomethylation responsible for CDCA3 upregulation of GC. ChIP assays verified that the activity of SP1 binding to the CDCA3 promoter was dramatically increased. When the CDCA3 expression was downregulated in MKN45 cells by knockdown SP1, the proliferation ability, healing ability, and invasive ability were significantly suppressed.
Conclusion
The process by which SP1 bound to the nearest promoter region was expedited in GC cells, by which DNA was hypomethylated and CDCA3 expression was promoted. The effect on cell proliferation and invasion by CDCA3 was under the regulation of SP1 and also affected by hypomethylation of DNA.
1 INTRODUCTION
Gastric carcinoma has been ranked second among cancers, and this most frequently lead to deaths and this is the fourth among most commonly seen cancers.1 Diagnosis and therapies have been improved and the expected long-term survivals among early stage patients are satisfactory. However, the prognostic conditions of advanced cases remain undesirable.2-4
It has been progressively realized that altered epigenetics, particularly changed DNA methylations are responsible for various kinds of carcinomas Iacobuzio-Donahue.5-7 The process of inactivating anti-oncogenes, which participates in regulating cell cycles, DNA reparation as well as apoptosis is related to hypermethylated regulatory elements, which prevent transcriptional factors from binding to the corresponding recognition elements.8, 9 Moreover, the methylated CpG context is likely to be responsible for the regulations on gene expressions among various cell types.10 It has been demonstrated by increasing evidence that abnormalities in methylated DNA are closely associated with generation and progression in various human cancers.11, 12
As an indispensable factor for entering mitosis, CDCA3 acts as a constituent part of the SKP1-Cullin RING-Fbox (SCF) ubiquitin ligase (E3) complex and degrades the endogenous cell cycle inhibitor Wee1.13 CDCA3 is regulated transcriptionally in the whole cell cycle and on the translational level in the G1 phase.14 Recent studies have reported that CDCA3 is frequently upregulated in various cancers.17, 18, 39 If CDCA3 is deleted, cells cannot pass through the G2 phase to the M phase, while p21 is upregulated without dependence on p53 and cell aging is induced.15 As a candidate driver involved in cancer progression, we focus here on demonstrating that CDCA3 can be methylation-silenced and that its methylation contributes to epigenetic field cancerization in GCs. We reveal that hypomethylation of CDCA3 affects specificity protein 1 (SP1)-regulated transcription of CDCA3, so as to promote the proliferation of GC cells.
2 MATERIALS AND METHODS
2.1 Tissue samples
We collected specimens of gastric cancerous tissues and contiguous normal tissues of 32 cases, who received excision surgery in the Affiliated Hospital of Nantong University from 2016.12 to 2017.12 without any preoperative radiation or chemical therapies. The tissues were excised and directly put into liquid nitrogen. After freezing, the tissues were preserved under the temperature of–80°C before utilization. All participants were diagnosed with gastric cancer (GC) histologically. We acquired informed written consent from all participants and approval of the protocol in the current study from the ethics committee of the Affiliated Hospital of Nantong University.
2.2 Analyses on methylations of CpG islands in CDCA3
According to the online software (http://www.urogene.org/), one potential CpG island in the vicinity of the transcription start site was predicted. The condition of CpG island sequences of CDCA3 being methylated was determined using bisulfite-sequencing PCR (BSP). The genomic DNA was firstly extracted from tissue samples using a TIANamp Genomic DNA kit (Tiangen, Beijing, China) according to the manufacturer's protocol, and then 1 μg genomic DNA was treated with sodium bisulfite using a EpiTect Bisulfite Kit (Qiagen, Hilden, Germany). About 100 ng DNA samples after bisulfite treatment were utilized for amplifying by PCR. An online program named MethPrimer was utilized to design the particular primers for determining the methylation condition of CpG islands in CDCA3 (http://www.urogene.org/methprimer/). The aim of designing the following primers was amplifying sequences rich in CpG within the CDCA3 promoter: forward 5′-AGGTTTTTTTAAGGGTTTATTTGG-3′ and reverse 5′-CACCATAAAACTTATAATCTCCCAC-3′. The length of the amplified sequence was 228 bp containing 18 CG sites. The conditions of reaction were as below: 95°C for 5 minutes, (95°C for 30 seconds, 58°C for 30 seconds, 72°C for 30 seconds) through 40 cycles and 72°C for 10 minutes. The pMD19-T vector (Takara, Biotechnology, Dalian, China) was connected to the outcomes of BSP and introduced into the DH5α cell line. All clones were subjected to sequencing and analyses.
The methylation band (M) appears if CpG methylation exists in the part subjected to methylation-specific PCR (MSP) analysis while the unmethylated band (U) presents if no methylations exist in CpG sequences. However, at times both of M and U appear if methylations exist in part of the CpG sequences. The designation of primers for MSP analyses on the CDCA3 gene promoter is as below: methylated: forward, 5′-TTTGATTGACGTTAATGAGAAGCGT-3′; reverse, 5′-AAACTCTAAAAATCCCGAAACCGAA-3′; unmethylated: forward, 5′-TTTGATTGATGTTAATGAGAAGTGT-3′; reverse, 5′-AAACTCTAAAAATCCCAAAACCAAA-3′. The length of the amplified sequence was 161 bp. The qPCR condition for methylated primers is the following: 95°C for 10 minutes, followed by 35 cycles of 95°C for 30 seconds, 63°C for 30 seconds, and 72°C for 30 seconds. The final elongation step was conducted for 5 minutes at 72°C. Amplification conditions for unmethylated primers were: 95°C for 10 minutes, followed by 40 cycles of 95°C for 30 seconds, 59°C for 30 seconds and 72°C for 30 seconds. The final elongation step was conducted for 5 minutes at 72°C. MSP products were analyzed on 2% agarose gels. Densitometry was performed on grayscale images using ImageJ (National Institutes of Health, Bethesda, MD).
2.3 Chromatin immunoprecipitation assay
Chromatin immunoprecipitation (ChIP) assays were conducted utilizing an ImprintH Chromatin Immunoprecipitation Kit Sigma (St. Louis, MO) based on instructions provided by the manufacturer. Briefly, the tissues were cut into small pieces, and the protein-DNA complexes cross-linked with 1% formaldehyde (final concentration), followed by nuclear fractionation and DNA shearing via sonication. The anti-SP1 antibody (ab13370; Abcam, Cambridge, UK) was utilized for performing immunoprecipitations and rodent Immunoglobulin G (IgG) was used as the negative control. After the elution of the complex containing DNA, protein and antibody from beads, the cross-link incubation was reversed. The impurities including RNA and protein were removed and pure DNA was utilized for PCR with specially designed primers for the promoter of human CDCA3. The designation of primers was conducted by GeneChem (Shanghai, China) and the sequences are as below: P1-F: 5′-GACAGCAGCGCCTCCTC-3′ and P1-R: 5′-GCTCATTGGACGGGAGG-3′ (111 bp); P2-F: 5′-GGGAATGGGCTTACCGG-3′, and P2-R: 5′-TCATGGCGGAGCTGAGTG-3′ (127 bp); P3-F: 5′-AATGCCCACAGTGCTCCA-3′ and P3-R: 5′-CGAGCACGACTTCCTTCCAT-3′ (213 bp); P4-F: 5′-AAGGCCGACTGCCAGGTT-3′ and P4-R: 5′-CTGCCTTCGTTGCCGTTC-3′ (93 bp). P5-F: 5′-GCATCCTCCGAGAAAGAAAC-3′ and P5-R: 5′-GCGGTTAATAGTCTGGGAGTG-3′ (254 bp). qPCR was used to detect the DNA precipitated by the target antibody. The PCR conditions are as below: 94°C for 10 minutes, followed by 50 cycles of amplification (94°C for 20 seconds, 60°C for 1 minute), 95°C for 2 minutes, 72°C for 1 minute, 95°C for 30 seconds, and 55°C for 10 seconds (repeat 80 times), 30°C for 1 minute. The visualization of ChIP-PCR outcomes was revealed by electrophoresis on 2% agarose gel. Signal intensity measurements were calculated on grayscale images using ImageJ.
2.4 Culturing and transfecting cells
The cell line MKN45 originating from human gastric carcinoma was obtained from the Cell Bank of Chinese Academy of Sciences (Shanghai, China) and cultured in Dulbecco's modified Eagle's medium (DMEM) with a supplement of 10% of fetal bovine serum (FBS; Hyclone, Logan, UT) in a humidified incubator under the condition of 5% of CO2 and 37°C. The transfection was conducted utilizing Lipofectamine 3000 (Invitrogen, Grand Island, NE) on the basis of instructions provided by the manufacturer.
The mammalian expression vector pcDNA3.1 was utilized to clone SP1 cDNA (Invitrogen) and the expression vector pcDNA3.1B containing the full-length open reading frame (ORF) of the human CDCA3 gene was used to generate pcDNA3.1B-CDCA3 (Invitrogen). To inhibit the expression of SP1 and CDCA3, the SP1 siRNA sequence (5′-AUUUGUGAUAAUCUGUUGGdTdT-3′) and CDCA3 siRNA sequence (5′-GGGUACCCAGUUAUCUGUUGAGGAAdTdT-3′) were synthesized by GenePharma (Shanghai, China). The scramble siRNA sequences were 5′-CCAACAGAUUAUCACAAAUdTdT-3′ for SP1 and 5′-UUCUCCGAACGUGUCACGUTT-3′ for CDCA3. Lipofectamine 3000 (Invitrogen) was utilized to transfect cells with siRNA and vector on the basis of instructions provided by the manufacturer. The incubation of cells lasted for 24 hours before experiments.
2.5 Quantitative reverse-transcription PCR
Total RNA was extracted from the tumor tissue and adjacent normal tissue by homogenizing in TRIzol reagent (Invitrogen), and measured quantitatively by using a NanoDrop spectrophotometer (Thermo Fisher Scientific, Asheville, NC). The reverse-transcription step involved use of oligo (dT) primers, and then underwent quantitative real-time PCR on a 7500 PCR instrument (Life Technologies, Carlsbad, CA). The sequences of primers are as below: CDCA3, forward, 5′-AAGGAGGAAGCAAGACAGCC-3′, reverse, 5′-CCTGTCGTAGTGTCAGGGTG-3′; GAPDH, forward, 5′-ACCACAGTCCATGCCATCAC-3′ reverse, 5′-TCCACCACCC TGTTGCTGTA-3′. GAPDH was used as the internal reference to normalize the expressions of CDCA3. A QuantiTect SYBR Green PCR kit (Qiagen) was utilized to perform qPCR and the reaction system contained 12.5 μL of the 2 × SYBR Green PCR Master Mix in each 25-μL volume. The relative quantification method was utilized to calculate fold changes of RNA levels. For analyzing relative expressions, three individual experiments were performed, and triplicate tests were completed for each sample.
2.6 Western blot analysis
Total proteins of cells were extracted with RIPA lysis buffer (Solarbio, Beijing, China) supplemented with protease inhibitor cocktail (Roche Applied Science, San Francisco, CA) on ice. Then ten percent of sodium dodecyl sulfate polyacrylamide gel electrophoresis was used to separate the extracted proteins and the protein dots on gel were subsequently transferred onto the polyvinylidene difluoride membrane. Ten percent of skimmed milk was utilized to block the membrane for 2 hours under ambient conditions before incubation with anti-CDCA3 (ab166902, 1:1000; Abcam, Cambridge, UK), anti-SP1 (ab13370, 1:1000; Abcam) and anti-β-actin (ab8226, 1:5000; Abcam) under the temperature of 4°C night long. The membrane was washed three times with TBST and then subjected to incubation with goat anti-rabbit/mouse IgG secondary antibodies (sc-20045, 1:5000; sc-2005, 1:5000; respectively; Santa Cruz Biotechnology) conjugated with horseradish peroxidase. A chemical agent for enhanced chemiluminescence detection was utilized to detect reaction bands (GE Healthcare, Pittsburgh, Pennsylvania).
2.7 Luciferase activity assays
The promoter sites of CDCA3 gene ranged from −2000 to +500 and situated around the initiation site of transcription with an approximate distance of 2.5 kb. The sequences were amplified by PCR using genome DNA and then conjugated with pGL3-basic promoter vector (Promega, Madison, WI). The sequences of mutated P1 and P3 were 5′-GGCCCCTGCC-3′ and 5′-CGCCCGCACC-3′ respectively, and the sequence of mutated P3 was 5′-GCGGGGACGGGGC-3′. The MKN45 cells were transfected by promoter reporter plasmids of the normal or mutated CDCA3 gene jointly with the basic pRL vector using Lipofectamine 3000 (Invitrogen) to perform luciferase reporter assays. The promoter reporter plasmids of mutated CDCA3 gene were constructed by separately deleting P2, P3 or P5 part of the promoter. Luciferase activities were measured 24 hours after transfection with a Dual-Luciferase Reporter Assay Kit (Promega) according to the manufacturer's protocol. Each experiment was performed in triplicate.
2.8 Wound healing assay
MKN45 cells were seeded in six-well plates at a density of 1 × 10⁶ per well and transfected with SP1 siRNA, scramble siRNA, pcDNA3.1-SP1, or pcDNA3.1. After 24 hours of transfection, a scratch in the cell monolayer was made using a sterile micropipette tip. Cells were washed twice with fresh DMEM, and images were taken using an inverted microscope (IX71; Olympus, Center Valley, PA) at 48 hours after scratching. The rate of wound healing was estimated by measuring the distance between the borders of the wound.
2.9 Colony formation assay
The MKN45 cell line was inoculated into 24-well plates with the density of 5 × 10⁴ per well and transfected by SP1 siRNA, scramble siRNA, pcDNA3.1-SP1 or pcDNA3.1. After 24 hours of transfection, the cells were collected and seeded (1000 per well) in a six-well plate for 2 weeks. Surviving colonies ( > 50 cells per colony) were counted after being fixed with methanol/acetone (1:1) and stained with 5% Gentian Violet (ICM Pharma, Singapore, Singapore). The experiment was carried out in triplicate wells three times.
2.10 Matrigel invasion assay
Transwell chambers, which contained the filter of polycarbonate membrane with the pore diameter of 4 μm and Matrigel coating (BD Biosciences, Franklin lake, NJ) were utilized to determine cell invasion. In brief, the MKN45 cell line was trypsinized, resuspended by 100 μL DMEM without serum and then poured into the upper chamber. The lower chamber was filled with DMEM, which contained 10% of FBS (500 μL) for chemotactic purpose. The cells were cultured for two whole days at 37°C in a humidified incubator containing 5% CO2. Subsequently, the upper noninvasive cells were taken out lightly by cotton buds, and the lower invasive cells were subjected to fixation and coloration using 0.1% gentian violet. After fixation, the invasive cells were quantified and photos of three random fields were taken using an inverted microscope (IX71; Olympus). All of these tests were conducted in triplicate.
2.11 Statistical analysis
Statistical analyses were performed using SPSS version 21.0 (SPSS Inc, Chicago, IL). All the data were presented as the mean ± standard deviation (SD). The Student t test was used to determine the significance of change between two groups. The Mann-Whitney test following Friedman analysis of variance was used for multiple comparisons where appropriate. A P value less than 0.05 was considered to be statistically significant.
3 RESULTS
3.1 CDCA3 was significantly upregulated in GC tissues
To assess the expression of CDCA3 in GC tissues, all 32 GC specimens and the corresponding normal tissues were subjected to quantitative RT-PCR, the outcomes of which indicated that CDCA3 expressions were upregulated among GC specimens in comparison to those of the surrounding normal tissue specimens (P < 0.001; Figure 1). It was revealed that increased CDCA3 expressions was possibly related to GC pathogenesis.
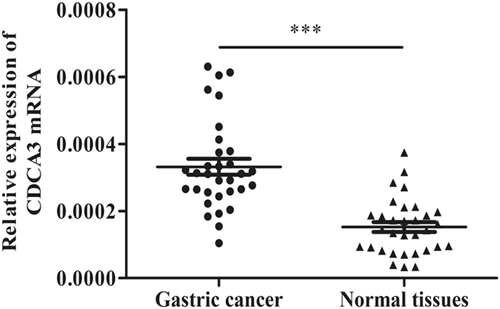
Upregulation of CDCA3 mRNA in GC tissues compared with matched normal tissues. CDCA3, cell division cycle associated protein-3; GC, gastric cancer; mRNA, messenger RNA; ***P < 0.001
3.2 Upregulation of CDCA3 in GC cells is associated with hypomethylation of CpG islands of CDCA3
To identify whether the high expression of CDCA3 in GC was due to DNA demethylation, we used a software (www.urogene.org/) to search for CpG islands in the promoter of the CDCA3 gene from the Human Genome Database, and found one situated from −694 to +355 bp in the vicinity of the transcription start site (Figure 2A). Subsequently, the CpG island methylations of the CDCA3 gene promoter from the above-mentioned 32 GC and the surrounding normal tissue specimens chosen at random were determined utilizing the MSP approach. The levels of methylation among GC specimens were lower than those among the surrounding nontumor specimens (P < 0.05; Figure 2B), which conformed to the high CDCA3 expressions among GC tissue specimens. Typical MSP outcomes of five specimens are also listed in Figure 2B.
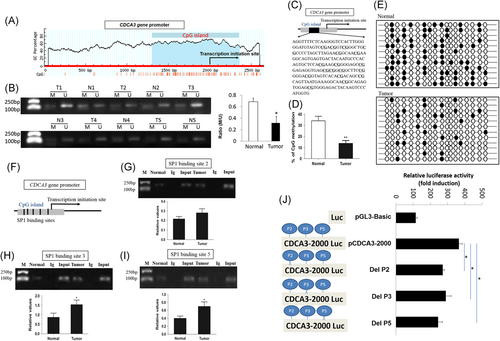
Upregulation of CDCA3 in gastric cancer cells is associated with hypomethylation of CpG islands of CDCA3. A, Schematic illustration of CDCA3 genes. B, Typical MSP outcomes of CDCA3 methylations among GC carcinoma tissue and surrounding normal tissue specimens, the serial number of cases are at the top. U for unmethylated primers; M for methylated primers. C, Eighteen CpG islands in the CDCA3 gene promoter. The arrow displays the NCBI-predicted TSS. D, Proportions of methylated CpG islands in the CDCA3 gene promoter from GC tumors as well as normal surrounding tissue samples. E, DNA methylation condition of CpG islands in the above-mentioned GC was determined through bisulfite sequencing. ●, cytosine residues with methylation; ○, cytosine residues without methylation. F, Schematic illustration of five SP1 binding sites of the CDCA3 gene promoter. G-I, The activity data of SP1 binding to the CDCA3 gene promoter in sites 2, 3, and 5 by ChIP assay. J, The transcription activity by deletion of P2, P3 or P5. Each experiment was conducted in triplet. CDCA3, cell division cycle associated protein-3; ChIP, chromatin immunoprecipitation; GC, gastric cancer; MSP, methylation-specific polymerase chain reaction; SP1, specificity protein 1; *P < 0.05, **P < 0.01
The outcomes of BSP with a length of 228 bp produced by treating genomic DNA with sodium bisulfite were sequenced to more sufficiently verify the methylation condition of the CpG islands of CDCA3 promoter. It was discovered that 18 CpG sites existed in the fragments (Figure 2C; underlined). The sequencing was performed on all of the 32 GC tissue and surrounding nontumor tissue specimens. In CpG sites within the CDCA3 gene promoter in GC tissues and adjacent nontumor normal tissues, the methylation frequency values were 13.89% ± 4.21% and 33.79%± 7.54%, respectively (Figure 2D). The methylation frequencies of the CpG island in the CDCA3 gene promoter of GC tissue specimens were lower than those of the surrounding nontumor tissue samples. Typical outcomes of bisulfite sequencing of the CDCA3 promoter from GC and the surrounding nontumor normal tissues are shown in Figure 2E. These findings suggested that expression of CDCA3 was under the regulation of promoter methylation while the CpG islands in the promoter region of GC was responsible for CDCA3 upregulation.
DNA methylation can regulate transcription by interfering with related transcription factor binding. To investigate the transcriptional factor that may regulate CDCA3 expression, the sequence from the CpG island of CDCA3 gene promoter was analyzed. Five SP1 binding sites (P1: −646 to −637 bp; P2: −407 to −398 bp; P3: −246 to −237 bp; P4: −23 to −8 bp; P5: +43 to +55 bp; Table 1) were predicted within the CDCA3 promoter region by the online software (http://www.gene-regulation.com/pub/programs/alibaba2/index.html). It was verified by ChIP assays that the activity data of SP1 binding to the CDCA3 gene promoter was dramatically increased in sites 3 and 5 (Figure 2H and 2I; *P < 0.05 compared with normal tissues). SP1 binding site 2 (Figure 2G) in tumor tissues were not remarkably increased when compared with adjacent nontumor normal tissues. The predictions of sites 1 and 4 that SP1 bound to did not accord with the ChIP assay outcomes of the current study (data not shown). Nonetheless, it revealed an increase in the extent that SP1 interacted with the CDCA3 promoter in GC tissues.
| SP1 binding site | Position | Sequence |
|---|---|---|
| P1 | −783 to −774 bp | ACCCCGGCCG |
| P2 | −544 to −535 bp | CCGGGGACGG |
| P3 | −383 to −374 bp | GCGGGCGTGG |
| P4 | −160 to −146 bp | AGGGGCATGCGCCGCG |
| P5 | −93 to −82 bp | CGCCCCTGCCCCG |
- Abbreviations: CDCA3, cell division cycle associated protein-3; GC, gastric cancer; SP1, specificity protein 1.
With the aim of understanding the role that P2, P3, and P5 exerted in the transcriptional condition of CDCA3, recombined plasmids which contained mutational and normal CDCA3 promoters were constructed to conduct the luciferase assay. According to test results, the transcriptional level in normal pCDCA3-2000 was increased while those of plasmids constructed with P2, P3, or P5 of the promoter deleted showed a significant reduction in transcriptional levels (Figure 2J). It was suggested that P2, P3, and P5 binding sequences acted as positive elements in the transcriptional regulation of CDCA3.
3.3 The effect of SP1 in the regulation of CDCA3 promoting cell migration, invasion, and clone formation in vitro
To confirm that SP1 is involved in the regulation of CDCA3, we first silenced SP1 expression by RNAi and then upregulated SP1 expression by pcDNA3.1-SP1. After transfection, Western blot analysis showed that the expression of SP1 in the cells transfected with SP siRNA was significantly lower than that of cells transfected with scramble siRNA. In contrast, the expression of SP1 in the cells transfected with pcDNA3.1-SP1 was significantly increased when compared with that of cells transfected with the pcDNA3.1 empty vector. At the same time, CDCA3 was directly silenced by RNAi and upregulated by pcDNA3.1B-CDCA3. As a result, as in Figure 3A, inhibition of SP1 expression can significantly inhibit the expression of CDCA3 protein, while promoting SP1 expression can significantly enhance the expression of CDCA3 protein. However, there is no effect on SP1 expression when slicing or overexpressing CDCA3 (Figure 3B).
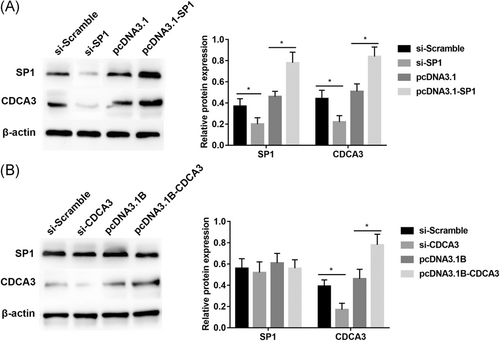
SP1 contributes to the expression of CDCA3. The SP1, CDCA3 protein expression levels in the indicated cells were detected by Western blot analysis. A, The transfection of SP1. B, The transfections of CDCA3. Data are presented as the mean ± SD of three independent experiments. CDCA3, cell division cycle associated protein-3; SD, standard deviation; SP1, specificity protein 1; *P < 0.05
When the expression of CDCA3 protein was downregulated in MKN45 cells by knockdown the expression of SP1, wound healing assays results showed that the healing ability was significantly inhibited (Figure 4A), and the transwell assay showed that the invasive ability was also significantly suppressed (Figure 4C), the cell proliferation ability of cell was significantly inhibited by the clone formation assay (Figure 4B). In contrast, when the CDCA3 expression was increased by the overexpression of SP1, the healing ability, invasive ability and cell proliferation ability was significantly enhanced when compared to those of the control group (Figure 4; *P < 0.05). These findings indicated that SP1 might regulate the expression of CDCA3 to participate in the cellular biology functions of GC cells.
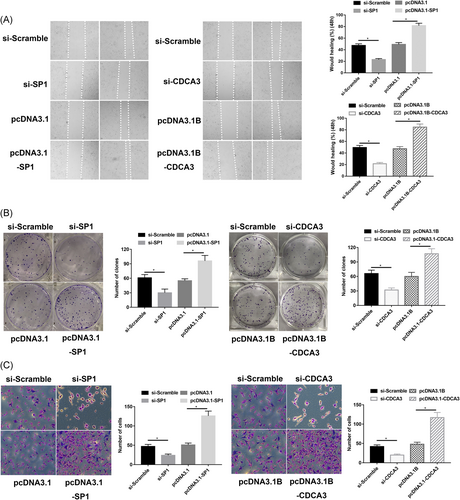
The effect of SP1 in the regulation of CDCA3 promoting cell migration, invasion, and clone formation in vitro. A, Slicing of SP1 or CDCA3 inhibits the healing ability of MNK45 cells. Relative ratio of wound closure per field is shown. B, Slicing of SP1 or CDCA3 inhibits the proliferation ability of MNK45 cells by clone formation. C, Slicing of SP1 or CDCA3 inhibits the invasion ability of MNK45 cells by transwell assay. Data are presented as the mean ± SD of three independent experiments. CDCA3, cell division cycle associated protein-3; SP1, specificity protein 1; *P < 0.05
4 DISCUSSION
DNA methylation is currently a hot research field, and its abnormal changes are often closely related to the occurrence, development, prognosis and clinical efficacy of cancers.19-21 The important regulatory genes have been shown to have altered the DNA methylation level, including phosphatase and the tension protein homologue gene22 and the mouse sarcoma virus oncogene23, 24 and the secretory crimp associated protein gene.25
Methylation of many cancer-related genes was proved in GC tissues, suggesting that methylation is also closely associated with the genesis and development of GC, and is involved in the mechanism of gastric carcinogenesis.26-28 Hypermethylation of the promoter region of the miRNA124a gene was found in GC and is related to tumor differentiation.29 The methylation of p16 is related to the degree of invasion, lymph node metastasis and the distant metastasis of GC.30, 31 Hypermethylation of RUNX3 may be the main cause of inactivation and downregulation of gene transcription, which is closely related to the occurrence and development of GC.32, 33
Abnormal cell cycle regulation will lead to excessive cell proliferation and the development of malignant tumors. Therefore, the study of related factors in cell cycle regulation is of great significance for revealing the occurrence and development of tumors. CDCA3 was shown to be a component of the SCF ubiquitin ligase complex, which regulated the expression level of Wee1, thereby acting as the trigger factor of entering mitosis.34 Controlling the process of the cell cycle exerted an essential role in the proliferation of cells. Elevated CDCA3 expression was significantly observed in GC tissues, and the hypomethylation of CpG islands of CDCA3 was probably responsible for this.
We also carried out related assays to demonstrate the CpG methylations in the CDCA3 gene promoter, suggesting that expression of CDCA3 is regulated by DNA methylation, and that upregulation of CDCA3 in GC is due to hypomethylation of its CpG islands in the promoter region.
As a member of SP family which included various transcriptional factors, SP1 acted as a zinc finger protein, which bound to GpC-rich promoter regions.35 Methylated DNA interrupted the interaction between SP1 and its targets and led to silenced expression of genes. Numerous genes which contained promoters rich in GC, for example, Cadm1,36 Keap1,37 and Ndrg238 were proved to be under the combined regulation of DNA methylation and SP1. Herein, it was initially demonstrated that SP1 acted as a transcriptional factor of CDCA3, and methylated CpG islands in the proximal promoter region of CDCA3 enhanced the binding capacity of SP1, which resulted in the CDCA3 overexpression. Among the five selected binding sequence regions, P2, P3, and P5 are positive regulatory elements for CDCA3 transcription.
SP1 ubiquitously activates transcription and involves in a variety of cellular life activities, which include cell progression and proliferation. Nonetheless, the role that SP1 exerts in human carcinomas is still to be illuminated. It was proposed that SP1 acted as either a promoter39 or repressor40 in the progression and proliferation of cells. Precisely, the complicated roles that SP1 exerted were probably dependent on contexts and under the regulation of interactions with cofactors.40 Due to the fact that CDCA3 acted as a transcription factor of SP1, it was deduced that SP1 probably exerted an essential role in the progression and proliferation activities of GC. Precisely, SP1 was proved to mediate CDCA3 function, which was reflected in the inhibition of cell invasion and migration capacity and promotion of the proliferation of the MKN45 cell line. In the present study, we demonstrated that the expression of CDCA3 protein was downregulated in MKN45 cells by knockdown of the expression of SP1. While direct knockdown or overexpression of CDCA3 had no effect on SP1 expression, the effect on proliferation and invasion in MKN45 cells was similar to the role of SP1.
Conclusively, an innovative regulation mechanism in the functions and expression of CDCA3 in GC cells was depicted in the current study. The hypomethylation of DNA promoted the expression of CDCA3 in gastric cells by inhibiting the interaction between SP1 and the proximal promoter region, which affected the corresponding functions of CDC3A under the regulation of SP1, in other words, suppression of the proliferation and invasion of cells.
ACKNOWLEDGMENTS
This study was supported by the National Natural Science Foundation for Young Scientists (Grant no. 81502053).
CONFLICT OF INTERESTS
The authors declare that there are no conflict of interests.
AUTHOR CONTRIBUTIONS
JY, RH, and YZ carried out the main experiments and statistical analysis and prepared the manuscript. QN designed the study and prepared the manuscript. RH and RT wrote the main protocol and prepared the manuscript. QW and QN supervised the study and prepared the manuscript. All authors contributed to and have approved the final manuscript.


