LC-MS/MS-based metabolic profiling of Escherichia coli under heterologous gene expression stress
Abstract
Escherichia coli is frequently exploited for genetic manipulations and heterologous gene expression studies. We have evaluated the metabolic profile of E. coli strain BL21 (DE3) RIL CodonPlus after genetic modifications and subjecting to the production of recombinant protein. Three genetically variable E. coli cell types were studied, normal cells (susceptible to antibiotics) cultured in simple LB medium, cells harboring ampicillin-resistant plasmid pET21a (+), grown under antibiotic stress, and cells having recombinant plasmid pET21a (+) ligated with bacterial lactate dehydrogenase gene grown under ampicillin and standard isopropyl thiogalactoside (IPTG)-induced gene expression conditions. A total of 592 metabolites were identified through liquid chromatography-mass spectrometry/mass spectrometry analysis, feature and peak detection using XCMS and CAMERA followed by precursor identification by METLIN-based procedures. Overall, 107 metabolites were found differentially regulated among genetically modified cells. Quantitative analysis has shown a significant modulation in DHNA-CoA, p-aminobenzoic acid, and citrulline levels, indicating an alteration in vitamin K, folic acid biosynthesis, and urea cycle of E. coli cells during heterologous gene expression. Modulations in energy metabolites including NADH, AMP, ADP, ATP, carbohydrate, terpenoids, fatty acid metabolites, diadenosine tetraphosphate (Ap4A), and l-carnitine advocate major metabolic rearrangements. Our study provides a broader insight into the metabolic adaptations of bacterial cells during gene manipulation experiments that can be prolonged to improve the yield of heterologous gene products and concomitant production of valuable biomolecules.
1 INTRODUCTION
Escherichia coli is a metabolically versatile microorganism that can grow under the aerobic and anaerobic conditions.1, 2 The major energy sources of this bacterium include C4-dicarboxylates like fumarate, malate, and succinate under all living conditions.3, 4 Metabolic engineering of E. coli has been exploited for the production of several valuable biochemicals, as, for example, succinic acid that is used in food supplements, as ion chelator and an additive in pharmaceutical industry,5, 6 and adipic acid used in the production of nylon and resin.7 Bacterial metabolism has great importance to explore the molecular basis of drug resistance against antibiotics. Highlighting the substances and pathways involved in bacterial viability, metabolic studies can offer some novel targets for hard-to-treat infections. There is an established association of modulations in bacterial metabolism with drug tolerance and sensitivity.8, 9 However, there is a paucity of information about the metabolic profiles of genetically resistant bacterial populations.10 Liquid chromatography-mass spectrometry/mass spectrometry (LC-MS/MS)-based procedures are able to make quantitative and qualitative analysis of multiple small molecules (metabolites) extracted from a living systems.11, 12 However, mass-spectrometric data sets depend on CAMERA for compound spectra extraction and annotation.13, 14 The data need further screening against METLIN database.15 Several genetically modified, nonpathogenic E. coli strains have been used for the production of recombinant proteins.16, 17 These strains are subjected to various optimization conditions to improve the protein yield, folding, and stability.18 The present study was aimed at the profiling of metabolic alterations of E. coli strain BL21 (DE3) RIL CodonPlus after the induction of ampicillin resistance and recombinant protein expression under T7 promoter system. The study was aimed to provide insights into the bacterial metabolism during recombinant protein expression that can be additionally applied for the improvement of protein yield and quality. The information acquired from the proposed study can also provide a baseline for the coproduction of important biochemical substances.
2 MATERIALS AND METHODS
2.1 Materials
The genetically modified cells of E. coli strain BL21 (DE3) RIL were obtained from Novagen (Burlington, MA). Bacterial growth media were purchased from Sigma-Aldrich (Taufkirchen, Germany), plasmid vector pET21a (+) were obtained from Novagen (MERCK), and the gene coding for lactate dehydrogenase was polymerase chain reaction (PCR)-amplified from the genomic DNA of Geobacillus thermodenitrificans DSM-465 (purchased from the Leibniz Institute DSMZ, Braunschweig, Germany). PCR kit, bacterial transformation kit, and restriction enzymes were purchased from Thermo Fisher Scientific. All other chemicals, reagents, and solutions of molecular biology grade were obtained from local and international companies.
2.2 Preparation of bacterial lysates
Three different categories of E. coli BL21 (DE3) RIL cells were prepared for the investigation: first, the normal control E. coli cells (BCT1), second, the cells transformed with pET21a (+) plasmid to acquire ampicillin resistance (BCT3), third, the cells transformed with recombinant plasmid pET21a (+) having ampicillin resistance gene and ligated with lactate dehydrogenase gene from G. thermodenitrificans DSM-465 (BCT2). All the experiments were performed in triplicates. The normal cells were grown in LB broth, and the shaking incubator was adjusted at 37°C, 200 rpm to obtain the optical density of culture up to 1.95 at 600 nm. The second group of cells was grown in the LB broth supplemented with ampicillin (100 µg/mL of medium) to obtain the same final optical density (1.95) of bacterial culture. The third group of cells was grown under the conditions similar to second group of cells except for the addition of 0.5 mM IPTG (isopropyl β-d-1-thiogalactopyranoside), when the optical density of cells was about 1.95 at 600 nm. The cell cultures for all three groups were harvested by centrifugation at 7000g for 5 minutes at 4°C. Supernatant was discarded and the cells were washed twice in phosphate-buffered saline (PBS) saline. Finally, the cells were suspended in PBS and optical density 600 nm was adjusted to assure the equal number of cells per milliliter of sample. The suspended cells were subjected to sonication at moderate power under same conditions and lysate was placed in the ice-box for further use (Table 1).
| Cell types | Growth medium | Inoculum size | Growth time/temperature | Absorbance of final culture at 600 nm/mL |
|---|---|---|---|---|
| Normal (ampicillin susceptible) | LB broth (–) ampicillin | 1% | 8 h at 37°C | 1.95 (8 × 10⁸ cells/mL) |
| Ampicillin resistant, transformed with pET21a (+) plasmid | LB broth (+) ampicillin (100 µg/mL) | 1% | 8 h at 37°C | 1.95 (8 × 10⁸ cells/mL) |
| Genetically modified, transformed with pET21a (+) plasmid harboring bacterial LDH gene | LB broth (+) ampicillin (100 µg/mL) | 1% | 2.5 h at 37°C in medium, followed by 5 h at 37°C in medium 1 plus 0.5 mM IPTG | 1.95 (8 × 10⁸ cells/mL) |
2.3 LC-MS/MS-based metabolomics
The metabolites were extracted from E. coli lysate using a combination of methanol:acetonitrile:water in a ratio of (2:2:1, vol/vol). Ice-cold solvent was added to E. coli lysates in equal volumes, mixture was vortexed for 30 seconds and incubated in for 1 hour at −20°C, followed by centrifugation for 15 minutes at 13000g and 4°C. The supernatant was removed and sample was dried in a vacuum concentrator. The dry extracts were reconstituted in 100 μL of acetonitrile:water (1:1, vol/vol), vortexed and centrifuged as above to remove insoluble debris. The supernatants were subjected to LC-MS/MS analysis. Ten microliters of sample was subjected to HPLC column hypersail gold (150 mm × 4.6 mm, 5 μm) with a flow rate of 0.2 mL/min. The mobile phase consisted of 0.1% formic acid and 99.9% ACN formic acid (0.1%, vol/vol) using a linear gradient where the component of solution was changed from 5% B to 100% B in 90 minutes at a constant flow rate of 0.2 mL/min (95% A from 5% to 30% in 72 minutes, 30% to 100% over 10 minutes, and kept at 100% for 5 minutes at a flow rate of 200 µL/min). The column temperature was maintained at 30°C. LTQ XL linear ion trap instrument (Thermo Fisher Scientific (Waltham, MA), catalog number IQLAAEGAAVFACZMAIK) was used for the investigation. Full scan scope was chosen from 100 to 1000 m/z. The spray voltage was set to −3.0 kV. The capillary voltage was fixed at 4.0 V and the temperature at 270°C. Nitrogen was used as a sheath gas and the flow rate was 40 arbitrary units. Helium was used as the buffer gas. Data processing was carried using Xcalibur software (Waltham, MA).
2.4 Data analysis for bacterial global metabolites
The raw MS data (raw files) were processed using XCMS for feature detection, retention time correction, and alignment. The parameters in XCMS were set as follows: CentWave settings for feature detection (Δm/z = 30 ppm, minimum peak width = 10 seconds, maximum peak width = 120 seconds), mzwid = 0.25, minfrac = 0.5, and bw = 10 for chromatogram alignment. After careful evaluation, retention time alignment was shown not to be required. Isotopic peaks and adducts were detected using CAMERA. The precursor were matched to METLIN at 20 ppm accuracy.
2.5 Assessment of major regulatory pathways
The set of significantly regulated metabolites were used for the assessment of major regulatory metabolic pathways involved to counter the stress induced by ampicillin resistance and recombinant protein expression. The regulated metabolites were considered for their application in the better efficiency of E. coli cell factories in recombinant protein production.
3 RESULTS
3.1 Bacterial growth under normal and stress conditions
The bacterial cells were grown in minimal medium (LB broth), under antibiotic (ampicillin) and exogenous gene transformation stress (used for heterologous protein production) (Table 1). There was no effect of stress conditions on bacterial growth as determined with reference to normal (susceptible cells). It clearly suggests major rearrangements in the level of various metabolites and metabolic pathways in the bacterial population to counter the ampicillin stress and exogenous gene transformation.
3.2 General metabolic profile of E. coli under stress
In the present study, we have evaluated the profile of bacterial metabolites under different stress conditions, that is, ampicillin (BCT3) and ampicillin plus exogenous gene expression (BCT2), with reference to normal (susceptible) bacteria (BCT1). Metabolite profiles of BCT1, BCT2, and BCT3 were studied by LC coupled with tandem mass spectrometry to generate fragmentation patterns and provide metabolite identification. The MS/MS spectra were generated using automated data dependent acquisition, whereby the instrument software Xcaliber continuously evaluated the profile and scanned MS/MS acquisition based on a set of criteria adjusted on instrument settings including acquisition rate, number of precursor candidate ions, collision energy. The total ion current (TIC) and combined mass spectra of three sample categories were determined (Figure 1). Total 592 featured metabolites were identified under the common conditions (Table S1), 107 have shown significant differential regulation (decrease/increase) with P-value ≤ .01. The cloud plot described total 107 features were differentially expressed with P-value ≤ .01 (Figure 2). Quantitative vector scaling normalization have shown that most of the metabolite were close to high significance (Figure 3).
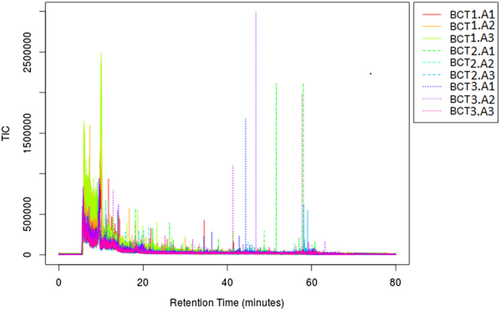
Merged total ion chromatograms of all three samples with respective triplicates. BCT1 (A1-A3) normal control E. coli; BCT2 (A1-A3) Ampr + exogenous gene stress; BCT3 (A1-A3) Ampr only. X-axis represents retention time and Y-axis represents the M/Z value of each metabolite
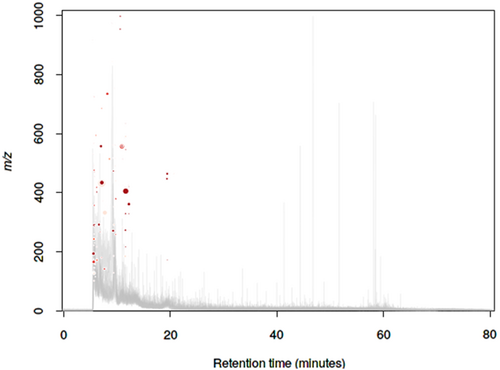
Cloud plot of 107 featured metabolites with P-value ≤ .01 among all three samples. X-axis represents retention time and Y-axis represents the M/Z value of metabolite. Red color indicates the metabolite and color intensity and size explore its amount
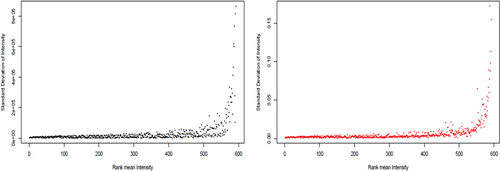
Vector scaling method and unscaled method of combination of samples in triplicate
Level of metabolites under two investigated conditions, that is, BCT1, BCT2, and BCT3 have shown major change in the metabolic profiles. However, we did not found remarkable difference in metabolite levels between the two stress groups (Figure 4), clearly suggesting that two different stress conditions modulate the metabolites almost similarly in E. coli. Further, we performed KEGG pathway analysis through metaboanalyst and found alteration in metabolite levels, which results in significant modulation of major metabolic pathways like inositol phosphate metabolism, galactose metabolism, fatty acid metabolism, starch and glucose metabolism, and valine-leucine metabolism (Figure 5). In addition to this we also noticed significant modulation in metabolites related to streptomycin biosynthesis, suggesting that both stress types alter many pathways that are important for bacterial survival and generating environment for antibacterial resistance in exposed E. coli populations.
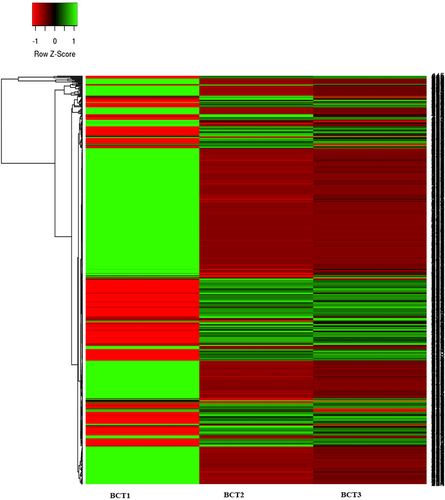
Heat map of differential expression of metabolites. BCT1 (A1-A3) normal control E. coli; BCT2 (A1-A3) Ampr + exogenous gene stress; BCT3 (A1-A3) Ampr only
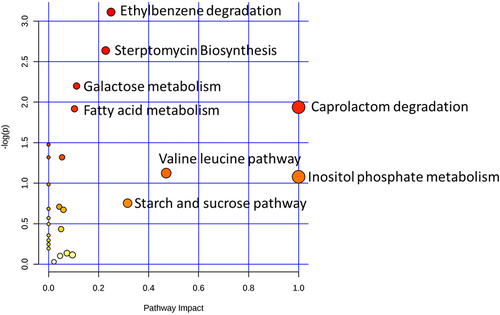
Bacterial metabolite pathway analysis. X-axis represents the impact of the identified metabolites on the indicated pathway. Y-axis indicates the extent to which the designated pathway is enriched in the identified metabolites. All the values were ascertained from MetaboAnalyst. Circle colors (see color scale for reference) indicate pathway enrichment significance. Circle size indicates pathway impact
3.3 Accumulation of 1, 4-dihydroxy-2-naphthoyl–CoA (DHNA)
One of the most significantly increased metabolite in both stressed cell types when compared to normal cells was 1, 4-dihydroxy-2-naphthoyl-CoA (DHNA; m/z 954; retention time 10.6 minutes). DHNA, is a key intermediary rate limiting metabolite for the production of lipid soluble vitamin K. It is synthesized in many bacteria's including E. coli, Mycobacterium tuberculosis, and Staphylococcus aureus. We observed 7.1-fold increase in DHNA levels in both stressed E. coli cell types (Table 2), suggesting an accumulation of DHNA and consequent decrease in vitamin K levels.
| S. no. | Metabolite | m/z | Name | P-value | BCT1 | BCT3 | BCT2 | Regulation |
|---|---|---|---|---|---|---|---|---|
| 1 | M954T11 | 954.1292 | DHNA | 4.66E-05 | 1155.452 | 8300.13 | 8508.88 | Up |
| 2 | M283T11 | 283.3386 | Oleic acid | 0.00024 | 12 132.57 | 20 297.33 | 19 916.45 | Up |
| 3 | M145T6 | 144.967 | Oxoglutaric acid | 0.00091 | 24 425.33 | 61 774.88 | 56 662.87 | Up |
| 4 | M138T6 | 138.0667 | p-Aminobenzoic acid | 0.002444 | 1724.532 | 4711.676 | 3837.389 | Up |
| 5 | M166T6 | 166.1328 | l-Phenylalanine | 0.002537 | 1366.886 | 7492.365 | 6405.902 | Up |
| 6 | M357T6 | 357.4613 | 3-Fluorocatechol | 0.003895 | 7054.261 | 17 388.42 | 17 560.09 | Up |
| 7 | M244T6 | 244.3184 | N-acetylmannosamine | 0.00508 | 17 220.17 | 33 074.68 | 34 885.62 | Up |
| 8 | M290T7 | 290.3336 | Succinic acid semialdehyde | 0.009424 | 21 742.81 | 29 820.11 | 29 667.35 | Up |
| 9 | M432T7 | 432.4459 | N1-acetylspermine | 0.009427 | 119 486.7 | 216 634.2 | 211 298.9 | Up |
| 10 | M917T6 | 917.0394 | Diadenosine pentaphosphate | 0.001514 | 13 125.22 | 249.389 | 160.3432 | Down |
| 11 | M518T9 | 517.7233 | Bisdiphosphoinositol tetrakisphosphate | 0.003872 | 20 223.09 | 869.1238 | 1597.019 | Down |
| 12 | M595T6 | 594.6646 | Citrulline | 0.005021 | 19 787 | 2299.833 | 4689.095 | Down |
| 13 | M230T6 | 230.3359 | 3-Isopropenyl-6-oxoheptanoate | 0.005894 | 66 258.23 | 44 857.77 | 45 787.11 | Down |
| 14 | M517T10 | 516.6737 | l-Asparagine | 0.006572 | 73 010.9 | 18 733.05 | 23 208.17 | Down |
| 15 | M402T10 | 401.5651 | l-Carnitine | 0.009225 | 40 634.39 | 16 077.07 | 16 626.41 | Down |
3.4 Regulation of l-citrulline and urea cycle
In E. coli, the urea cycle is meant for storing excessive nitrogen. The mitochondrial nitrogen reacts with bicarbonates in aqueous cytoplasmic medium to generate carbamoyl phosphate. The later reacts with l-ornithine to produce l-citrulline. l-Citrulline plays a critical role in the l-arginine synthesis using an ATP molecule. Four to eight times decrease in citrulline has been found in both manipulated cell types when compared to normal E. coli bacteria (Table 2). This can be linked to reduced availability of ornithine and arginine important for urea cycle in E. coli.
3.5 Carbohydrate, terpenoids, and fatty acid metabolites
An increase in oxoglutaric acid level was found in the cells under stress (2.52 times; P-value = .00091). This metabolite is considered as a molecule at the intersection of nitrogen and carbon metabolism and acts as a master regulatory metabolite. Similarly, oleic acid plays prominent role in fatty acid pathway. Its retention time was found 11 minutes and it exhibited nearly 1.6-fold increase in E. coli bacteria under ampicillin and gene expression stress (Table 2). In addition to this, we clearly observed a general increase in the levels of carbohydrate associated metabolites under the stress conditions. The level of carbohydrate metabolites including 2,3-diphosphate glycerate, myoinositol, sucrose, galactinol, glucose 1-phosphate, and fucitol was increased. However, decreased level of N-acetyl-α-d-glucosamine was found. The level of campstrol and ketotorulene was also decreased in both E. coli cell types under stress. However, the cellular levels of neoxantine and xanthine were elevated in both stress types (Figure 6).
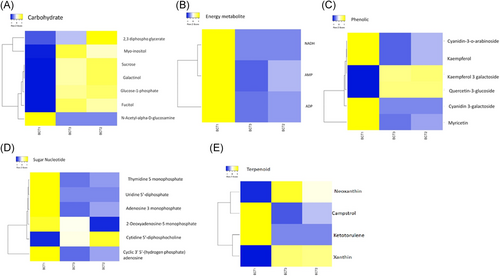
Selected pathway map of differential metabolites for comparative analysis among groups. BCT1 (A1-A3) normal control E. coli; BCT2 (A1-A3) Ampr + exogenous gene stress; BCT3 (A1-A3) Ampr only
3.6 Miscellaneous metabolites
E. coli capable to grow under ampicillin stress indicated considerable modifications in the pattern of many sets of metabolites. Among them, sugar nucleotides like thymidine 5-monophosphate, uridine 5′-diphosphate, adenosine 3 monophosphate, and cyclic 3′5′-(hydrogen phosphate) adenosine were downregulated to variable extent. 2-Deoxyadenosine 5-monophosphate was not affected by ampicillin stress, and it was downregulated during forced gene expression stress (heterologous gene expression). Further, cytidine 5′-diphosphocholine was remained unaffected in the E. coli having ampicillin stress; however, it was considerably up regulated in the E. coli having both stress together. Downregulation of a number of phenolic compounds was found in the ampicillin stress conditions. An increased level of kaempferol 3-galactoside and quercetin 3-glucoside was found. The level of energy metabolites including NADH, AMP, and ADP was decreased in E. coli under ampicillin stress (Figure 6). E. coli having ampicillin stress shows significant up regulation of p-aminobenzoic acid with a retention time is 5.6 minutes and P-value of .002. p-Aminobenzoic acid (pABA) is an intermediate metabolite in the synthesis of folic acid and coenzyme Q (Table 2).
4 DISCUSSION
In bacteria, many factors associated with stress like heat, pH change, antibiotic, and osmotic pressure are altered at multiomics (genomic, proteomic, and metabolomic) to withstand and adapt the stress. Recent studies have clearly shown a dramatic alteration in genes associated with bacterial metabolism during plasmid acquisitions.19, 20 There are reports on metabolic response of the drug resistant and susceptible bacteria to different drugs.21-24 However, there is lack of detailed global information about the metabolic landscape of E. coli, a widely used bacteria, introduced with expression plasmids for recombinant protein production. In the present study, we have evaluated the metabolic changes in E. coli after the induction of ampicillin resistance by transformation of bacterial cells with pET21a (+) plasmid (antibiotic stress) and during the drainage of cellular resources for the heterologous protein expression resulting in physiological stress to the host cells. Variable TIC mass spectra were observed for the cellular lysates indicating specific set of metabolites. Total 592 characteristic metabolites were identified, regulation of 107 of them was significantly altered among E. coli cells engineered for drug resistance and gene expression. One of the top modulated metabolite was DHNA in both stressed cell types when compared to normal E. coli bacteria. It is an important intermediate in the vitamin K synthesis pathway. DHNA-CoA (an intermediate) accumulation in the E. coli cells clearly suggest an inhibition of DHNA-CoA thioesterase, attenuating the pathway further for vitamin K synthesis. It is suggested from our results that cells growing under stress may have reduced their vitamin K synthesis as a survival strategy, as the presence of vitamin K enhances the antibiotic drug activity widely by enhancing membrane permeabilization mechanism. However, it needs further experiments to support our hypothesis. Another important energy regulator coenzyme Q, showed dramatic increase (approximately sevenfold) in cells under stress conditions.
l-Citrulline is an important intermediate metabolite of E. coli urea cycle. The pathway is also involved in the l-arginine synthesis. Up to eight times decrease in the level of l-citrulline suggests an elevated synthesis and concomitant utilization of l-arginine in E. coli cells under stress. According to the literature, biosynthesis of arginine is elevated under limited nutrients or stressed conditions.25 Our results show 2.52 times increase in oxoglutarate concentration among the ampicillin-resistant cells. Oxoglutarate is the common regulatory metabolite for carbon and nitrogen metabolism. It accumulates in E. coli cells when there is a limitation of nitrogen supply while the carbon-downshift results in the decrease of oxoglutarate levels.26 Under nitrogen limitation, it directly blocks glucose uptake by inhibiting enzyme I, the first step of the phosphotransferase system. This enables rapid modulation of glycolytic flux without making considerable changes in the concentration of glycolytic intermediates by simultaneously accelerating glucose import and consumption of the terminal glycolytic intermediate phosphor-enol-pyruvate.27 It has been also suggested that oxoglutarate accumulation in E. coli is associated with detoxification of poisonous substances causing oxidative stress.28 A significant increment in the carbohydrate pathway associated metabolites was found in the conditions where bacteria possess antibiotic resistance in our study. Similar observations were made by other investigators.29-32 We suggest that the alterations in carbohydrate metabolism were used to promote antibiotic stress-resisting events in bacterial cells.
5 CONCLUSION
In conclusion, we provide a global landscape of E. coli metabolites subjected to genetic modifications, antibiotics in the medium and exposed to heterologous gene expression stress under T7 promoter system. Understanding of E. coli adaptations to the changing stress conditions is fundamental to microbial engineering aimed to modulate conditions for enhancing the outcome of engineered microbial cells. These metabolomic adaptations also provide a baseline for the understanding of microbial resistance to drugs, leading to the identification of potential metabolic targets to fight against drug resistance in bacteria.
ACKNOWLEDGMENT
The authors are grateful to the Deanship of Scientific Research (DSR) at King Abdulaziz University, Jeddah, Kingdom of Saudi Arabia for the funding of this project.
CONFLICT OF INTERESTS
The authors declare that there are no conflict of interests.
AUTHOR CONTRIBUTIONS
MSN, HZC, and MIK conceived and designed the study. MSN, FA, and BNM maintained bacterial culture and performed assays for bacterial growth. MR, MAZ, ARS, and MIK performed and analyzed LC/MS-MS data and wrote the article. MR, FAA, and FA analyzed the data and proofread the manuscript.
DATA AVAILABILITY
All the data are either used in the manuscript, provided as the supplementary material or available with Mohammad I. Khan (corresponding author 1)


