New Potential Biomarker Proteins for Alcoholic Liver Disease Identified by a Comparative Proteomics Approach
ABSTRACT
Chronic alcohol consumption causes hepatic steatosis, which is characterized by a considerable increase in free fatty acid (FFA) and triglyceride levels. To identify the possible proteins involved in the progression to alcoholic hepatosteatosis, we performed proteomic analysis on livers of mice exposed to alcohol. 2D-based proteomic analysis revealed that EtOH exposure in mice changed the expression of 43 proteins compared with that in mice fed a normal diet (ND). The most notable protein changes were proteins involved in Met metabolism and oxidative stress, most of which were significantly downregulated in alcohol-exposed animals. Although non-alcoholic fatty liver disease (NAFLD) and alcoholic liver disease (ALD) seem to share the same molecular processes, the difference between these conditions is still unclear. To address this question, we explored the features of alcoholic hepatosteatosis that were different compared with those of methionine and choline deficient (MCD) diet-induced mice with nonalcoholic liver damage. Although most of the differentially expressed proteins associated with ALD did not significantly differ from those of NAFLD, nine proteins showed considerably different patterns. Of these, ornithine aminotransferase, vitamin D binding protein, and phosphatidylethanolamine-binding protein were considerably upregulated in ALD mice, compared to that in NAFLD and ND mice. However, other proteins including inorganic pyrophosphatase were differentially regulated in MCD mice; however, they did not differ significantly between the alcoholic model and ND control mice. These results suggested that the identified proteins might be useful candidate markers to differentiate ALD from NAFLD. J. Cell. Biochem. 118: 1189–1200, 2017. © 2016 Wiley Periodicals, Inc.
Abbreviations
-
- ALD
-
- alcoholic liver disease
-
- NAFLD
-
- non alcoholic fatty liver disease
-
- ND
-
- normal diet
-
- MCD
-
- diet methionine and choline deficient diet
Alcoholic liver disease (ALD) ranges from alcoholic steatosis to alcoholic steatohepatitis, which may cause progressive fibrosis and cirrhosis [Gao and Bataller, 2011]. ALD and non-alcoholic fatty liver disease (NAFLD) have a similar pathogenesis and histopathology but different etiology and epidemiology [Scaglioni et al., 2012]. Both ALD and NAFLD are characterized by excessive fat accumulation in the liver and inflammation; however, the conditions that cause liver steatosis to progress to hepatitis are presently unknown.
Ethanol is metabolized by alcohol dehydrogenases (ADH) to form acetaldehyde, and then by aldehyde dehydrogenases to form acetate, with the subsequent formation of acetyl-CoA. Acetaldehyde is highly reactive, toxic, and immunogenic and high levels resulting from excessive ethanol consumption can damage cellular proteins and DNA [Niemela et al., 1991; Tuma et al., 1996; Conduah Birt et al., 1998; Bootorabi et al., 2008; Yu et al., 2010]. Ethanol metabolism reduces the NAD/NADH ratio within the cytosol and mitochondria, which promotes steatosis by stimulating the synthesis of fatty acids and inhibiting their oxidation [Nagy, 2004; Zeng and Xie, 2009]. Emerging evidence suggests that steatosis and oxidative stress are the central pathological factors in ALD development [Ambade and Mandrekar, 2012]. Hepatosteatosis is the result of an imbalance between hepatic lipid synthesis and breakdown [Kawano and Cohen, 2013]. Lipid synthesis is regulated by the upregulation of lipogenic genes through the induction of sterol regulatory element binding protein C (SREBP1c), whereas lipid oxidation is regulated via the downregulation of peroxisome proliferator-activated receptor-alpha (PPAR-α) [Kersten et al., 1999; Repa et al., 2000].
Hepatic lipid oxidation in mitochondria, peroxisomes, and the endoplasmic reticulum may lead to increased generation of reactive oxygen species (ROS) which results in extensive injury to liver cells. Chronic alcohol consumption can induce the microsomal enzyme cytochrome P450 2E1 (CYP2E1), a major contributor to ethanol-induced ROS production in the liver. Accumulation of ROS may lead to lipid peroxidation of cellular membranes; antioxidant depletion also causes oxidative stress [Masini et al., 1994]. Oxidative stress can be attributed to the activation of nuclear factor receptor kappa B (NF-κB) [Li and Karin, 1999; Kratsovnik et al., 2005], that controls the synthesis of inflammatory mediators such as tumor necrosis factor alpha (TNF-α) and other pro-inflammatory cytokines. Another major consequence is endoplasmic reticulum (ER) stress resulting from impaired one-carbon metabolism. Prolonged ethanol exposure affects pathways that catalyze the remethylation of homocysteine into methionine in the liver methionine metabolic pathway [Tsuchiya et al., 2012]. Elevated hepatic homocysteine levels result in ER stress by causing misfolding of ER proteins and promoting necroinflammation. Thus, these processes seem to be an important hepatotoxicity mechanism in both NAFLD and ALD [Henkel and Green, 2013].
To increase our understanding of the ALD mechanism, we characterized changes in the liver proteome that occur during the progression to alcoholic steatohepatitis. Proteomics is useful for elucidating pathological mechanisms and discovering disease markers for chronic liver diseases. The most commonly used biomarkers for ALD are alanine aminotransferase, aspartate aminotransferase, and γ-glutamyltranspeptidase. However, these enzyme activities are not strictly limited to ALD and these markers may be elevated in other liver disorders. Thus, it is clear that identifying more valid biomarkers is necessary. The great advantage of proteome analysis is that the identified proteins themselves are good candidates as diagnostic markers. Although several studies have shown independent proteomic data from NAFLD or ALD separately, little direct comparative proteomic analysis between them exists yet. Therefore, the ultimate aim of the current study was to identify specific biomarkers of liver disease induced by alcohol exposure. Here, we report a search for proteins that are differentially regulated in alcohol-exposed mice and a comparison with results from animals with the nonalcoholic liver disease.
MATERIALS AND METHODS
ANIMALS
We purchased Male C57BL/6J mice from Orient Bio, Inc. (Seoul, Korea). All animals were taken care as previously described [Lee et al., 2015]. In the normal diet (ND) group (n = 6), animals were treated with the standard diet for 12 weeks. In the EtOH group (n = 6), animals were fed 5% w/v alcohol in Lieber-DeCarli liquid diet for 6 weeks.
2DE GEL ELECTROPHORESIS
Two-dimensional electrophoresis was performed using an established procedure [Kang et al., 2006; Chang et al., 2008]. In the first dimension, 400 µg of protein from liver tissue lysate was loaded to 24 cm IPG strip (pH 4–7 linear gradient strips, Amersham Biosciences), which was rehydrated in an EttanIPGphor Isoelectric Focusing (IEF) System. After rehydrated, the strips were focused and equilibrated as previously described [Park et al., 2011]. For the second dimension of electrophoresis, the IPG strip was transferred onto a 12% SDS gel for SDS–PAGE and run at about 120 V using an EttanDALTsix Large Vertical System (Amersham Biosciences). Gel staining was performed as described by Kang et al. [2009]. For ensuring the reproducibility of the observed changes in protein expression, experiments were performed in three pools of two independent liver samples of ND or EtOH-fed mice. Each group was run in duplicate. For the differential analysis, statistical significance was determined with the Student's t-test. Values of P < 0.05 were considered significant.
IN-GEL DIGESTION AND MALDI-TOF ANALYSIS
For identifying the protein in interesting spots, the protein analysis was performed according to a previously described procedure [Kang et al., 2009]. Briefly, the excised gels were subjected to in-gel digested with trypsin, excised gel pieces were washed in 25 mM NH4HCO3/50% acetonitrile, vacuum dried, and digested overnight at 37°C. After digested, samples were prepared for MALDI-TOF analysis as described in our previous study [Kang et al., 2006]. In short, the supernatants were dried in a vacuum centrifuge and the extract was dissolved in 0.5% trifluoroacetic acid (TFA), and concentrated and desalted using a C18ZipTip (Millipore, Billerica, MA), according to the manufacturer's protocol, then spotted onto the steel MALDI plate. For MALDI-TOF analysis, a 4700 Proteomics Analyzer mass spectrometer (Applied Biosystems, Foster City, CA) was operated in positive-ion reflectron mode for MS and 1 kV positive-ion mode without collision gas for MS/MS. Mass spectra were obtained from each sample spot using 500 shots per spectrum. Search parameters were a precursor mass tolerance of 30 ppm for MS, and 0.7 Da for MS/MS was allowed. Also, up to two missed cleavage sites were allowed; oxidation of methionine was set as a variable modification and carboxyamidomethylation of cysteine as a fixed modification. MALDI-TOF data analyzed using MASCOT software (Matrix Science, London, UK) with mouse protein sequences in Swiss-Prot (2016/05) and NCBI non-redundant databases. In addition, proteins were classified into molecular functions using the Panther Classification System (www.pantherdb.org).
WESTERN BLOTTING
The tissue lysates were loaded and separated by 12% SDS-PAGE. Separated proteins were transferred onto PVDF membranes (Millipore, Billerica, MA), blocked with 5% nonfat dry milk, and probed with the appropriate primary antibody at 4°C overnight. Antibodies against α-SMA (1:1000, Epitomics, Burlingame, CA), cytochrome P450 2E1 (CYP2E1, 1:1000, Cell Signaling Technology Inc., Beverly, MA), formimidoyltransferase-cyclodeaminase (FTCD, 1:1000, Santa Cruz, CA), S-adenosylmethionine synthase (SAHH, 1:1000, Santa Cruz, CA), phosphatidylethanolamine-binding protein (PEBP, 1:2000, Abcam, Cambrige, MA), ornithine aminotransferase 1 (OAT-1, 1:2000, Abcam, Cambrige, MA), Vitamin D binding protein (VDBP, 1:2000, Thermo Fisher, Rockford, IL), and inorganic pyrophosphatase 1 (PPA1, 1:2000, Thermo Fisher, Rockford, IL) were used. The anti-GAPDH antibody (1:1000, Santa Cruz, CA) was used as a loading control.
QUANTITATIVE REVERSE TRANSCRIPTION POLYMERASE CHAIN REACTION
Quantitative Real-time (RT) PCR analysis was performed using an established procedure [Lee et al., 2013]. Total RNA was extracted using QIAGEN extraction kits and reverse transcription using SuperScript III RNase H-(Invitrogen). Quantitative RT-PCR was performed using SYBR Green I and a LightCycler (Roche Diagnostics, Castle Hill, Australia). For normalized gene expression, 18S was used as references genes in all qRT-PCR. Table S1 shows the primers used for RT-PCR analysis.
IMMUNOHISTOCHEMISTRY
Immunostaining was performed following an established procedure [Lee et al., 2015]. For histological analysis, liver sections were stained with hematoxylin-eosin (H&E). For IHC analysis, the sections were incubated with primary antibodies of F4/80 (dilution 1:500; Serotec, Oxford, UK), α-SMA (1:200), 4-hydroxy-2,3-(E)-nonenal (4-HNE, 1:200, Millipore, Billerica, MA), and CYP2E (1:200). Peroxidase activity was determined using DAB substrate, slides were counterstained with Hematoxylin (Sigma Chemical, St. Louis, MO), then dehydrated and mounted in Safemount embedding medium (Labonord, France).
STATISTICAL ANALYSIS
All results are presented as means ± SD of the indicated number of measurements. All results were considered significance statistically when P was less than 0.05.
RESULTS
HEPATIC STEATOSIS AND INFLAMMATION IN MICE FED EtOH
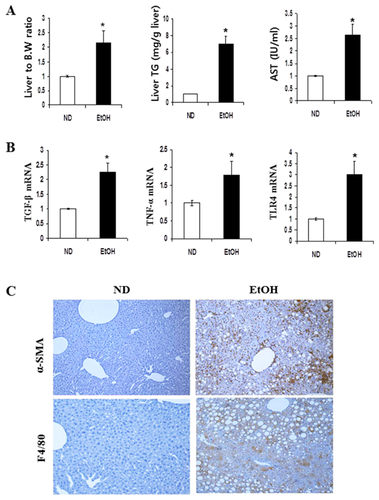
Feeding mice with EtOH-induced substantial fat accumulation in liver tissue. The ratio of liver to body weight was significantly increased in mice fed ethanol compared with those seen in ND control mice (Fig. 1A). Hepatic triglyceride (TG) levels in EtOH-fed mice were significantly increased compared with TG levels seen in ND mice. A substantial increase was observed in serum AST levels of EtOH mice compared with levels seen in ND animals. To determine the effects of EtOH on steatohepatitis progression, a qRT-PCR analysis was performed for liver homogenates (Fig. 1B). The hepatic mRNA expression levels of inflammatory genes, such as TGFβ1, TNFα, and TLR4 were significantly increased in mice fed EtOH. Also, α-SMA and F4/80 positive cells in hepatic tissues were examined by immunohistochemistry as shown in Figure 1C. A significant increase in levels of α-SMA and F4/80 was observed in the EtOH-fed mice in compared to that in ND-fed mice. α-SMA is a unique marker for activated stellate cells and myofibroblasts, whereas F4/80 is a macrophage marker.
PROTEOMIC PROFILE OF 2-DE IMAGES OF EtOH-INDUCED MICE LIVER
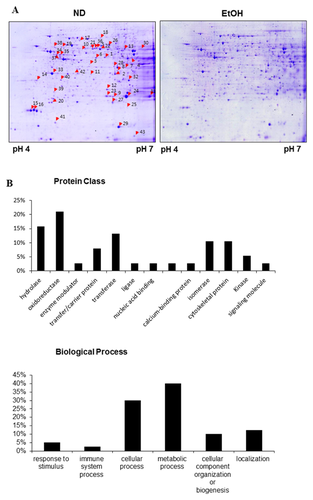
For differential proteomic analysis, the soluble proteins from liver tissues were separated by pH gradient for the first dimension, and then resolved and detected using high-resolution 2-DE followed by Coomassie Blue staining. Gel images were analyzed with Image Master Platinum 7.0 software. Protein spots significantly altered upon EtOH feeding are marked by arrows with numbers (Fig. 2A). Protein spots from the preparative gels were subjected to in-gel tryptic digestion and MALDI-TOF analysis. Thus, proteins that revealed obvious differences (more than a 1.5-fold change) in quantity were successfully identified. Table I lists the most strongly differentially expressed proteins. The numbers indicated on the gels correspond to the numbers given in the table. The differentially expressed proteins were grouped and classified regarding of their protein class and biological function (Fig. 2B). A close examination of the list of differentially expressed proteins showed that a majority of these proteins are involved in metabolic processes and detoxification/oxidative stress. These results suggest that the differentially expressed proteins disturbed metabolic homeostasis and hepatocellular oxidative stress in hepatosteatosis.
| Noa | Identified protein | Accession no. | M.W (KDa) | PI | MOWSE scoreb | Coverage (%)c | Fold change |
|---|---|---|---|---|---|---|---|
| ETOH | |||||||
| Metabolism | |||||||
| 1 | Ornithine aminotransferase, mitochondrial | P29758 | 48.4 | 6.2 | 2.15e + 9 | 55.1 | 2.0 |
| 2 | Malate dehydrogenase, cytoplasmic | P14152 | 36.5 | 6.2 | 1304 | 23.4 | 0.5 |
| 3 | Aspartate aminotransferase, cytoplasmic | P05201 | 46.2 | 6.7 | 100,196 | 17.7 | 1.5 |
| 4 | Acyl-coenzyme A thioesterase2, mitochondrial | Q9QYR9 | 49.7 | 6.0 | 2.82e + 7 | 26.5 | 1.5 |
| 5 | Formimidoyltransferase-cyclodeaminase | Q91XD4 | 58.9 | 5.8 | 83,282 | 30.9 | 0.5 |
| 6 | Adenosine kinase | P55264 | 40.1 | 5.8 | 1.05e + 6 | 37.1 | 0.6 |
| 7 | Fructose-1, 6-bisphosphatase 1 | Q9QXD6 | 36.9 | 6.1 | 1.23e + 6 | 44.7 | 1.5 |
| 8 | PCTP-like protein | Q9JMD3 | 33.0 | 6.7 | 36,911 | 33.3 | 0.6 |
| 9 | Anhydrolase domain-containing protein 14B | Q8VCR7 | 22.5 | 5.8 | 9169 | 42.4 | 0.4 |
| 10 | Glutathione synthetase | P51855 | 52.2 | 5.6 | 73,657 | 24.1 | 2.5 |
| 11 | Ketohexokinase | P97328 | 32.8 | 5.8 | 2322 | 25.8 | 2.6 |
| 12 | Indolethylamine N-methyltransferase | P40936 | 29.5 | 6.0 | 5.81e + 6 | 42.8 | 0.4 |
| 13 | Isocitrate dehydrogenase [NAD] alpha, mitochondrial | Q9D6R2 | 39.6 | 6.3 | 104 | 10.9 | 0.4 |
| 14 | Annexin A5 | P48036 | 35.8 | 4.8 | 22,728 | 7.3 | 3.5 |
| Transport | |||||||
| 15/16 | Major urinary proteins 11 and 8 (Fragment) | P04938 | 17.6 | 4.9 | 617,597 | 66.2 | 0.3 |
| 17/18 | Serum albumin | P07724 | 68.7 | 5.7 | 1.39e + 10 | 41.0 | 2.0 |
| 19 | Vitamin D-binding protein | P21614 | 53.6 | 5.4 | 2.19e + 6 | 29.8 | 2.0 |
| 20 | Phosphatidylethanolamine-binding protein 1 | P70296 | 20.8 | 5.2 | 2448 | 25.8 | 1.5 |
| 21/22 | Selenium-binding protein 2 | Q63836 | 52.6 | 5.8 | 2.83e + 11 | 53.2 | 0.3 |
| Detoxification processes | |||||||
| 23/24 | Peroxiredoxin-6 | O08709 | 26.3 | 6.2 | 2350 | 18.5 | 0.2 |
| 25 | Peroxiredoxin-1 | Q9D6L8 | 18.1 | 6.3 | 282 | 27.3 | 3.2 |
| 26 | Epoxide hydrolase 2 | P34914 | 62.5 | 5.9 | 1.32e + 11 | 48.2 | 0.6 |
| 27 | Glutathione peroxidase 1 | P11352 | 22.3 | 6.7 | 130,647 | 41.8 | 0.5 |
| 28 | Dihydrodiol dehydrogenase | Q9DBB8 | 36.3 | 6.0 | 13,018 | 27.0 | 0.5 |
| 29 | Superoxide dismutase | P08228 | 15.9 | 6.0 | 1996 | 41.6 | 0.6 |
| 30 | Aldehyde dehydrogenase X, mitochondrial | Q9CZS1 | 57.6 | 6.6 | 2.34e + 7 | 33.5 | 3.5 |
| 31 | Glutathione S-transferase P1 | P19157 | 23.6 | 7.7 | 4.83e + 6 | 42.4 | 0.4 |
| 32 | 3-hydroxyanthranilate 3,4-dioxygenase | Q78JT3 | 32.8 | 6.1 | 9.05e + 9 | 74.5 | 0.4 |
| 33 | Regucalcin | Q64374 | 33.4 | 5.2 | 1.31e + 7 | 53.5 | 0.6 |
| Structural Proteins | |||||||
| 34/35 | Keratin, type I cytoskeletal 18 | P05784 | 47.5 | 5.2 | 2.73e + 6 | 32.2 | 1.5 |
| 36 | Keratin, type II cytoskeletal 8 | P11679 | 54.6 | 5.2 | 20,500 | 25.7 | 2.5 |
| 37 | Actin-related protein T1 | Q9D9J3 | 42.2 | 5.2 | 107 | 16.8 | 2.0 |
| 38 | Vimentin | P20152 | 53.7 | 5.1 | 178 | 15.5 | 2.5 |
| 39 | Rho GDP-dissociation inhibitor 1 | Q99PT1 | 23.4 | 5.1 | 2545 | 41.7 | 2.0 |
| Others | |||||||
| 40 | Phenazine biosynthesis like domain containing protein2 | Q9CXN7 | 33.4 | 5.2 | 3.83e + 6 | 17.1 | 0.5 |
| 41 | Eukaryotic translation initiation factor 5A-1 | Q6EWQ7 | 16.8 | 5.1 | 3706 | 40.3 | 0.6 |
| 42 | Putative deoxyribonuclease TATDN1 | Q6P8M1 | 33.4 | 5.8 | 4026 | 21.4 | 1.6 |
| 43 | Histidine triad nucleotide-binding protein 1 | P70349 | 13.8 | 6.4 | 15,430 | 57.9 | 0.4 |
- a Spot numbering as shown in 2-DE gel in Figure 2.
- b Protein score from MS/MS by MS-FIT.
- c Sequence coverage identified from MS/MS data.
VALIDATION OF ONE-CARBON METABOLIC PROTEINS AND ANTIOXIDANT PROTEINS
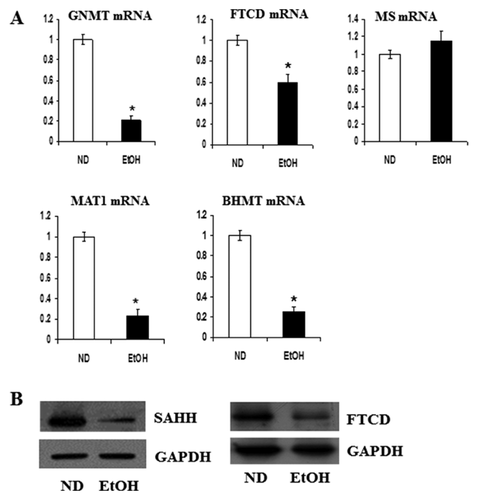
In order to determine whether the changes in protein level are consistent with changes in gene expression, mRNA contents were compared with proteomic results. In particular, genes involved in one-carbon metabolism were investigated. Among the metabolic proteins identified in Table I, most proteins involved in the methionine cycle, such as glycine N-methyltransferase (GNMT), FTCD, methionine adenosyltransferase-1 (MAT1), and betaine-homocysteine S-methyltransferase (BHMT) were down-regulated in EtOH-fed mice. The mRNA levels were measured by RT-PCR (Fig. 3A). Moreover, protein expression of SAHH and FTCD were down-regulated in EtOH-fed mice (Figs. 3B and S1). However, MS mRNA levels were not different between EtOH-fed mice and ND mice.
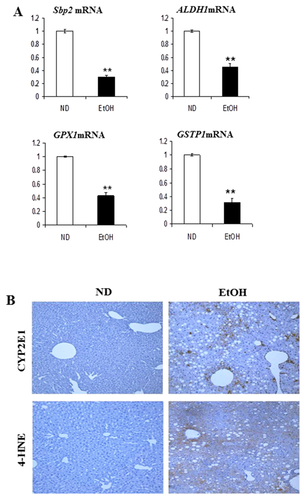
Proteins involved in cellular defense strategies against oxidative stress also showed coordinated changes in expression. We observed that protein and mRNA of Sbp2 (spot 21 and 22), aldehyde dehydrogenase 1 (ALDH1) (spot 30), glutathione peroxidase 1 (GPx1; spot 27), and GSTP1 (spot 31) were significantly down-regulated in the EtOH-fed mice (Fig. 4A). CYP2E1 expression and 4-HNE formation were also investigated (Fig. 4B). The microsomal enzyme CYP2E1 is a major contributor to ethanol-induced ROS production in the liver and 4-HNE formation indicates lipid peroxidation. Hepatic CYP2E1 dramatically increased in the EtOH-fed mice compared to that in the ND mice and 4-HNE adduct formation was prominent in EtOH-fed mice.
COMPARISON OF DIFFERENTIALLY EXPRESSED PROTEINS BETWEEN ALCOHOLIC AND NONALCOHOLIC LIVER DISEASE
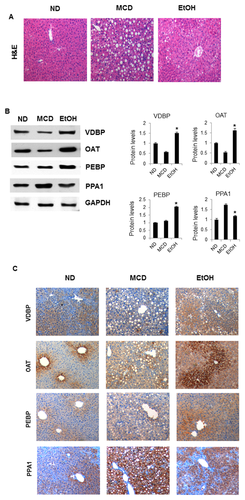
From our previous proteomics studies, we identified liver proteins that are differentially regulated in mice fed an MCD diet for 3 weeks [Lee et al., 2015]. To determine the proteins responsible for alcohol-induced liver damage, we compared the results of this study with those from the MCD-diet study. Although a full set of parallel analysis is not shown here, as we expected most proteins overlapped each other with similar regulation patterns. However, eight proteins shown in Table II were clearly differently regulated. These proteins can be classified into two groups according to their regulation pattern. Proteins such as OAT-1, VDBP, and PEBP were upregulated by alcoholic stress but down-regulated in MCD-fed mice, compared with that in ND-fed mice. In contrast, five proteins, including PPA1 were differentially regulated in MCD mice; however, they did not have a significantly different profile between EtOH-fed mice and ND control mice.
| Fold change | ||||
|---|---|---|---|---|
| Noa | Identified protein | Accession no | MCDb | ETOH |
| 1 | Ornithine aminotransferase, mitochondrial | P29758 | ↓ (0.4) | ↑ (2.0) |
| 19 | Vitamin D-binding protein | P21614 | ↓ (0.6) | ↑ (2.0) |
| 20 | Phosphatidylethanolamine-binding protein 1 | P70296 | ↓ (0.6) | ↑ (1.5) |
| Inorganic pyrophosphatase | Q9D819 | ↑ (2.3) | — | |
| Sulfotransferase family cytosolic 2B member 1 | O35400 | ↑ (2.6) | — | |
| Lactoylglutathione lyase | Q9CPU0 | ↓ (0.6) | — | |
| Regulator of G-protein signaling 20 | Q9QZB1 | ↓ (0.6) | — | |
| 60S acidic ribosomal protein P0 | P14869 | ↓ (0.5) | — | |
To validate the proteomic results, we compared the histology of liver sections from ND, MCD, and EtOH-fed mice by H&E staining, revealing macro vesicular lipid accumulation (Fig. 5A). Then, differential expression was confirmed by western blot and immunohistochemistry (Figs. 5B, C, S2, and S3). Indeed, VDBP and OAT-1 expression was dramatically increased in EtOH-fed mice, whereas decreased in MCD-fed mice compared with that in the ND controls. We observed that PEBP was also upregulated in EtOH-fed mice; however, there were no significant differences between MCD-fed mice and control mice. In contrast, PPA1 was significantly upregulated in MCD-fed mice; however, it showed similar expression in EtOH-fed mice and ND mice.
DISCUSSION
Although some of the candidate biomarkers are associated with ALD, the early diagnostic markers are still not clear. The aim of the present work is two fold; first, to identify differentially expressed proteins in alcoholic steatohepatitis and, second, to determine what markers can differentiate between NAFLD and ALD, although both eventually share the same pathogenic mechanism. In the current study, a proteomic approach was applied to livers of mice fed EtOH or ND to determine which proteins were differentially expressed between groups. As a result, 43 differentially expressed proteins were identified, which can be divided into three major groups: proteins related to the methylation cycle, oxidative stress, and transport.
Changes in various metabolites of methionine result in serious functional consequences such as increased steatosis, oxidative stress, and apoptosis. Here, we showed that most methylation cycle proteins were down-regulated in EtOH-fed mice. An imbalance in SAM metabolism may play a role in the development of steatohepatitis. MAT1 and GNMT play a major role in the synthesis and degradation of SAM, respectively, and we observed that expression of these genes was down-regulated in EtOH-fed mice. Consistently, another study showed that hepatic steatosis and fibrosis in rabbits fed a high-fat diet were associated with an MAT1 imbalance [Ogawa et al., 2010]. MAT1-knockout mice also exhibited liver steatosis [Helenius et al., 2009]. Similarly, GNMT-knockout mice exhibited elevated serum methionine and SAM levels and developed hepatic steatosis, fibrosis, and hepatocellular carcinoma [Martinez-Chantar et al., 2008]. In particular, we also observed that FTCD was significantly downregulated in EtOH-fed mice. FTCD is a folate metabolism enzyme and a liver-specific autoantigen in patients with autoimmune hepatitis. FTCD was down-regulated in two HCC proteome studies [Kim et al., 2003; Sun et al., 2007]; however, its relationship with steatohepatitis is not clear. In this study, EtOH-induced FTCD inhibition may promote lower THF levels and higher homocysteine levels by inhibiting the methylation of homocysteine to methionine. Consequently, increased hepatic homocysteine levels may promote necroinflammation and endoplasmic reticulum stress due to misfolding of endoplasmic reticulum proteins. Other proteome analysis studies also showed a reduction in SAHH in EtOH-fed mice, similar to our previous observations in a high-fat diet model [Park et al., 2011]. SAHH hydrolyzes S-adenosylhomocysteine (SAH) into adenosine and homocysteine. Decreased SAHH activity results in SAH accumulation and reduced the cellular SAM:SAH ratio. Collectively, our results suggested that a reduction in methylation cycle enzymes may be a general response to liver injury.
The second group of identified proteins included enzymes involved in cellular defense against ROS, dysregulation of which is commonly accompanied by fat accumulation. Normal redox homeostasis exists in hepatocytes when an appropriate balance between levels of oxidants and antioxidants is established and maintained. Perturbation of this equilibrium leads to oxidative stress. ROS-mediated lipid peroxidation is an attractive candidate for a central steatohepatitis pathogenesis mechanism. In this study, we showed significant increases in hepatic 4-HNE and CYP2E1 in the EtOH-fed mice as determined by immunohistochemistry. Moreover, ALDH1 expression was dramatically downregulated in EtOH-fed mice compared with that in ND mice, similar to our previous observations from the MCD-diet model [Lee et al., 2015]. Likewise, other studies reported that ALDH expression was decreased in ALD [Newton et al., 2009]. The ALDH family is important for cellular defense against lipid peroxidation; therefore, a reduction in ALDH could result in oxidative stress. In addition, we showed that mRNA and protein of a selenium transporter SBP2 was downregulated in our model. During alcohol abuse, the selenium level in the liver decreases [Korpela et al., 1985]. Most selenoproteins are involved in redox reactions in which the active site Sec residue plays a central role in catalysis. This class of selenoproteins includes glutathione peroxidases (GPx). We observed that GPx and glutathione S-transferase P1 (GSTP1) were downregulated in EtOH-fed mice. GPx and GSTP1 are involved in defense against free radicals and detoxification of oxidative stress products, respectively. Consequently, the downregulation of both proteins could lead to oxidative stress. Further evidence for an altered redox state in the liver was provided by the observed different expression levels of Prxs. In this study, Prx 1 was significantly upregulated, whereas the Prx 6 level was reduced in EtOH-fed mice. These results are consistent with our recent findings from MCD-fed mice [Lee et al., 2015]. Presumably, Prxs are useful as oxidative stress markers and in the diagnosis of the liver disease regardless of whether the hepatitis was induced by alcohol or not.
In this study, we mainly focused on the identification of differentially expressed proteins that are highly specific for the ALD. Both ALD and NAFLD may share pathogenic mechanisms that follow a two-hit mechanism and a similar course of progression. Therefore, there may not be a clear biomarker protein that allows discrimination between ALD and NAFLD. Herein, a comparative proteomic analysis was conducted by comparing the results of the present EtOH model of liver disease with previous results from an MCD model [Lee et al., 2015]. As far as we are aware, unlike typical individual proteomic analysis, little direct comparative proteomic analysis regarding ALD and NAFLD have been performed. Consequently, most of the differentially expressed proteins were very similar between these two conditions, with no significant differences in the differential expression pattern. Nevertheless, we observed that eight proteins have considerably different patterns. Remarkably, VDBP, OAT, and PEBP were upregulated in alcoholic mice models, compared to that in ND and MCD mice. Other proteins, including PPA1 were differentially regulated in MCD animals but were essentially unchanged in EtOH mice. Conclusively, these proteins are potential biomarkers that may allow discrimination between ALD and NAFLD, although further studies are needed to confirm this.
VDBP is predominantly produced and secreted by hepatic parenchymal cells. VDBP not only plays pivotal roles in transporting vitamin D to target organs, but also has crucial functions in actin scavenging, fatty acid transport, macrophage activation, and anti-inflammatory processes. In this study, we observed a significant reduction of VDBP expression in MCD diet-fed, yet a significant up-regulation in EtOH-fed mice compared with that in ND-fed mice. As far as we are aware, few studies have explored the relevance of VDBP levels in liver tissues as it relates to ALD. However, various studies have demonstrated that plasma VDBP levels are inversely associated with the severity of hepatic failures such as liver fibrosis and insulin resistance [Ho et al., 2010] as well as the risk of pancreatic cancer and renal cell carcinoma [Weinstein et al., 2012; Mondul et al., 2014]. Recently, Adams et al. [2013] reported that serum VDBP levels were reduced as the severity of steatosis increased. Thus, the mechanistic basis of this steatosis-dependent hepatocyte dysfunction is worth evaluating further.
In this study, we also showed that Ornithine aminotransferase(OAT) was significantly upregulated in EtOH-fed mice, whereas it was downregulated in MCD-diet mice compared with that in ND mice. Immunohistochemical analysis also showed that OAT expression is restricted to perivenous hepatocytes. OAT is mainly found in the liver, kidney, and small intestine where it plays a role in regulating the availability of arginine and glutamine. It is known that regulation of OAT expression is cAMP-dependent because OAT expression is induced by glucagon and this effect is inhibited by glucose [Merrill and Pitot, 1985]. Thus, changes in OAT levels could lead to changes in protein metabolism, thereby decreasing the metabolic response to stress. This study is the first to demonstrate that steatohepatitis may be associated with OAT protein expression.
In addition, phosphatidylethanolamine-binding protein 1 (PEBP1) is expressed in various mammals including humans and mice. However, the functions of PEBP in most tissues are still unclear. A study showed that in mice with acute liver failure, PEBP protein levels increased significantly in plasma and liver tissues [Lv et al., 2007]. In contrast, PEBP1 is downregulated in some of the human cancers [Granovsky and Rosner, 2008], and tumor metastasis is suppressed by PEBP. More recently, it has been reported that PEBP1 downregulation in HCC significantly correlates with tumor aggressiveness [Xu et al., 2010]. In this study, both western blot and histopathological results showed that PEBP protein was significantly increased in livers of EtOH-fed mice, which is consistent with the proteomic results. These results suggested that PEBP1 downregulation is relevant in ALD. In the case of MCD diet-fed mice, despite the downregulation seen in previous proteomic work [Lee et al., 2015], we observed no significant differences in its expression upon immunological analysis. The discrepancy could be due to technical restraints, thus further validation studies are required.
In this study, we showed that inorganic pyrophosphatase (PPA1) and sulfotransferase family cytosolic 2B member 1(SULT2B1) significantly upregulated in MCD-fed mice compared with that in EtOH-fed mice and ND mice. PPA1 were catalyzes the hydrolysis of inorganic pyrophosphate (PPi) into orthophosphate. Large amounts of cytosolic PPi are produced in the liver during various metabolic reactions including the synthesis of urea, glycogen, and fatty acid activation. PPA1 is ubiquitously expressed and cytosolic PPi concentrations are highly regulated. PPA1 expression is strongly associated with NAFLD in particular. It is noteworthy that the differential expression and activity of PPA1 are associated with pathological disorders and various types of cancer [Chen et al., 2002; Lexander et al., 2005] including a hepatocellular carcinoma cell line [Liang et al., 2002].
SULT2B1 is a member of SULT's family. Enzymes of SULT's family catalyze the transfer of sulfonate group from the physiologic sulfate donor. SULT2B1 is highly selective for the sulfation of 3β-hydroxysteroids as cholesterol and oxysterols [He and Falany, 2007]. It is expressed in a variety of hormone responsive tissues [He et al., 2004]. Also, SULT2B1 expression is significantly altered in several tumors about to normal tissue [Tozlu et al., 2006; Hevir et al., 2011]. Also, the SULT2B1 has been reported that it was promoting hepatocellular carcinoma cells proliferation [Yang et al., 2013].Therefore, although further studies are needed to confirm, PPA1 and SULT2B1 also may be a potential biomarker candidate for discriminating NAFLD from ALD.
In summary, 43 differentially expressed proteins were identified in mice exposed to EtOH. Our results showed that most of these proteins were involved in Met metabolism and oxidative stress, and were significantly downregulated in response to hepatic toxicity. Moreover, a comparative proteomics analysis of livers with alcoholic versus non-alcoholic disease revealed several candidate marker proteins that are specifically up- or down-regulated in EtOH-exposed mice. Among the distinguishing proteins, VDBP and OAT emerge as the most attractive biomarkers because these were significantly upregulated in EtOH-exposed mice but down-regulated in NAFLD mice. In contrast, PPA1 and SULT2B1 expression was dramatically upregulated in NAFLD whereas no significant difference was observed in ALD animals. Therefore, these proteins may serve diagnostic markers for an early alcoholic or non-alcoholic steatohepatitis, respectively, although further validation studies are required.
ACKNOWLEDGMENTS
This work was supported by the National Research Foundation of Korea (NRF), grant funded by the Korea government (MSIP) (Grant No. NRF-2015R1A4A1042271).


