Optimizing Contrast-Enhanced Magnetic Resonance Neurography of the Brachial Plexus With Delayed Scanning
Funding: This work was supported by the National Natural Science Foundation of China (Grant No. 82302173).
Jun Xu, Xiaoli Hu, and Xiaoyun Su contributed equally to this work and shared the co-first authorship.
ABSTRACT
Background
Contrast-enhanced magnetic resonance neurography (ceMRN) can enhance brachial plexus visualization and quality of imaging. However, the interval between contrast injection and scanning that provides the highest-quality images is not known.
Methods
Fifteen patients underwent brachial plexus imaging using the 3D T2-NerveView sequence with a scanning duration of 5 min. A consecutive six-phase scan was initiated immediately at the start of contrast agent injection. Subsequently, all patients' images were classified into six groups according to the phases: group A (phase 1, delay 0 min), group B (phase 2, delay 5 min), group C (phase 3, delay 10 min), group D (phase 4, delay 15 min), group E (phase 5, delay 20 min), and group F (phase 6, delay 25 min). The image quality in each group was assessed based on nerve signal (signalnerve), muscle signal (signalmuscle), lymph node signal (signallymph node), background noise (BN), signal-to-noise ratio (SNR), contrast-to-noise ratio (CNR), and subjective score.
Results
Signalnerve, signalmuscle, BN, and SNR did not significantly differ among the six groups (p > 0.05). However, significant differences (p < 0.05) were observed in signallymph node (F = 16.067), CNR (F = 9.495), and subjective score (χ2 = 23.586). As the scanning delay increased, signallymph node intensity gradually increased whereas the CNR gradually decreased. The subjective score was significantly higher in groups B (4.83 ± 0.24), C (4.90 ± 0.21), D (4.87 ± 0.30), E (4.83 ± 0.31), and F (4.83 ± 0.31) than in group A (4.47 ± 0.30).
Conclusion
We recommend performing brachial plexus ceMRN 5 min after contrast injection. With this delay, the brachial plexus can be visualized optimally with minimal interference from background signals.
Abbreviations
-
- 3D
-
- three-dimensional
-
- BN
-
- background noise
-
- ceMRN
-
- contrast-enhanced magnetic resonance neurography
-
- CNR
-
- contrast-to-noise ratio
-
- MRN
-
- magnetic resonance neurography
-
- ROI
-
- region of interest
-
- SNR
-
- signal-to-noise ratio
-
- STIR
-
- short tau inversion recovery
1 Introduction
Magnetic resonance neurography (MRN) provides visualization of the brachial plexus and brachial plexus lesions and assists with classification of brachial plexus injury [1-3]. It plays a crucial role in injury diagnosis and localization and has become the preferred diagnostic imaging modality for clinical assessment of non-traumatic brachial plexus injury [4-6].
However, MRN is associated with several technical challenges [7-11]. First, the presence of a large quantity of air in the lung and on the surface of the neck and shoulder causes a significant difference in magnetic susceptibility at the air–soft tissue interface, which may cause conspicuous magnetic susceptibility artifact and failure in fat suppression. Second, obtaining three-dimensional (3D) T2 short tau inversion recovery (STIR) imaging requires a long scanning time, and this sequence is associated with a high specific absorption rate value, which can lead to patient discomfort and consequent motion artifacts. Third, the lymph nodes and slow-flowing veins surrounding the cervical nerve roots exhibit high signal intensity on the 3D T2 STIR sequence, which affects visualization of the brachial plexus (Figure 1).
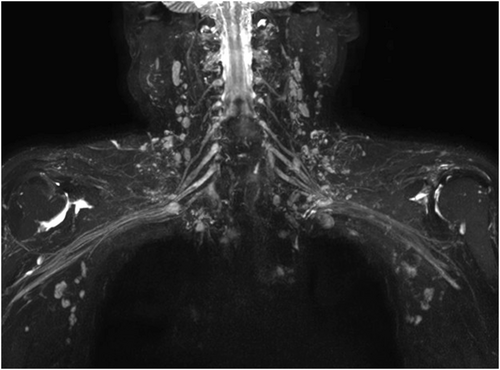
Non-contrast-enhanced brachial plexus imaging. It can be seen intuitively that the background signal affecting brachial plexus visualization mainly originates from lymph nodes and veins.
To enhance brachial plexus visualization and quality of imaging, contrast-enhanced MRN (ceMRN) may be used, in which an injected contrast agent reduces signal contamination from the lymph nodes and veins around the nerve roots [12-15]. However, the interval between contrast injection and scanning that provides the highest-quality images is not known.
Therefore, we used continuous multiphase scanning to determine the optimal time to initiate brachial plexus ceMRN scanning after contrast injection.
2 Materials and Methods
2.1 Patients
Adult patients (age > 18 years) who were clinically evaluated with suspicion of or diagnosed with brachial plexus pathology at our hospital from November, 2019 to April, 2020 were eligible to enter the study. Those with abnormal liver or kidney function or severe mental illness were excluded. We also excluded patients whose scanning was interrupted because of discomfort. A detailed study flowchart is shown in Figure 2. The study was approved by the Institutional Review Board of Union Hospital, Tongji Medical College, Huazhong University of Science and Technology (No. TJ2015-04-02). All participants provided written informed consent.
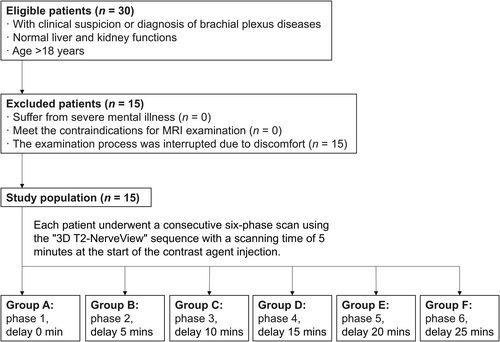
Study flowchart. 3D, three-dimensional; SD, standard deviation.
2.2 Scanning Method and Parameters
Brachial plexus scanning was performed using a 3.0T Ingenia CX system (Philips Healthcare, Amsterdam, the Netherlands) with a 16-channel head coil and a 32-channel abdominal coil. Patients were in the supine position with their arms resting naturally at the sides. The center of the scanning field was set at the level of the C6 vertebral body. Gadodiamide contrast agent was injected at a dose of 0.3 mL/kg with a flow rate of 2.0 mL/s, followed by a 15 mL saline flush. Immediately after injection, continuous scanning using a coronal 3D T2-NerveView sequence was initiated for six phases using the following parameters: TR/TE, 2200/180 ms; FOV, 320 mm × 433 mm × 100 mm; voxel, 1.0 mm × 1.0 mm × 2.0 mm; matrix, 320 × 438; number of layers, 100; layer thickness, 2.0 mm; layer interval, 1.0 mm; NSA, 1; CS-SENSE, 4; suppression mode, STIR; scanning time, 5 min. Eventually, all patients' images were classified into six groups according to the phases: group A (phase 1, delay 0 min), group B (phase 2, delay 5 min), group C (phase 3, delay 10 min), group D (phase 4, delay 15 min), group E (phase 5, delay 20 min), and group F (phase 6, delay 25 min).
2.3 Objective Evaluation
The signal of the C7 nerve trunk (Signalnerve), lymph node (Signallymph node), and sternocleidomastoid muscle (Signalmuscle) were measured at different coronal levels on the thin original brachial plexus images (Figure 3). The standard deviation (SD) of the region of interest (ROI) within the sternocleidomastoid muscle served as background noise (BN). The Signalnerve, Signallymph node, Signalmuscle, BN, signal-to-noise ratio (SNR), and contrast-to-noise ratio (CNR) were compared across groups. SNR was calculated as Signalnerve/BN. CNR was calculated as (Signalnerve − Signallymph node)/BN.
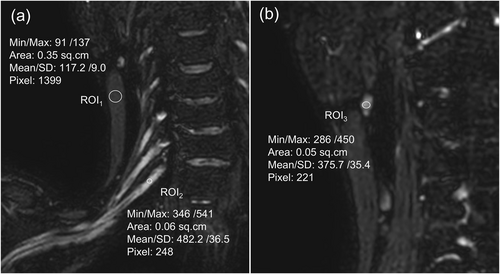
Measurement of the regions of interest. Circular ROIs of appropriate size were employed to measure the signal intensity of the sternocleidomastoid muscle (Signalmuscle) (a, ROI1), C7 nerve trunk (Signalnerve) (a, ROI2) and lymph node (Signallymph node) (b, ROI3). The standard deviation within the sternocleidomastoid muscle ROI was used as the BN. The indicators were measured three times. After obtaining the average value, the SNR and CNR were calculated. SNR was calculated as Signalnerve/BN. CNR was calculated as (Signalnerve–Signallymph node)/BN. BN, background noise; CNR, contrast-to-noise ratio; ROI, regions of interest; SD, standard deviation; SNR, signal-to-noise ratio.
2.4 Subjective Scoring
A double-blind evaluation of all images was performed by two senior attending radiologists with 6 and 10 years of experience, respectively, who were blinded to patient and imaging data. Scoring was based on visualization of the various components of the brachial plexus as follows: (1) 1 point was awarded for clear visualization of the nerve roots; otherwise, 0.5 points were given. (2) 1 point was awarded for clear visualization of the trunks; otherwise, 0.5 points were given. (3) 1 point was awarded for clear visualization of the divisions; otherwise, 0.5 points were given. (4) 1 point was awarded for clear visualization of the cords; otherwise, 0.5 points were given. (5) 1 point was awarded for clear visualization of the branches; otherwise, 0.5 points were given. In cases of disagreement between the two radiologists, a final score was determined through discussion and consensus.
2.5 Statistical Analysis
Statistical analysis was performed using SPSS software version 26.0 (IBM Corp., Armonk, NY, USA). Continuous data were tested for normality and homogeneity of variance and then compared using one-way analysis of variance or nonparametric Friedman test as appropriate. Subjective scores were compared using the chi-square test. The significance level for pairwise comparisons was set at α' = 0.0033 (0.05/15 = 0.0033). For the other tests, p < 0.05 was considered significant. The agreement between the subjective scores of the two radiologists was evaluated using the kappa coefficient, where κ < 0.40 indicates poor agreement and κ > 0.75 indicates good agreement; values equal to or between 0.40 and 0.75 indicate fair agreement. The continuous data were presented as the mean ± SD. The Count data were expressed as the number (n).
3 Results
Fifteen patients (10 men and five women) were included for analysis after applying criteria. Mean patient age was 47.3 ± 12.5 years (range, 26–63 years). All successfully completed scanning with no significant adverse effects and the images from the six groups met the diagnostic imaging criteria.
3.1 Objective Evaluation
As shown in Table 1 and Figure 4, signalnerve, signalmuscle, BN, and SNR did not significantly differ among the six groups. However, significant differences were observed in signallymph node (F = 16.067) and CNR (F = 9.495). With increasing delay in scanning time, the number of visualized lymph nodes and signallymph node intensity gradually increased, whereas the CNR gradually decreased. This suggests that signallymph node is impacted as the contrast agent is metabolized over time after injection.
| Groups | Signalnerve | Signalmuscle | Signallymph node | BN | SNR | CNR |
|---|---|---|---|---|---|---|
| A | 512.67 ± 113.55 | 109.59 ± 21.41 | 135.37 ± 65.61c | 13.70 ± 5.22 | 41.67 ± 15.11 | 29.89 ± 2.31a |
| B | 509.75 ± 130.29 | 107.73 ± 16.32 | 240.12 ± 96.92b | 13.19 ± 4.64 | 44.40 ± 21.25 | 22.25 ± 2.32a,b |
| C | 533.87 ± 129.93 | 116.63 ± 22.95 | 306.18 ± 104.25a,b | 14.10 ± 4.80 | 41.50 ± 16.03 | 17.31 ± 2.28b,c |
| D | 509.31 ± 130.53 | 118.13 ± 17.25 | 329.31 ± 91.61a,b | 14.03 ± 3.64 | 39.11 ± 14.73 | 13.46 ± 2.22b,c |
| E | 510.91 ± 132.67 | 115.51 ± 18.29 | 354.11 ± 78.34a | 12.16 ± 2.65 | 42.80 ± 10.91 | 13.43 ± 2.68b,c |
| F | 510.21 ± 145.04 | 116.64 ± 21.96 | 387.54 ± 87.94a | 12.72 ± 3.30 | 42.47 ± 15.98 | 9.51 ± 2.54c |
| F | 0.081 | 0.700 | 16.067 | 0.519 | 0.181 | 9.495 |
| p | 0.995 | 0.625 | < 0.05 | 0.762 | 0.969 | < 0.05 |
- Note: Pairwise comparisons are indicated by letter notations (a, b, c). There is no statistical difference among any groups with the same letters. Statistical differences exist only when the letters are completely different.
- Abbreviations: BN, background noise; CNR, contrast-to-noise ratio; SNR, signal-to-noise ratio.
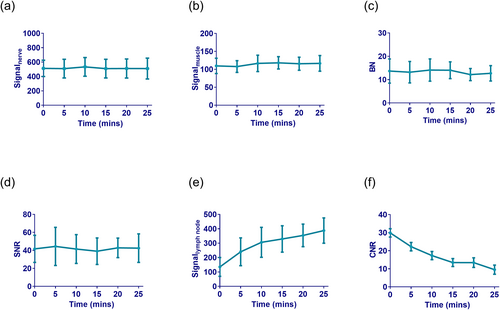
Time-intensity (or magnitude) curves of objective indicators. (a) Signalnerve, (b) signalmuscle, (c) BN and (d) SNR were basically unchanged over time. (e) Signallymph node gradually increased over time, while the (f) CNR gradually decreased. These objective indicators reflect image quality. Within a certain range, the lower the signalmuscle and signallymph node, and the higher the signalnerve result in better visualization of the brachial plexus. The lower the BN and the higher the SNR, the better the image quality. The CNR reflects the signal contrast between nerve tissue and lymph nodes. The higher the CNR, the better the image contrast. BN, background noise; CNR, contrast-to-noise ratio; SNR, signal-to-noise ratio.
3.2 Subjective Evaluation
The overall subjective scores exhibited good interobserver agreement (κ = 0.868). As shown in Table 2 and Figure 5, the final subjective score for each of the six groups was ≥ 4 points. The subjective score did not significantly differ among groups B, C, D, E, and F; however, the score was significantly lower for group A (4.47 ± 0.30) than groups B (4.83 ± 0.24), C, (4.90 ± 0.21), D (4.87 ± 0.30), E (4.83 ± 0.31), and F (4.83 ± 0.31). Presumably, the contrast agent had not fully entered the small veins surrounding the nerve roots in the first 5 min after injection and suppression of venous signal (signalvein) was insufficient, causing a lower score for group A.
| Groups | 4.0 points | 4.5 points | 5.0 points | Average score |
|---|---|---|---|---|
| A | 3 | 10 | 2 | 4.47 ± 0.30b |
| B | 0 | 5 | 10 | 4.83 ± 0.24a |
| C | 0 | 3 | 12 | 4.90 ± 0.21a |
| D | 1 | 2 | 12 | 4.87 ± 0.30a |
| E | 1 | 3 | 11 | 4.83 ± 0.31a |
| F | 1 | 3 | 11 | 4.83 ± 0.31a |
| χ2 | 25.476 | |||
| p | < 0.05 | |||
- Note: Pairwise comparisons are indicated by letter notations (a, b, c). There is no statistical difference among any groups with the same letters. Statistical differences exist only when the letters are completely different.
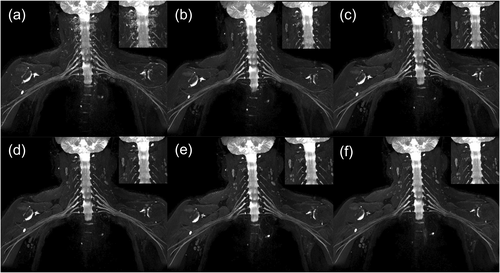
Representative case. The veins around the nerve roots in phase 1 (a) were poorly suppressed, which affected visualization of the nerve roots. Five minutes after contrast injection, the images obtained in phases 2, 3, 4, 5, and 6 (b–f, respectively) exhibited good suppression of signalvein and excellent visualization of the brachial plexus. The signallymph node gradually increased with time, however, which may have some effect on visualization.
4 Discussion
This study demonstrated that the time interval between injection of contrast agent and image acquisition affects the suppression of signallymph node. As time elapsed, the suppression of signalvein was also affected (Figure 6). Although the subjective scores of all six groups were relatively high, we still recommend performing brachial plexus ceMRN 5 min after contrast injection for two reasons: First, to achieve excellent image quality, good background suppression is required, namely the suppression of high signallymph node and signalvein. The signallymph node and signalvein were relatively low only in group B. Second, in clinical practice, patients have some other sequences for auxiliary diagnosis that need to be scanned. If a longer waiting time is required for ceMRN, it is easy to cause discomfort to the patient and lead to examination interruption or failure.
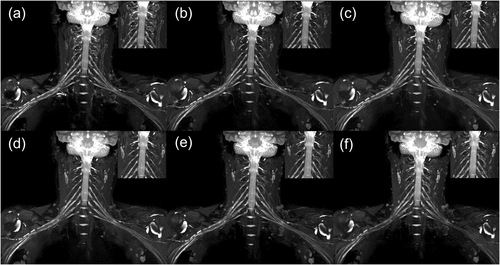
Another representative case. In phase 1 (a), the signalvein around the nerve roots was not well suppressed. In phases 2, 3, and 4 (b–d, respectively), the signalvein was well suppressed. In phases 5 (e) and 6 (f), the signalvein began to be gradually visualized, illustrating that contrast agent concentration affects the suppression of signalvein.
The 3D T2-NerveView sequence is based on the STIR technique and uses high resolution and isotropic voxels, avoiding geometric distortion in the reconstructed image. The STIR technique is employed for fat suppression, using a broader bandwidth (2500 Hz) of the 180° flip insulated pulse, which addresses the issue of uneven fat suppression in the neck. Additionally, the sequence incorporates motion-sensitized driven equilibrium, which reduces the signal of moving tissues, effectively suppressing the signal of veins and subclavian arteries [16-19]. Moreover, we combined the newly developed compressed sensing technique with the 3D T2-NerveView sequence, which greatly saves scanning time by “sparse sampling”, reduces motion artifacts, and improves the success rate of the examination. These advanced techniques allowed us to perform multiphase scans of the brachial plexus after contrast injection and obtain high-quality images.
Signalnerve and signalmuscle were largely unchanged over time owing to the presence of the blood–nerve barrier and the relative sparseness of blood vessels in muscle tissue [20]. Contrast agent shortens the T2 value of tissue. The higher the contrast agent concentration, the more obvious the T2 shortening and the faster the tissue signal attenuates. As a result, the suppression of background signals is better [20-22]. After a contrast agent is injected, its tissue concentration will go from low to high and then to low owing to the blood circulation and renal metabolism. This change in concentration causes the signallymph node and signalvein to change over time. However, the concentration change in lymph nodes is rapid, whereas that in the perineural plexus veins is relatively slow. Understanding the dynamic changes of signallymph node and signalvein can assist radiologists in selecting the appropriate delay time or designing new scanning protocols to achieve superior image quality.
In this study, signallymph node was lowest on the first-phase scan, whereas signalvein around the nerve roots were completely suppressed starting from the second-phase scan (phases 2–6). Based on these findings, we hypothesize that in order to obtain high-quality brachial plexus imaging with minimal background signal interference, two contrast injections could be administered. The basic method is as follows: first, suppress the signalvein with the first contrast injection; 5 minutes later, immediately initiate the scan upon the second contrast injection, which will also suppress the signallymph node. However, this hypothesis has not yet been tested. If proven effective, this approach could further improve the image quality of the brachial plexus.
We acknowledge that this study has several limitations. First, the sample size is small and the statistical results may lack persuasiveness. Second, although the gadodiamide contrast agent has a half-life of approximately 1.5 h [23], we only monitored signal changes during the first 30 min after injection. Third, our recommendation to perform brachial plexus ceMRN 5 min after contrast injection is relative and a function of the fact that our sequence time was 5 min. If our sequence time had been 3 min, we might have recommended a 3-min time period.
5 Conclusion
In conclusion, the timing of imaging after contrast agent injection in brachial plexus ceMRN affects image quality. We recommend performing ceMRN 5 min after contrast injection to obtain the best visualization of the plexus, which should improve diagnostic accuracy.
Author Contributions
Jun Xu: writing–original draft (equal). Xiaoli Hu: writing–original draft (equal). Xiaoyun Su: software (equal). Shen Gui: validation (equal). Ziqiao Lei: project administration (equal). Xiaoming Liu: data curation (equal). Xiangzhi Zhou: validation (equal). Lixia Wang: conceptualization (equal). Wenjun Wu: writing–review & editing (equal). Xiangchuang Kong: writing–review & editing (equal).
Acknowledgments
The authors have nothing to report.
Ethics Statement
We have read the statement of the journal's Ethics and Integrity Policy and have strictly adhered to the provisions. The study was approved by the Institutional Review Board of Union Hospital, Tongji Medical College, Huazhong University of Science and Technology (Approval No. TJ2015-04-02).
Consent
All participants provided written informed consent.
Conflicts of Interest
The authors declare no conflicts of interest.
Open Research
Data Availability Statement
The data and supportive information are available within the article.


