Characterizing hydro-geotechnical processes of slopes implemented with bioretention cells
Abstract
Low impact development (LID) practices are rarely implemented on slopes due to concerns about their poor hydrological performance and the potential impact on slope stability. Implementing LIDs on slopes, involving alterations to surface topography and subsurface hydrology (specifically, the formation of a groundwater mound), can pose challenges in maintaining slope stability. However, sloping areas often require LIDs for sustainable development. It is imperative to supplement the conventional design standard to address these challenges. Before proposing specific solutions, the impact of LIDs on slope stability should be understood first. This includes quantifying the extent of changes in slope stability before and after LID implementation, as well as identifying the key factors that influence stability. To address these, we developed a numerical model in HYDRUS-2D to simulate the hydrological and geotechnical processes of slopes implemented with a two-stepped bioretention cell (BC) system. The numerical model was calibrated and validated using monitoring data from a stepped BC in Cincinnati, Ohio, USA. Simulation scenarios encompassed three generic slope angles (15°, 20°, and 25°) with and without BCs, two initial groundwater table positions and two inflow volumes. The hydrological process was characterized by the evolution of the groundwater mound, and the geotechnical process was quantified using the factor of safety (FoS). Our findings indicated slope cutting and filling was likely to enhance stability with an increase in the FoS of 0.1. However, the formation of groundwater mounds, resulting from exfiltration, led to an approximate 0.1–0.2 reduction in the FoS, depending on the inflow volume. The subsequent groundwater mound evolution had no further impact on stability. Ultimately, the FoS was slightly reduced by around 0–0.1 due to the combined effect of cutting and filling operations and groundwater mounds. It was generally safe to implement LIDs on 15° slopes. For steeper slopes, special design considerations are necessary, such as reducing the drainage area to strike a balance between hydrological performance and slope safety.
1 INTRODUCTION
Low impact development (LID) has gained worldwide recognition for its ability to provide a range of benefits, including retaining runoff, enhancing groundwater discharge, reducing pollutants, mitigating heat island effects, and preserving biodiversity (Cheshmehzangi et al., 2021; Liu et al., 2014; Zhang & Chui, 2018). An increasing number of countries are actively promoting the implementation of LID, as exemplified by programs such as the ‘Active, Beautiful, Clean Waters’ initiative in Singapore, ‘Sponge Cities’ in China, and ‘Sustainable Water Drainage’ efforts in Europe, among others (Charlesworth, 2010; Lim & Lu, 2016; Nguyen et al., 2019). Although LIDs are gaining popularity, their implementation in mountainous cities such as Hong Kong (Chui & Ngai, 2016) and Asheville, North Carolina, USA (Ormond et al., 2010) is still limited, particularly in terms of infiltration-based systems.
Notably, while LIDs share similar components with soil engineering techniques, such as vegetation cover and subsurface drainage pipes, they differ in their primary goals. LIDs primarily focus on water management and restoring hydrological balance, whereas soil bioengineering techniques prioritize slope stabilization (Bischetti et al., 2010; Stokes et al., 2009). Vegetation and drainage pipes are not considered essential components in LID practices designed for runoff collection, infiltration and storage; instead, they serve as supplementary elements to partition excess infiltration into evapotranspiration and drainage loss (Ballard et al., 2015; Zhang & Chui, 2020). Conversely, in the context of soil engineering techniques, infiltration is undesirable. Vegetation and drainage pipes are designed to rapidly remove infiltrated water. Additionally, vegetation provides root reinforcement, contributing to further slope stabilization (Stokes et al., 2009). In this study, the term ‘LIDs’ specifically refers to infrastructures that collect runoff and promote infiltration.
The primary challenges in implementing LIDs in mountainous areas include the relatively poor hydrologic performance of these systems and the increased risk of slope instability. Hou et al. (2019) constructed a physical model at a geometric scale of 1:100, based on a LID pilot area. By tilting the physical model from 1° to 10°, they observed that sloping topography typically leads to quicker runoff and reduced infiltration times, consequently diminishing the retention capacity of LID systems. Luan et al. (2017) examined the LID implementation within a mountainous catchment area in Fragrance Hill, Beijing, which has a maximum slope of 22%. Their study found that LIDs were effective only in managing rainfall events with 1- and 2-year return periods. In addition, the exfiltrated water from infiltration-based LIDs enhances subsoil moisture and groundwater recharge, consequently impacting slope stability (Hotta et al., 2010).
The runoff reduction has been partially improved through modifying the structure of LID practices. In recent projects, LIDs have been typically installed on gentle slopes (i.e., <15%–20%; CWP, 2009; MPCA, 2022) in a stepped form. For example, a 12-stepped bioretention cell (BC) system was constructed on a 6% slope in Seattle, USA (Chapman & Horner, 2010), and two-stepped BCs were constructed on a 13% slope in Ohio, USA (Shuster et al., 2017). Furthermore, efficient design measures, such as minimizing the number of steps and installing intermediate pipes, enable the stepped LID system on slopes to perform as effectively as those on flat areas (Chen & Chui, 2022).
The unresolved challenge of slope stability has hindered the installation of LIDs on steeper slopes. Tang et al. (2021) studied the impact of bioretention facilities on the stability of road subgrade slopes. They discovered that exfiltration from these facilities would seep to the base of the road subgrade slope, resulting in a higher stress concentration. This suggests that the slope base may be a vulnerable area. Zukowski and Welker (2017) noted that installing LID on an embankment with a 32° slope could destabilize the toe of the slope, recommending that LIDs be placed at least 4 m from the slope edge. However, their conclusions are constrained by the limited scale of their studies, specifically regarding the size of the road subgrade and embankment slopes. Thus, these findings might not be universally applicable to larger or more extensive sloped areas, such as sloping streets and hilly residential regions (Zhou et al., 2003). These types of slopes could potentially be available locations for implementing LID practices because of their ample space and low land cost (Chen & Chui, 2022).
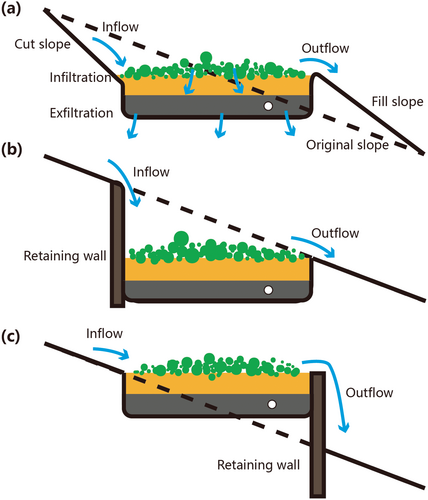
LID practices potentially affect the risk of slope failure primarily due to two factors: (1) the cut and fill of a slope during the construction of LIDs and (2) the rise in soil moisture and groundwater tables. LIDs are typically installed horizontally to ensure adequate ponding and infiltration (Ballard et al., 2015). However, this installation method often results in the creation of cut-and-fill slopes (Cunningham et al., 2017), as shown in Figure 1a. Notably, the cut and fill of a slope represents a method of LID installation; the term of ‘fill and cut’ indicates that portion of the soil has been retrofitted with LID engineering materials. The cut-and-fill slopes are much steeper than the original slope and consequently pose more threat of slope failure (Borga et al., 2004). To avoid the need for cut-and-fill slopes during LID installation, check dams, retaining walls or gabions can be used as local reinforcement (ESD, 2007) as Figure 1b,c show. This approach, however, results in flow flushing over retaining walls and increased construction costs. Alternatively, the cut and fill of a slope is typically recommended due to its lower cost and the exclusion of concrete structures. Local reinforcement should only be considered when the slope is too steep to meet stability requirements.
Apart from the modification of the surface topography, LIDs tend to raise the groundwater table locally, a phenomenon known as the formation of a groundwater mound (Machusick et al., 2011; Singh, 2012). The groundwater mound is commonly quantified and characterized by its vertical extent (height) and lateral extent (width). Zhang and Chui (2017) conducted a study on the evolution of groundwater mounds beneath a BC under shallow-water conditions, focusing on their formation and dissipation. The study revealed that the dissipation of the groundwater mound takes time. Endreny and Collins (2009) investigated the impact of multiple bioretention basins and found that two adjacent bioretention basins created an overlapping mound. In another study, Mahdavi (2015) analytically determined the profiles of groundwater mounds in three sloping aquifers and argued that the groundwater mound would migrate further downslope as the aquifer became steeper. It is worth noting that Mahdavi's study only compared slopes less than 8%, and as a result, may provide limited insight into steeper slopes.
Slope failure is often triggered by the rising groundwater table, which increases pore pressure, reduces effective stress, and ultimately leads to failure (Bordoni et al., 2015; Chae et al., 2015). Factors such as substantial rainfall, large-scale irrigation, and reservoir impoundment can elevate the regional groundwater table uniformly (Gu et al., 2019; Zhang et al., 2012). However, the effects of local-scale groundwater mounds, as opposed to uniform regional rises, on slope stability remain less clear. To the best of our knowledge, the specific impact of groundwater mounds beneath LIDs on slope stability has yet to be thoroughly investigated.
This study is intended to characterize and compare the subsurface hydrology and slope stability with and without LID installation on slopes across various site conditions. We developed a two-dimensional variably saturated numerical model in HYDRUS-2D and integrated it with a slope-analysis module. The field monitoring data of a stepped BC in Cincinnati, Ohio, USA was used for model calibration and validation. Using this validated model, we conducted scenario-based simulations, varying site conditions: slope angles and groundwater table positions, and inflow volumes. These exploratory scenarios are designed to answer the following questions: (1) How does the groundwater mound evolve in slopes with LID implementation? (2) To what extent do LIDs affect slope stability under different site conditions? (3) How do two factors, cutting and filling work and groundwater mound, contribute to the change of slope stability?
2 METHODOLOGY
2.1 Numerical models
Soil moisture and groundwater were simulated by solving Richards' equation in HYDRUS-2D (Šimůnek et al., 1999). The software was specifically chosen for its capability to handle flow regions delineated with irregular boundaries. In addition, the extension Slope Classic module can perform slope-stability analysis based on preceding hydrological simulations. HYDRUS-2D has previously been used to simulate hydrologic processes in both LIDs and their surrounding soils (Brunetti et al., 2016; Lu et al., 2021; Stewart et al., 2017). We identified moments characterized by a high risk of slope instability, directly linked to increases in the groundwater table. A few observation points were strategically placed at the bottom boundary of the hydrological model to monitor changes in the groundwater head. These specific moments were identified by the peak groundwater head readings recorded at the observation points. At these critical moments, the soil moisture profiles derived from HYDRUS-2D simulations were utilized as inputs for the slope-stability analysis model.
2.1.1 Subsurface hydrologic simulation
2.1.2 Slope stability analysis
The slope-stability model seeks the circular slip surface with the lowest FoS, defined by three points: two on the ground and one in the soil. These points have varying degrees of freedom, totalling four independent parameters for defining the slip surface. Through sensitivity analysis and a parameter change matrix, this method facilitates a swift and dependable optimization process and identifies the most critical slip surface by the smallest FoS, efficiently avoiding local minima (PC-Progress s.r.o, 2014).
2.2 Study site and data
2.2.1 Study site
We simulated the two-stepped BCs at the base of a wooded hillside in Cincinnati, Ohio, USA (Figure 2a). The stepped BCs, comprising an upper cell (400 m2) and a lower cell (300 m2), received runoff from a parking lot, wooded slope, and even the roadway drainage system during the storm season (from January to July) (Shuster et al., 2017). The drainage area was nine times larger than the facility area. Runoff entered the upper cell, then the lower cell only if it exceeded the upper cell's retention capacity. If it still exceeded the lower cell's capacity, it entered the combined sewer system. Each cell consisted of the following layers: surface ponding (5–10 cm), engineering soil (45–60 cm; loamy sand), storage (38 cm; #57 gravel aggregate), and an underdrain (7.5 cm in radius; perforated PVC). These cells were designed with a large length-to-width ratio of 40:1 to maximize the interception of runoff along slopes. The subsoil of clay loam formed a 17° upslope and an 11° middle slope (Figure 2b).
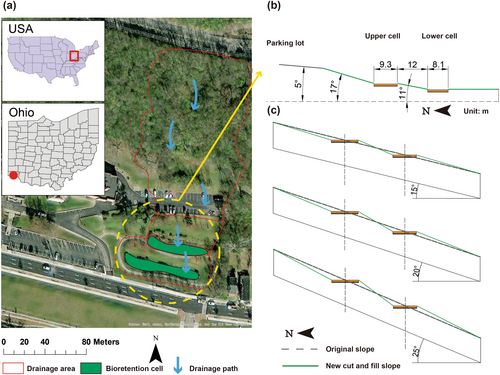
To generalize the impact of LIDs on slopes, we did not entirely replicate the exact site topography. However, we strictly maintained the real structure of BCs in simulations. Minor changes in surface topography had minimal impact on the response of BCs to storms, as runoff routing was not included in simulations. Figure 2c presents three generic slopes (15°, 20°, and 25°) that were cut and filled to accommodate the two-stepped BCs. It is important to note that this study did not aim to implement LIDs in slopes prone to failure (i.e., ≥30°, as per Zhang et al., 2011). Instead, the focus was on identifying slopes with gentler to mild inclines suitable for safe LID implementation. The width of two cells (9.3 and 8.1 m) and the spacing (12 m) between BCs followed those of the actual site.
2.2.2 Monitoring data
Shuster et al. (2017) monitored the performance of the stepped BCs' performance from April 2012 to October 2015. A weather station recorded the precipitation, relative humidity, wind speed and direction, solar radiation, and air temperature, which are essential parameters for evapotranspiration calculation using Penman–Monteith method. An H-flume measured the inflow into the upper cell, and the regenerated flow into the lower cell, while an in-pipe Thel-mar weir measured outflow from the lower cell into the combined sewer system. Soil moisture sensors were installed near the inlet of the lower cell.
During the 4-year monitoring, the annual rainfall depth reached its peak at 940 mm in 2013, resulting in 1852 m3 of inflow to the upper cell and 769 m3 of inflow to the lower cell. Given that runoff played a dominant role in infiltration compared to direct precipitation, we identified the largest runoff event within 4 years and used it as input for the numerical model. Herein, storm events were separated by an interevent time of 6 h. As a result of several consecutive rainfalls (Table 1), the largest storm event started from 2013-05-05 01:10:00 to 2013-05-12 08:10:00 with cumulative inflows of 700 m3 into the upper cell and 200 m3 into the lower cell.
| Start date | Event duration (h) | Rainfall depth (mm) |
|---|---|---|
| 04/05/203 | 34.9 | 62.9 |
| 07/05/2013 | 19.3 | 5.6 |
| 08/05/2013 | 15.6 | 1.78 |
| 09/05/2013 | 21 | 2.9 |
| 10/05/2013 | 12.8 | 33.2 |
| Total | 103.6 | 106.38 |
2.3 Model settings
2.3.1 Hydrologic model
The modelling domain, overlying an impermeable rock, was set 7161 and 915 cm in length and depth, respectively (Figure 3a). The length was determined based on the actual distance between key points: the parking lot and the upper cell (upslope), the upper cell and the lower cell (middle slope), and the lower cell and the road (downslope). The depth was chosen with reference to Ohio's bedrock mapping. Additionally, the domain size was also chosen to ensure that exfiltration from the BCs did not significantly impact groundwater levels at the two vertical boundaries. Trial simulations confirmed that the head difference at two vertical ends between initial and peak values was less than 2% when a system-dependent boundary was applied (herein, the gradient-type boundary: dH/dx = slope gradient; H is the total head). Therefore, the modelling domain was considered sufficiently large to avoid significant interactions between the BCs and the far ends.
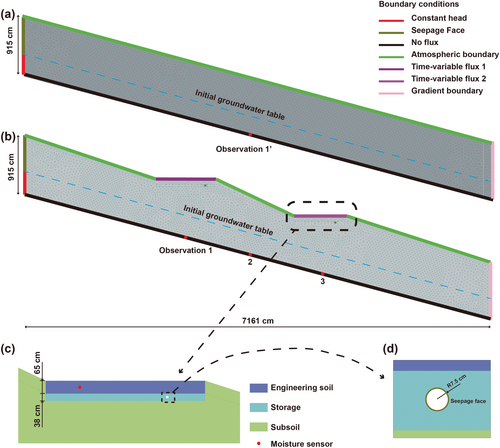
At the upslope end, a boundary condition was applied, using a constant head below the groundwater table and a seepage face above it (Figure 3a,b). Although the constant head boundary may introduce some level of deviation between real-world and simulated flow dynamics due to its inability to accurately mimic variable flux along this boundary, this choice was paramount for ensuring the overall stability of the model (Stewart et al., 2017). Furthermore, the constant head boundary was deemed particularly suited for event-based analyses, allowing for the assumption of various heads in conjunction with different initial groundwater table positions (Zhang & Chui, 2017).
The downslope end was designated with a gradient boundary, the gradient of which was determined by the slope angle (Šimůnek et al., 2006). The topsoil exposed to the atmosphere was defined with an atmospheric boundary, accounting for precipitation and evapotranspiration. If the pressure head of surface soil falls within the predefined minimal and maximal thresholds, the boundary condition is set to an influx, calculated as the difference between the precipitation and evapotranspiration rates. If the pressure head exceeds these thresholds, indicating either excessive infiltration or evapotranspiration, the boundary switches to a pressure head boundary. Runoff entering BCs was uniformly applied on each cell's surface. Time-variable flux, a Neumann-type boundary, was assigned to the upper and lower cell surfaces, respectively. The time-variable flux boundary covered both runoff inflow and precipitation. It is important to note that time-variable flux was not used on slopes without BCs (Figure 3a), as runoff was assumed to quickly flow down those slopes. Underdrains were designated with a seepage face (Figure 3d), and the bottom boundary was set to have no flux.
Two BCs shared a similar structure of an engineering soil layer of 65 cm and a gravel storage layer of 38 cm. The hydraulic properties of these soils and gravel are provided in Table 2, with values or ranges obtained from design specifications, in-situ measurements, literature, or typical values for the respective soil types. To reduce model uncertainty, we focused on calibrating the key parameters that primarily affect soil moisture: saturated hydraulic conductivity and saturated moisture content of the engineering soil, as well as the hydraulic conductivity of the gravel aggregate (Lu et al., 2021).
| Soil layer (soil type) | Hydraulic parameters | Values/ranges | Source |
|---|---|---|---|
| Engineering soil (loamy sand) | Hydraulic conductivity (cm/min) | 0.06–2.0 | Designed range |
| Residual moisture (–) | 0.057 | Typical value | |
| Saturated moisture (–) | 0.4–0.55 | Measurement | |
| (van Genuchten) (cm−1) | 0.124 | Typical value | |
| (van Genuchten) (–) | 2.4 | Typical value | |
| Storage (# 57 aggregate) | Hydraulic conductivity (cm/min) | 10–96 | Turco et al. (2017) |
| Residual moisture (–) | 0 | Turco et al. (2017) | |
| Saturated moisture (–) | 0.43 | Typical value | |
| (van Genuchten) (cm−1) | 0.27 | Turco et al. (2017) | |
| (van Genuchten) (–) | 2.41 | Turco et al. (2017) | |
| Subsoil (clay loam) | Hydraulic conductivity (cm/min) | 0.01 | Typical value |
| Residual moisture (–) | 0.078 | Typical value | |
| Saturated moisture (–) | 0.43 | Typical value | |
| (van Genuchten) (cm−1) | 0.036 | Typical value | |
| (van Genuchten) (–) | 1.56 | Typical value |
We used automatic calibration with built-in inversion solutions in HYDRUS-2D, defining our calibration criteria by setting a maximum of 20 iterations and using the coefficient of determination (R2) to assess fit between model predictions and observed data. The algorithm stopped at this iteration limit or when further iterations did not significantly improve R2, ensuring efficient parameter space exploration and optimal solution convergence. The domain was discretized into 50-cm meshes, with a refinement to 5-cm in near-surface areas experiencing rapid changes in hydraulic gradient. To ensure a high-quality mesh, the maximum number of meshing iterations was set to 10, resulting in a total of 8532 meshed elements.
2.3.2 Stability-analysis model
The domain of the stability-analysis model was almost identical to that of the hydrological model, with additional inclusion of impermeable rock. Two-sided and lower boundaries of the model domain were treated as the sliding pin and the smooth pin, respectively. Specifically, the sliding pin only provided constraints on horizontal displacement, while the smooth pin provided constraints both on horizontal and vertical displacement. Underdrains and impermeable rock were treated as rigid bodies. The model assigned a saturated unit weight to the soil below the groundwater and a dry unit weight to the soil above the groundwater.
The parameters in slope-stability model were not calibrated as the FoS is determined as a ratio between resistant and driving moments, which cannot be directly measured using on-site equipment. Prioritizing hydrological accuracy and utilizing reasonable estimates of soil geotechnical properties help to ensure reliable predictions of slope stability. In Table 3, we provide a comprehensive list of geomechanical properties of the soils. These values were acquired through a combination of in-situ measurements, literature references, calculations based on related parameters, and typical values for each soil type.
| Soil layer (soil type) | Geomechanical parameters | Values | Source |
|---|---|---|---|
| Engineering soil (loamy sand) | Dry unit weight (kN/m3) | 12.84 | Measurement |
| Saturated unit weight (kN/m3) | 17.9 | Calculations (porosity and dry unit weight) | |
| Angle of internal friction (°) | 29 | Typical value | |
| Cohesion of soil (kPa) | 5 | Typical value | |
| Storage (# 57 aggregate) | Dry unit weight (kN/m3) | 19.5 | Measurement |
| Saturated unit weight (kN/m3) | 23.5 | Calculations (porosity and dry unit weight) | |
| Angle of internal friction (°) | 44 | Abdi and Mirzaeifar (2017) | |
| Cohesion of soil (kPa) | 0 | Abdi and Mirzaeifar (2017) | |
| Subsoil (clay loam) | Dry unit weight (kN/m3) | 13.23 | Measurement |
| Saturated unit weight (kN/m3) | 17.4 | Calculations (porosity and dry unit weight) | |
| Angle of internal friction (°) | 24 | Typical value | |
| Cohesion of soil (kPa) | 14 | Typical value | |
| Impermeable rock | Unit weight (kN/m3) | 25 | Typical value |
2.3.3 Simulation scenarios
Site conditions such as rainfall patterns, groundwater table levels, soil properties, and slope angles significantly impact subsurface hydrology and slope stability (Bordoni et al., 2015; Zhang et al., 2011). However, in the context of slopes with LID systems, it is important to shift the focus from just the rainfall pattern to the runoff volume. The runoff volume is intricately linked to both rainfall patterns and the characteristics of the drainage area. Furthermore, LID systems are typically implemented on less-permeable slopes to enhance infiltration, and clayey slopes are a primary focus in this study. For this research, the key factors of interest are the initial groundwater table positions, slope angles and inflow volumes corresponding to different size of drainage areas, that is, the capture ratio.
This study primarily focused on the most critical situation (i.e., the largest storm event), and therefore, it focused on analysing the storm event from 2013-05-05 to 2013-05-12. One month of data before the event was used for hydrological model calibration, while the data of the following month were used for validation. Since the groundwater table profile was not measured on-site, we made the assumption that the initial condition was parallel to the impermeable rock, a common practice in previous studies (Picarelli et al., 2004; Zhan et al., 2013). Referring to the model setting on the same BCs (Alikhani et al., 2020), the groundwater table was initially set at 4 m below the bottom of the BCs. We compared the soil moisture at a 15-min resolution in the lower cell between observations and simulations using the Nash-Sutcliffe coefficient (NSE) and R2 as a test of goodness of fit.
We then used the validated model to compare the subsurface hydrology and associated slope stability with and without LID installation under varying groundwater table positions and slope angles. The shallow groundwater, located 1–3 m below BCs (Zhang & Chui, 2017), can be caused by continuous exfiltration from BCs or baseflow from upstream. Accordingly, we set the initial groundwater table to be 2 m below the BCs (shallow groundwater) in another scenario. Furthermore, as previously mentioned, we considered three generic slope angles of 15°, 20°, and 25° for analysis. Additionally, we examined two inflow volumes corresponding to the original size and half size of the drainage areas, henceforth referred as original inflow volume and half inflow volume.
2.3.4 Observations
We placed observation points within the model domain to monitor groundwater dynamics. In slopes without BCs, the rainfall was uniformly applied on the slope surface and a single central point 1′ was considered sufficient to capture groundwater fluctuations (Figure 3a). We examined the stability of the non-LID slope, focusing on the moment (T1′) when the observation point 1′ read the maximum groundwater pressure. For slopes with BCs, where exfiltration mainly occurred near these features, we positioned three observation points (Point 1, Point 2, and Point 3) beneath the BCs and the middle of the slope to monitor the evolution of groundwater, as Figure 3b shows. These three points recorded pressure heads, correlated with the vertical extent of the groundwater mound. As the groundwater table dynamically changed, we selected three representative moments (T1, T2, and T3) corresponding to the highest vertical extent at Point 1, Point 2, and Point 3, respectively, for further slope-stability analysis.
3 RESULTS
3.1 Model calibration and validation
The calibrated values were as follows: 0.08 cm/min for the saturated hydraulic conductivity and 0.52 for the saturated moisture content of the engineering soil, and 19.2 cm/min for the hydraulic conductivity of the gravel aggregate. The simulated and observed soil moisture showed close agreement with NSE near 0.61 and 0.72 and R2 near 0.65 and 0.73 during calibration and validation, respectively (Figure 4). Major disagreements were observed in the peak and recession limb of soil moisture, which can be attributed to the absence of ponding and evapotranspiration in the simplified BC model. Nevertheless, the numerical model provides an accurate simulation of the hydrological response of BCs to storm events overall.
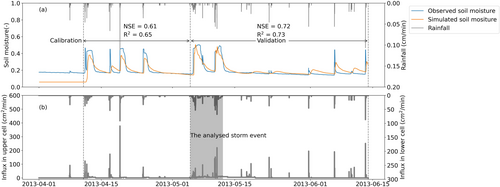
The discrepancy in initial moisture between simulated and observed data is mainly attributed to two factors: the simplified representation of the initial groundwater table and the absence of a model warm-up period, both key to defining antecedent conditions. However, these simplifications have a minimal impact on the overall findings of this study. The antecedent condition has been incorporated as a potentially explored variable as the groundwater table position changes.
3.2 The impact of cut and fill
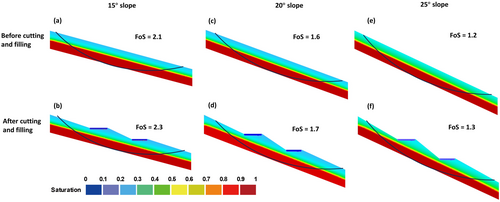
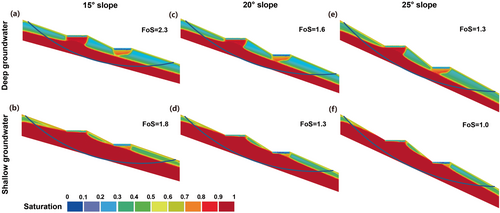
This section reports the impact of cut and fill operations on slope stability under deep-groundwater conditions (i.e., 4 m blow BCs). The slope stability could be enhanced through cutting and filling slopes, as evidenced by the increase of FoS. As shown in Figure 5, the FoS increased from 2.1, 1.6, and 1.2 to 2.3, 1.7, and 1.3 for slopes of 15°, 20°, and 25° after the cut and fill processes, respectively. However, it is important to note that the stability improvement was somewhat limited, with the maximum increment being 0.2. Additionally, for the 25° slope, the cut and fill process did not raise the FoS above the safety threshold of 1.5. Note that a FoS of 1.5 is generally considered an acceptable threshold for engineering projects as it provides a reasonable safety margin to account for uncertainties related to material properties, loading conditions, and other factors.
3.3 The evolution of groundwater mound
Figure 6 shows the changes in pressure heads over time at three observation points. Regardless of the slope angle and initial groundwater position, a consistent pressure head evolution trend was evident across all scenarios. Point 1 reached the highest peak pressure head initially, followed by Point 2, and subsequently by Point 3, as illustrated by Figure 6. This trend allowed for a qualitative assessment of the location and shape of groundwater mounds, as the point with the highest pressure head tended to be closer to the mound's peak.
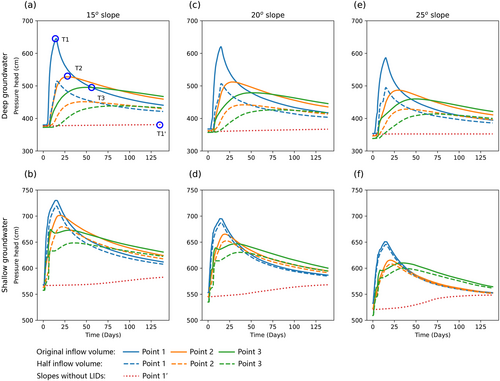
Furthermore, Figure 6 demonstrates that the pressure head at Point 1, initially the highest, gradually becomes surpassed by the pressure head at Point 2 and, ultimately, Point 3. This intriguingly indicated the migration of the groundwater mound toward the downslope. Simultaneously, the lines representing the pressure heads for each point in each subplot gradually converged over time, signifying a reduction in head differences. This convergence suggested that the groundwater mound was becoming flatter as a result of dissipation. Toward the end of the simulation, the pressure heads at all three observation points exhibited a gradual decline. However, they still maintained relatively high levels compared to the initial groundwater table, indicating a lingering presence of groundwater mounds.
When the inflow volume was reduced from its original size to half size, the pressure heads at these observation points were significantly lowered under deep-groundwater conditions. As illustrated in Figure 6a, reducing the inflow to half its original volume decreased the peak pressure head at Point 1 by 1.5 m, indicating a more flattened groundwater mound. In contrast, under shallow groundwater conditions, the difference in pressure head increases between the original and half inflow volumes was not significant.
Characterizing the groundwater mound evolution aided in identifying moments of high slope instability risk. As previously mentioned, the results from the peak pressure head readings at three points during T1, T2, and T3 were input into the stability analysis model. For slopes without BCs, observation point 1′ did not witness a significant change in the groundwater level, and the T1′ was the moment near the end of the simulation.
3.4 The impact of groundwater mound
3.4.1 15° slope
This section focuses on the changes in stability associated with the evolution of the groundwater mound within the 15° slope when BCs received the original inflow volume. Across all conditions (Figure 7), the FoS consistently remained above the safety threshold of 1.5, with the potential slip surface maintaining a relatively stable position. However, the stability of the slope was notably affected by the presence of the groundwater mound. As shown in Figures 5b and 7a, the FoS declined from 2.3 to 2.1 with the emergence of the groundwater mound. Nevertheless, the subsequent dissipation and migration of the groundwater mound did not significantly impact slope stability, as evidenced by the relatively constant value of FoS (i.e., 2.1) shown in Figure 7a,c,e.
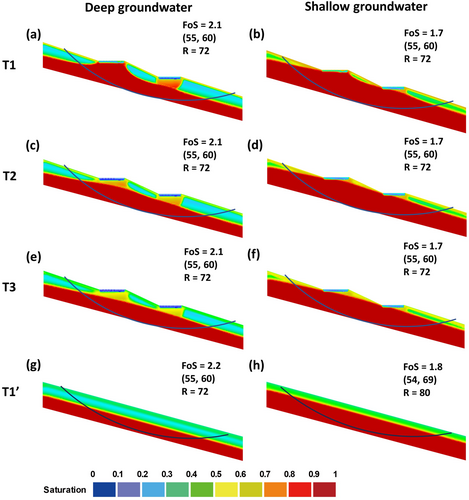
In the combination of the effect from cutting and filling operation (stabilization) and groundwater mound (destabilization), the implementation of BCs minimally impacted the slope stability, with FoS being 2.1 and 2.2 for 15° slopes with BCs and without BCs (Figure 7a,g). A similar trend was also observed in shallow-groundwater conditions (Figure 7b,d,f,h), but the FoS of 1.7 was generally lower than that of 2.1 in deep-groundwater conditions.
3.4.2 20° slope
This section examines the stability of the 20° slope in response to the evolving groundwater mound when the BCs were subjected to the original inflow volume. The FoS reached 1.5 and 1.6 under shallow-groundwater conditions, barely meeting the 1.5 safety threshold, while it fell short at 1.3 under deep-groundwater conditions, failing to meet the threshold. The potential slip surface remained consistent across all conditions. Additionally, the formation of groundwater mound resulted in a reduction of the FoS from 1.7 to 1.5, as depicted in Figures 5d and 8b. However, the following groundwater mound evolution did not significantly impact the FoS. It was marginally improved from 1.5 to 1.6 under deep-groundwater conditions and remained constant at 1.3 under shallow-groundwater conditions.
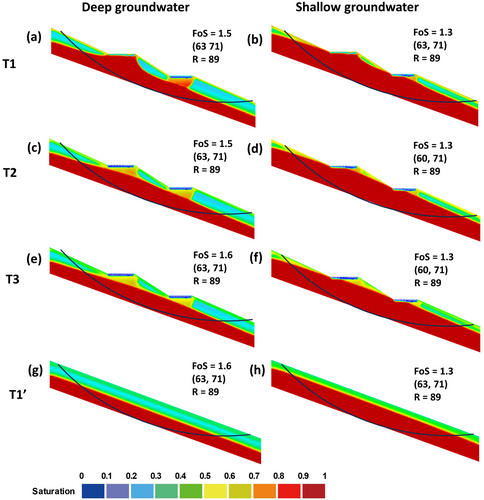
Ultimately, the minimum FoS of the LID-installed slope and non-LID slope after the rainfall storm exhibited no significant difference, with values being 1.5 and 1.6 under the deep-groundwater condition (Figure 8a,g), and the same value of 1.3 under the shallow-groundwater condition (Figure 8b,h).
3.4.3 25° slope
When BCs on 25° slope received original inflow volume, the FoS consistently fell below the safety threshold of 1.5 across all groundwater conditions, while the potential slip surface remained unchanged, as shown in Figure 9. In addition, the formation of the groundwater mound minimally reduced the FoS from 1.3 to 1.2 for slopes with deep groundwater, as Figures 5f and 9a show. As the groundwater mound dissipated and migrated downslope, the FoS maintained a consistent value of 1.2 (Figure 9a,c,e) under deep groundwater conditions. Similarly, the FoS remained constant at 1.0 throughout the evolution of the groundwater mound under shallow groundwater conditions.
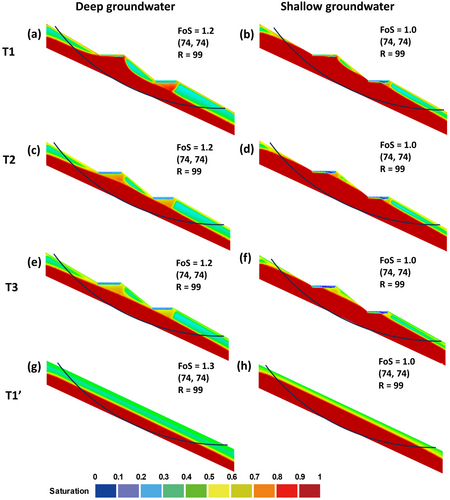
After a storm event, there was no significant difference in the FoS between slopes with and without BCs, with values of 1.2 and 1.3, respectively, in deep-groundwater conditions (Figure 9a,g) and both had a FoS of 1.0 in shallow-groundwater conditions (Figure 9b,h).
3.4.4 Inflow volume
Figure 10 shows the FoS of slopes associated with the groundwater mound at the moment of T1 when BCs received the half inflow volume. Under shallow conditions, the FoS is slightly enhanced by at least 0.1 when halving the flow volume, with values varying from 2.1 to 2.3 (Figures 7a and 10a), 1.5 to 1.6 (Figures 8a and 10c), and 1.2 to 1.3 (Figures 9a and 10e). However, reducing the inflow volume did not significantly improve the stability of slopes with shallow groundwater.
4 DISCUSSION
This section discusses and explains the effects of LID on slopes, focusing on how it influences subsurface flow and slope stability under various conditions, including different slope angles and initial groundwater positions.
4.1 Subsurface hydrology
The stepped form of LID, characterized by multiple cells (or steps) built in series along slopes, is typically suited for slope implementation. The representative LID practice in this study is a two stepped BC setup. The upper cell, positioned at a higher elevation within the stepped sequence, received a disproportionately higher volume of inflow—five times more than the lower cell during the storm event analysed. This resulted in a pronounced groundwater mound forming beneath the upper cell, as evidenced by a significant rise in pressure head at Point 1. Conversely, the groundwater mound beneath the lower cell was less pronounced, indicated by a smaller increase in pressure head at Point 3. The unbalanced water distribution among cells of stepped BCs has been reported by Chen and Chui (2022).
Consistent with the findings of Mahdavi (2015), the groundwater mound gradually dissipated and migrated downslope after the storm event. This dissipation was primarily driven by the hydraulic head difference, which led to the flattening and spreading of the groundwater mound. Over time, dissipation slowed as the head difference was minimized. The migration was likely driven by the bulk motion of the base flow. Notably, the pressure heads at the three points did not return to their initial values even after a 130-day simulation, suggesting that complete dissipation may require a prolonged duration, as also noted by Zhang and Chui (2017). If BCs experience several consecutive storms, it is likely that the slope will maintain an elevated groundwater table throughout the entire period.
4.2 Slope stability
The implementation of LIDs had a minimal impact on slope stability during a storm event, primarily due to the combined effects of cutting and filling operations and groundwater mounding. The cutting and filling of a slope to accommodate BCs slightly enhanced the stability with the FoS increment being 0.1–0.2. This improvement might be related to the soil mass redistribution. Following the upslope soil mass excavation and subsequent filling downslope, there was a reduction in the driving moment attributable to the soil mass located upslope of the slip surface centre, while concurrently, an increase was observed in the resistant moment associated with the soil mass located downslope of the slip surface centre. As a result, the slope became more stable than before. However, the impact was minimal due to the limited transfer of surface soil mass from upslope to downslope. These findings aligned with stabilization methods commonly used in road construction in mountainous areas (Abramson et al., 2001).
The presence of groundwater mound to some extent destabilized the slope, leading to a maximum reduction of 0.2 in FoS. Infiltrated water increased the pore water pressure and reduced the effective stress of soil. Since the location and radius of the potential slip surface remained nearly constant, the amount of groundwater enclosed by the slip surface determined the magnitude of the FoS. Despite localized rising groundwater, the groundwater mound would still increase the enclosed groundwater amount, thereby reducing the slope stability. However, the reduction in FoS due to groundwater mound was less significant when compared to the overall rise from deep to shallow groundwater table. For instance, we observed FoS values of 2.1 and 1.7 for 15° slopes in shallow and deep groundwater conditions, respectively, highlighting the varying amounts of enclosed groundwater (Figure 7a,b). Additionally, there was no discernible difference in FoS during the evolution of the groundwater mound. This was because the evolution primarily involves the transformation of a high and narrow mound into a flatter and wider one, without significant groundwater leaving the slip surface.
Due to the combined effect of cutting and filling operations and the groundwater mound, the LID implementation on slopes resulted in a marginal FoS reduction of approximately 0.1 for the 15° slope and no significant changes of FoS for the 20° and 25° slope, as Figure 11 shows. The concern about creating a steeper slope in the middle through cutting-and-filling techniques was less significant as it was not easy for groundwater to fully saturate this area. It was considered generally safe to implement LIDs on a 15° slope as the FoS is above 1.5 even in the most unfavourable conditions with a shallow groundwater table (Figure 11). However, the stability of a 20° slope with LIDs is significantly influenced by groundwater levels, and it may fail to meet safety standards under conditions of shallow groundwater. Implementing LIDs is not advisable on a 25° slope as it cannot ensure safety.
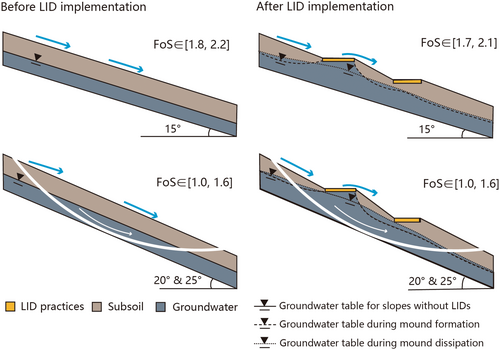
The installation of LID on sloped areas or embankments variably affects slope stability, influenced by differences in slope size, steepness, and the positioning of LID relative to slopes. Extensive sloped areas, which are generally less steep than embankment slope, experience minimal stability reduction when LID is implemented with appropriate earthwork modifications. However, on small-scale, steep embankments, LID installation significantly reduces stability, evidenced by a 19% reduction in the FoS (Zukowski & Welker, 2017) and increased stress at the slope toe (Tang et al., 2021). Positioning LIDs at a distance from the slope, such as the 4 m recommended by Zukowski and Welker (2017), can help maintain stability.
4.3 Implications to design of stepped BCs
The key design parameter is the capture ratio that controls the runoff volume into the LIDs. The stepped BCs originally followed the typical design with a capture ratio of approximately 9, falling within the recommended range of 5–15 (Rossman, 2010). For slopes less than 15°, a standard LID design can be applied as these slopes inherently maintain stability even when nearly saturated, and there is no need to adjust the capture ratio. However, for slopes exceeding 15°, a reduction in the capture ratio is advisable as the half volume inflow enhanced the FoS by at least 0.1. Nonetheless, the extent of this improvement is limited by groundwater conditions, as the influence of groundwater table positions predominates over inflow volume adjustments.
4.4 Limitations and future work
This work involved simplifications in the soil condition and the initial groundwater table. The subsoil was simplified as a homogeneous isotropic medium. In reality, with the soil depth exceeding 9 m, the geologic stratification frequently results in multi-layered groundwater mounds (Lu et al., 2021). The actual geological structure is more complex, including impermeable rock layers, and the initial groundwater table is not uniform. In addition, this research only studied a single storm event. Over prolonged storm durations, the groundwater table may gradually rise due to continuous exfiltration. This rise in the groundwater table could potentially transform a stable slope into an unstable one, as demonstrated by the case of the 20° slope.
Future work can focus on long-term simulations, which are less sensitive to initial conditions and yield more realistic results. Exploring the impact of the size and characteristics of storm events represents another valuable direction. Additionally, implementing and monitoring LIDs on slopes in reality is highly desirable. A crucial next step involves providing specific LID design recommendations, with particular emphasis on the capture ratio. For less gentle slopes, the key is to adjust the capture ratio to ensure stability while minimally compromising hydrological performance. However, an important question to address in future research is the cost-effectiveness of such design adjustments.
5 CONCLUSIONS
Concerns about slope stability have limited the implementation of LID practices on slopes. However, the increasing demand for LIDs in mountainous cities necessitates a closer examination. In this study, we investigated the evolution of groundwater mounds and the impact of slope cutting, filling, and groundwater mounds on slope stability using the HYDRUS-2D numerical model. We calibrated the model using data from two-stepped BCs in Cincinnati, Ohio, USA. To pinpoint critical scenarios, we conducted an extensive analysis, focusing on a large storm event. This analysis encompassed slopes with various angles (15°, 20°, and 25°) and initial groundwater table positions.
The implementation of LIDs on slopes inevitably involved cutting and filling operations unless additional reinforcement was installed. These cutting and filling operations slightly enhanced slope stability, increasing the FoS by 0.1, as they redistributed the soil mass in a more stable manner. Exfiltration from LIDs contributed to the formation of groundwater mounds, subsequently reducing slope stability with a 0.2 decrease in FoS. The subsequent dissipation and migration of groundwater mounds maintained consistent slope stability over an extended period. Due to the combined effect of the cutting and filling operation and groundwater mound, the implementation of LIDs on slopes was likely to result in a marginal decrease in stability during a storm event.
The 15° slope was inherently stable even when nearly saturated and was considered safe and suitable for LID implementation. For a slope exceeding this angle, special design considerations should be made. A key parameter is the capture ratio, which controls the runoff volume directed into the LID practices. Reducing the capture ratio can balance the trade-off between hydrological performance and slope stability, especially under the deep groundwater condition.
ACKNOWLEDGEMENTS
This work was funded by the Environment and Conservation Fund (ECF) Environmental Research, Technology Demonstration, and Conference Projects Funding Scheme (Project Number: ECF Project 154/2020). The authors are grateful to Mr. Robert Darner in the Ohio-Kentucky-Indiana Water Science Center for providing monitoring data.
Open Research
DATA AVAILABILITY STATEMENT
The data that support the findings of this study are available from the corresponding author upon reasonable request.


