Naturalizing the freezeup regimes of regulated rivers and exploring implications to spring ice-jam flooding
Abstract
Naturalization of the flow hydrograph and ice regime is a key step in assessment of ecological and socioeconomic impacts of regulation across large portions of Europe, Asia and North America, where many rivers are dammed for hydropower generation. Building on previous naturalization of early-freshet flows that influence the nature of breakup and jamming events, novel methodology is developed to estimate natural freezeup flows and thence determine associated water levels, also known to influence subsequent breakup events. Using reservoir inflows, the new methodology is applied to the lower portion of the regulated Peace River, Canada, which forms the northern boundary of the Peace-Athabasca Delta (PAD), a Ramsar wetland of international importance that partially depends on spring ice-jam flooding for recharge of its high-elevation, or “perched” basins. The PAD provides habitat for numerous aquatic, terrestrial and avian species and is vital to the maintenance of indigenous culture and lifeways. Naturalized freezeup levels in the lower Peace River are shown to be nearly always lower than corresponding regulated values, with the difference averaging ~1.6 m. Consistent with known physics of river ice breakup processes, the present results suggest that ice-jam flood frequency would likely have been greater under natural conditions. Though potentially adverse from the ecological standpoint, reduction of spring ice-jam flooding can benefit riverside communities. Implications of the present results to and comparison with, other Canadian and international rivers are discussed.
1 INTRODUCTION
Downstream impacts of large hydropower dams are not as well understood as upstream impacts, especially in areas situated at long distances from a dam (Baird et al., 2021). Across large regions of Europe, Asia and North America, rivers form seasonal ice covers while many of them are dammed for hydropower generation (Huokuna et al., 2020). In such instances, the impacts of regulation are more complex than in ice-free rivers because they arise from changes to the flow and water level hydrographs, as well as to the ice regime. Quantitative assessment of regulation impacts can be made via reconstruction of relevant flow, level and ice-related indices, as they would have been under natural conditions in each year of the post-regulation record (naturalization). Herein, novel methodology is developed to naturalize relevant controlling factors downstream of hydropower dams and thence enable assessment of their impacts on ice-jamming processes. This methodology is demonstrated by application to a drying ecosystem of national and international significance (Baird et al., 2021).
The Peace-Athabasca Delta (PAD) in northern Alberta, Canada, is one of the world's largest inland freshwater deltas, home to large populations of waterfowl, muskrat, beaver and free-ranging wood bison. The delta region has been designated a Ramsar wetland of international importance and is largely located within the Wood Buffalo National Park (WBNP), a UNESCO World Heritage Site (WBNP, 2019). Indigenous residents have depended on the delta for centuries to sustain their culture and lifeways (Parks Canada, 2011). During the past five decades, this complex and dynamic ecosystem has, in-between overland flooding events, experienced prolonged periods of drying under prevailing semi-arid climate conditions, leading to considerable reductions in the area covered by lakes and wetlands that provide habitat for aquatic life. Along with regional warming of air temperatures (Zhang et al., 2019) and generally decreasing winter snowfall over a key portion of the Peace River basin (Beltaos, 2019a; Prowse & Conly, 1998), extended periods of drying in sectors of the delta coincide with the construction, filling (1968–71) and operation (1972 onwards) of the large W.A.C. Bennett hydroelectric dam and Williston Reservoir in British Columbia, located some 1200 km upstream of the PAD (Figure 1). Hereinafter, the word “dam” refers to the W.A.C. Bennett Dam, unless otherwise specified.
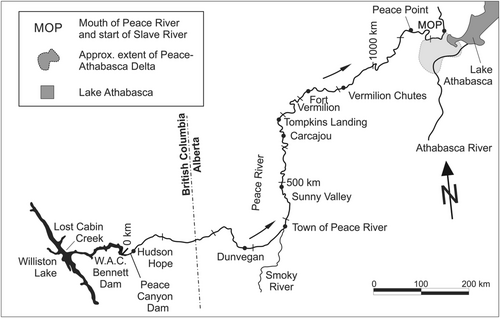
Concern over the long-term health and sustenance of PAD ecosystems is underscored by climate change and future construction of more dams (the approved Site C and proposed Dunvegan Dams are to be located ~85 and 275 km downstream of the Peace Canyon dam, respectively; Jasek & Pryse-Phillips, 2015). As a result of a UNESCO Monitoring Mission report (2017), prompted by a petition from Indigenous Peoples, Canadian federal and provincial authorities commissioned a strategic assessment (IEC, 2018) of the Wood Buffalo National Park (WBNP). This assessment culminated in development of the WBNP Action Plan (2019), which incorporated Indigenous knowledge, to address several recommendations towards preserving the ecological integrity of this important World Heritage Site.
Physics-based research has indicated that the combined effects of flow regulation and climatic variations have contributed to inhibiting the formation of extensive spring ice jams that trigger much of the delta floodplain inundation (Beltaos, 2019a; Beltaos et al., 2006; Peters, Prowse, Pietroniro, & Leconte, 2006; Prowse & Conly, 1998). Based largely on paleolimnological evidence, other researchers have disputed the effect of regulation on the frequency of spring ice-jam flooding of the Peace Delta (e.g., see comprehensive discussion (Hall et al., 2019; Timoney et al., 2019) and rebuttals (Beltaos, 2019b)).
To meet increased fall/winter energy demand in cold regions, regulated reservoir releases for hydropower generation generally augment freezeup flows and raise associated water levels. As discussed by Beltaos (2019a), spring breakup ice-jam occurrence in the PAD reach of Peace River can be inhibited by high water levels during the antecedent freezeup event. In general, the higher the freezeup level, the higher is the resistance of the winter ice cover to dislodgment and mobilization by the rising spring flow. Along the Peace River, where the breakup front often advances in a series of stalls (jams) and releases (ice runs), high resistance tends to enhance the residence time of ice jams and reduce the length travelled by each ice run (Beltaos & Carter, 2009). This results in more frequent and prolonged jamming, allowing more time for thermal degradation of the stationary ice cover downstream, and melt of ice rubble at the head, of each jam. This may result in minimal volumes of ice rubble entering the delta reach of the river, thereby limiting the length and flooding potential of any ice jams that may form.
Prowse and Conly (1998) suggested that regulation-induced high freezeup levels had played a role in the diminished frequency of ice-jam flooding, while Timoney (2013) stated that, in addition to other factors, a freezeup elevation under 214 m amsl (CGVD1928) near Peace Point (Figure 1) is a favourable condition for the occurrence of an ice-jam flood (IJF). Moreover, Beltaos (2019a) showed that the chances of ice-jam flooding increase as the freezeup level decreases; and that the higher the freezeup level, the greater is the breakup flow that is required to generate an IJF. This was further exemplified by the 2020 ice breakup event, which produced minimal jamming near the delta, despite extreme early-freshet flows; antecedent hydrometric data indicated exceptionally high freezeup levels at Peace Point, Fort Vermilion and Carcajou (Figure 1), consistent with large reservoir outflows during the fall of 2019 (Beltaos & Carter, 2021).
Apart from morphologic and thermal factors, the resistance to breakup also depends on the maximum thickness of the ice cover, which is attained towards the end of winter. For the lower Peace River, little change is apparent between pre- and post-regulation thickness values (Beltaos, 2019a), while Beltaos and Carter (2009) showed that the role of ice thickness in breakup initiation is less pronounced than that of the freezeup level.
To reconstruct the natural IJF regime, as it would have been during the period of regulation, naturalized time series of both breakup flow and freezeup level are needed. Beltaos and Peters (2020) were able to reconstruct natural breakup flows using the lagged-flow method (LFM), which postulates that flows occurring far upstream of Peace Point arrive at this site unchanged after a certain travel time or lag. This assumption derives from the basic hydrodynamics of kinematic waves and was validated by comparing the results of the LFM to those of detailed numerical modelling applications (Beltaos & Peters, 2020). In principle, naturalized freezeup flows can also be determined using the LFM, but this has not yet been demonstrated, while derivation of freezeup levels from freezeup flow hydrographs also requires development of an effective algorithm.
Consequently, the first objective of this paper is to develop rigorous methodology for computing naturalized flows and associated water levels during late fall and early winter using the LFM. A second objective is to quantify the effects of regulation on freezeup levels in the lower Peace River. Once naturalized freezeup levels are at hand, implications of the results to the naturalized frequency of IJFs can, as a third objective, be explored.
2 DATA SOURCES AND METHODOLOGY
2.1 Reservoir inflows
Daily reservoir inflows starting on 2 January 1969 and ending on 29 August 2017 into the Williston Reservoir/Bennett Dam complex were used in this study. The computational procedure used to generate these inflows, which are important to the safe and efficient operation of such hydro-electric facilities, has been independently corroborated by Peters and Prowse (2001). Of particular interest to the present study is the November inflow, which is the main contributor to the freezeup flow >1000 km downstream in the delta reach of Peace River. A Mann-Kendall test for the period 1972–2016 indicated no significant temporal trend in average November inflow; the same was found for the average inflow during the early part of November (first week and first 2 weeks), which may be more relevant to freezeup near the delta, since the latter typically occurs in the second half of November.
2.2 Computation of naturalized freezeup flows at Peace Point
The largest flow entering the northern sector of the PAD is captured by the Water Survey of Canada (WSC) gauge on the Peace River at Peace Point (Figure 1), located 1136 km below the dam and about 60 km upstream from the entrance to the delta reach of the Peace River. To determine naturalized breakup flows at Peace Point, Beltaos and Peters (2020) first computed “net outflow” from the dam, defined as flow at Hudson Hope (see Figure 1 and Table 1) minus inflow; the net outflow quantifies the effect of regulation on flow at Hudson Hope. Lagged net outflows were then subtracted from observed (regulated) values at Peace Point to find the local naturalized flows; good agreement was found with independently modelled (Peters & Prowse, 2001) natural breakup flows. The lag was initially set at 7 days, which is the expected interval for open-water conditions and typical breakup flows. Because a portion of the reach between the dam and Peace Point may still be ice covered while dam inflows are in transit, a lag of 8 days was also examined as an alternative and possibly more realistic, scenario. Reference to natural breakup flows in subsequent text will imply data based on the 8 days lag.
| Station name | Gauge number and period of record | Gross drainage area (km2) | River chainage of site or of tributary moutha (km) | Total river distance of gauge station to Peace Point gaugeb (km) | Time lag, gauge station to Peace Point; closest integer (days) |
|---|---|---|---|---|---|
| Peace R. at Hudson Hope | 07EF001 | 73 100 | 30 | 1106 | 12 |
| 1917–2016 | |||||
| Halfway R. near Farrell Creek (lower station) | 07FA001 | 9400 | 66 | 1093 | 12 |
| 1961–1983 | |||||
| Halfway R. near Farrell Creek | 07FA006 | 9340 | 66 | 1075 | 12 |
| 1984–2014 | |||||
| Beatton R. near Fort St. John | 07FC001 | 15 600 | 143 | 1027 | 11 |
| 1961–2018 | |||||
| Pine R at East Pine | 07FB001 | 12 100 | 122 | 1109 | 12 |
| 1961–2016 | |||||
| Smoky R at Watino | 07GJ002 | 50 300 | 389 | 818 | 9 |
| 1915–2017 (with gaps) | |||||
| Wabasca R. at Highway No. 88 | 07JD002 | 35 800 | 886 | 369 | 4 |
| 1970–2018 | |||||
| Peace R. at Peace Point | 07KC001 | 293 000 | 1136 | 0 | 0 |
| 1959–2017 |
- a River distance below the Bennett dam, per 1 km markings on a Google Earth .kmz file used by Alberta Environment and Parks for river ice monitoring; may differ slightly from values mentioned in previous publications.
- b Includes distance along tributary from the gauge to the confluence with Peace River.
For freezeup, the time lag was set at 12 days, based on the hydraulics-derived proportionality (Beltaos & Peters, 2020) to Q-0.40 (Q = flow) and on typical freezeup and breakup flows of 1000 and 4000 m3/s, respectively (7 days × (1000/4000)-0.40 = 12.2, rounded off to 12 days). Application of the Beltaos and Peters (2020) computational procedure often yielded good results but there were instances in which the computed natural flows were far too small or even negative. Scrutiny revealed that such gross errors were likely caused by deficiencies in the Peace Point flows reported by WSC, which sometimes were even smaller than corresponding lagged flows from Hudson Hope. Such errors derive from uncertainty as to ice effects on stage and may occasionally be significant at freezeup in percentage terms, though small at breakup owing to the greater magnitude of breakup flows.
Therefore, the computational method was modified, after ascertaining that the majority of Peace River tributaries downstream of the dam contribute negligibly small flows during late fall and early winter (caution: this does not apply to spring freshet or summer runoff conditions). In turn, this finding suggested the possibility of reliably computing Peace Point flow by adding suitably lagged inflows to lagged flows of five significant tributaries (see Table 1 for salient features of the tributary and main stem gauges). Computed daily flows at Peace Point were smoothed by the application of 3-day averaging to moderate physically implausible sharp fluctuations.
3 VALIDATION OF THE LAGGED FLOW METHOD
The adopted methodology can be tested by two different procedures: (a) comparison of computed natural flows to modelled (Peters & Prowse, 2001) natural flows at Peace Point; and (b) comparison of computed regulated flows to observed flows at the same location. The first procedure uses inflow data to obtain natural freezeup hydrographs, as already described. The second procedure uses post-regulation WSC flows at Hudson Hope (instead of inflows) to compute Peace Point flows and compare them to WSC archived data; its appeal derives from the fact that, after regulation, the Peace River at Hudson Hope remains open throughout the cold season owing to the proximity of the dam. Therefore, WSC flows at this site, which contribute the bulk of Peace Point flow during freezeup, are more reliable than WSC flow estimates under ice conditions. (Open-water flow estimates derive from reliable gauge-specific rating tables that relate flow to prevailing water level, based on numerous simultaneous measurements of flow and water level, and apply to steady- or gradually varied-flow conditions under which the water surface slope does not change appreciably with flow magnitude. Such rating tables do not apply when ice influences the water level, while development of rating tables for ice conditions is problematic because ice thickness, hydraulic resistance and potentially water surface slope, vary during the ice season).
Figure 2 shows a typical comparison between natural flows, respectively computed by numerical modelling and by the LFM. The two natural-flow hydrographs are in very close agreement, which improves as the season advances. The good agreement between the two regulated-flow hydrographs further validates the LFM and even suggests additional applications, as discussed later in this section. First 'B' indicates that ice of some form is present in the river and causes backwater at the gauge site but formation of a complete and stable ice cover can be days or weeks in the future (herein, as in hydrometric literature, “backwater” is the difference between the measured water level and the water level that corresponds to the same river flow under open-water conditions). In Figure 2 and in all subsequent figures, the depicted discharge is a daily mean value. Discrepancies between naturalized flows prior to the first-B date pertain to the timing, but correctly capture the magnitude, of the flow.
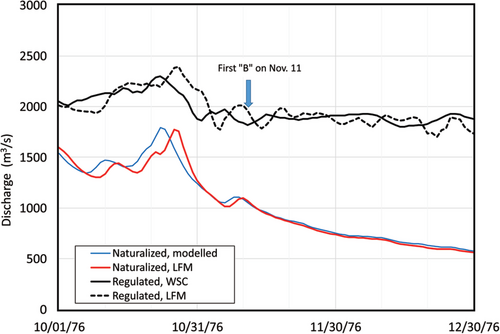
Of the 24 available naturalized hydrograph pairs (modelled data set ends in 1995–96), 11 are similar to that of Figure 2. Another 11 pairs are in good or fair agreement, as illustrated in Figure 3, in which the LFM does not reproduce some of the partial peaks generated by the numerical modelling. One of the two instances of poor agreement is illustrated in Figure 4, where the LFM is underestimating the modelled flows.
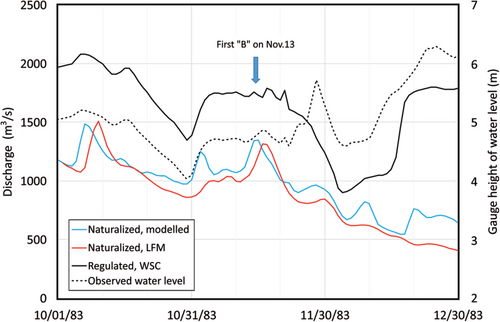
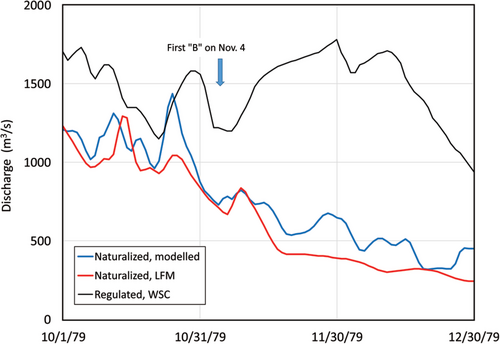
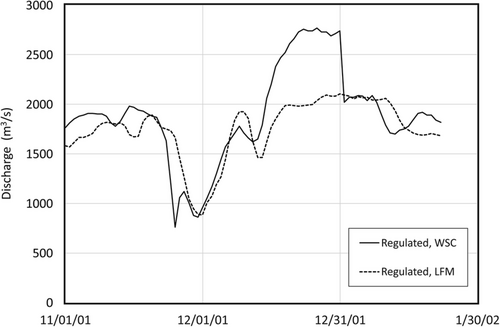
Figure 5 illustrates how the LFM can be used to corroborate and even correct archived WSC values. The sharp drop in the WSC line is puzzling: a large one-day flow decrease, preceded and followed by several days of nearly constant values cannot be explained by any known hydroclimatic process that might have occurred at that time of year; moreover, daily mean water level data indicate a < 2 cm change between 31 December 2001 and 1 January 2002. On the other hand, the LFM line provides a more plausible hydrograph and suggests that the WSC flow values in the latter half of December were overestimated, while the lower values in January are correct. Though not shown here, LFM-derived hydrographs can also fill occasional gaps in archived WSC data. Overall, the LFM is a robust method for deriving naturalized hydrographs.
4 DETERMINING NATURAL FREEZEUP FLOWS AND WATER LEVELS
Identification of the timing of freezeup under natural conditions has been largely guided by what has been observed under regulated conditions (1972–2016) because the pre-regulation Peace Point gauge record is very short by comparison (1959–1967, with gaps). Physical considerations suggest that the lower natural flows could promote slightly earlier appearance of ice in the river and formation of a stable ice cover (Andres & Van der Vinne, 1998). Attempts to correlate either one of those dates with the prevailing flow indicated large scatter and a slight negative effect, that is, ice cover forms 3 days earlier for a flow difference of 1000 m3/s. At the same time, the large scatter suggests that other factors have more pronounced effects on the date of ice cover formation, though such factors would be the same under regulated and natural conditions.
The freezeup level (HF) is defined as the maximum 7- day average value during the fall-early winter period (Beltaos, 1997). Under natural conditions, this maximum typically occurs shortly after the day of complete ice cover formation; regulation can generate a yet-higher peak, occurring several or many days later. The adopted procedure for selecting naturalized flow values that correspond to the naturalized HF comprises the following steps:
(a) identify the date of first B on the observed (regulated) stage hydrograph;
(b) examine subsequent water levels and identify the date of ice-cover formation, which is typically a partial peak or sharp inflexion point preceded by a relatively steep rise in water level, even though concurrent flows are steady or decreasing;
(c) subtract a number of days, depending on the prevailing difference between regulated and natural flow, for example, 1 day for a difference of 300 m3/s, 3 days for 1000 m3/s, etc.;
(d) determine the average naturalized freezeup flow (QF) over the 7- day period that starts on the latter date.
This equation is a simple empirical expression that closely matches slope-area calculations for the Peace Point gauge reach (Beltaos, 2011) using 0.030 for the composite-flow Manning coefficient and 0.5 m for the average draft of the ice cover. Because the Manning coefficient of the riverbed is 0.024, the Sabaneev formula (Beltaos, 2011) indicates that the coefficient of the initial ice cover would be 0.035. This value is plausible for the surface juxtaposition of ice pans and floes that form the initial ice cover of the river. Measurements by Jasek and Marko (2007) in the Peace River and by Ghobrial et al. (2013) in the regionally nearby North Saskatchewan River indicate that the assumed draft of 0.5 m for the juxtaposed ice pans and floes is a plausible average value.
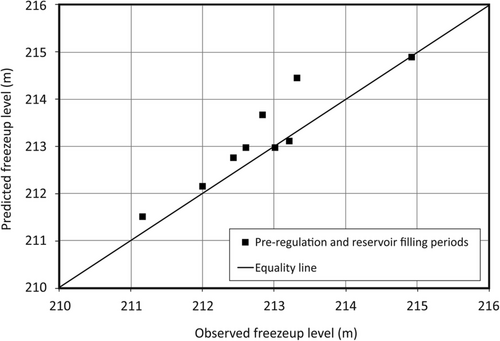
Figure 6 shows that the outlined procedure results in reasonable predictions of observed HF during the pre-regulation and reservoir filling periods (late-fall flows in the reservoir filling period are comparable to natural flows). Occasional discrepancies between predicted and observed values are typically on the high side. This could have been rectified by slightly modifying Equation (1) so that positive and negative discrepancies cancel out. However, Equation (1) is deemed optimal because negative discrepancies overstate the effect of regulation on freezeup and thence on IJF frequency. The average prediction error in Figure 6 is 0.34 m (95% confidence interval = 0.02–0.66 m).
As an example of applying the described procedure to determine naturalized flows in the post-regulation period, let us consider the 1983 freezeup (Figure 3). Daily mean water level data from WSC records (secondary axis) suggest that a complete ice cover first formed at Peace Point on November 28. At that time, natural flows were ~ 700 m3/s lower than regulated values, suggesting a 2- day earlier formation of the naturalized ice cover. Therefore, the naturalized date of ice cover formation is estimated as November 26 and the corresponding natural 7- day average flow is calculated as ~820 m3/s. According to Equation (1), the corresponding natural HF is ~212.2 m.
Regarding the quoted HF elevations, we note that WSC recently updated gauge-zero elevations of hydrometric stations located in the Lower Peace River so as to match the Canadian Geodetic Vertical Datum of 2013 (CGVD2013) with an Epoch of 2010, which was established with the latest GPS surveying methodology. For example, the elevation of gauge zero (207.121 m in CGVD1928) at the Peace Point station is now reported as 207.246 m. Herein, the 1928 datum is used, to maintain consistency with lower-Peace elevation data that have been presented in previous publications, including gauge levels, bathymetry of numerous transects and high-water marks caused by past floods.
5 RESULTS
Table 2 summarizes naturalized and observed (regulated) HF for the period of presently available data. The first column lists breakup years; associated HF occurred, in each case, in the fall of the previous year. Table entries end with breakup year 2016 because WSC flows for the Smoky River at Watino (largest tributary contribution downstream of the dam) are not available for 2016 and 2017 at the time of writing (February 2021). On several occasions, water-level data gaps rendered uncertain identification of the time when a complete ice cover formed at the gauge site. Consequently, it was only possible to estimate a range, rather than a single value, of HF, which is listed in the 4th column of Table 2. In such instances, the midpoint of the range was chosen as a fair approximation to the correct value and listed in the third column along with the less ambiguous single-valued results. This average was also used in calculating the difference from the regulated HF and in the examination of the associated time series.
| Breakup year | Regulated (observed) HF (m) | Natural or naturalized HF (m) | Range (if applicable) | Difference (m) |
|---|---|---|---|---|
| 1962 | NA | 212.60 | NA | |
| 1963a | NA | 213.32 | NA | |
| 1964 | NA | 210.76 | NA | |
| 1965a | NA | 212.16 | NA | |
| 1966 | NA | 214.92 | NA | |
| 1967 | NA | 212.83 | NA | |
| Average 1962–1967 | 212.76 | NA | ||
| 1972a | 213.01 | 211.85 | 1.16 | |
| 1973 | 213.46 | 212.82 | 212.29–213.35 | 0.64 |
| 1974a | 212.71 | 212.28 | 0.43 | |
| 1975 | 213.17 | 211.83 | 1.34 | |
| 1976 | 213.52 | 212.19 | 1.33 | |
| 1977 | 214.80 | 212.16 | 211.94–212.38 | 2.64 |
| 1978 | 214.06 | 212.13 | 1.93 | |
| 1979 | 213.33 | 213.55 | −0.22 | |
| 1980 | 212.86 | 211.44 | 210.89–211.99 | 1.42 |
| 1981 | 212.13 | 212.47 | 211.99–212.95 | −0.34 |
| 1982 | 212.48 | 211.95 | 211.37–212.52 | 0.53 |
| 1983 | 213.24 | 213.55 | −0.31 | |
| 1984 | 212.92 | 212.19 | 0.73 | |
| 1985 | 215.16 | 213.39 | 212.74–214.03 | 1.77 |
| 1986 | 214.09 | 212.40 | 212.05–212.74 | 1.69 |
| 1987 | 213.38 | Insufficient data | ||
| 1988 | 214.79 | 213.02 | 1.77 | |
| 1989 | 214.50 | 212.33 | 2.17 | |
| 1990 | 213.08 | 212.80 | 0.28 | |
| 1991 | 214.23 | 211.51 | 2.72 | |
| 1992 | 215.21 | 214.23 | 0.98 | |
| 1993 | 214.72 | 212.14 | 2.58 | |
| 1994 | 213.57 | 212.26 | 1.31 | |
| 1995 | 214.42 | 212.25 | 2.17 | |
| 1996a | 212.38 | 212.01 | 0.37 | |
| 1997a | 214.22 | 213.34 | 0.88 | |
| 1998 | 215.92 | 212.75 | 3.17 | |
| 1999 | 214.62 | 211.65 | 2.97 | |
| 2000 | 213.12 | 211.63 | 1.49 | |
| 2001 | 215.22 | 214.10 | 1.12 | |
| 2002 | 214.19 | 212.08 | 2.11 | |
| 2003 | 215.22 | 211.76 | 3.46 | |
| 2004 | 214.62 | 211.55 | 3.07 | |
| 2005 | 214.12 | 213.13 | 0.99 | |
| 2006 | 215.12 | 212.41 | 2.71 | |
| 2007 | 213.62 | 211.02 | 2.60 | |
| 2008 | 214.63 | Insufficient data | ||
| 2009 | 214.06 | 212.45 | 1.61 | |
| 2010 | 213.65 | 211.73 | 1.92 | |
| 2011 | 213.61 | 212.48 | 1.13 | |
| 2012 | 214.47 | 212.11 | 2.36 | |
| 2013 | 213.42 | 211.42 | 2.00 | |
| 2014a | 213.64 | 211.56 | 2.08 | |
| 2015 | 212.99 | 211.98 | 1.01 | |
| 2016 | 213.88 | 211.31 | 2.63 | |
| Average | 213.90 | 212.31 | 1.59 | |
- a Ice-jam flood year.
Table 2 shows that post-regulation values almost always exceed naturalized ones. On average, the effect of regulation on HF is an increase of ~1.6 m but can be as high as ~3.5 m in individual years. On three occasions within the 45 year regulated period examined, the naturalized HF exceeds the regulated value by a small amount. Unregulated natural HF values are only available for the years 1962–1967, yielding an average of 212.76 m, which is 0.45 m higher than the average naturalized HF for the period 1972–2016. This difference may be due to the small size of the pre-regulation data set and/or to climatic variability. Under natural conditions at Peace Point, typical 7- day freezeup intervals occur in or about the third week of November. Allowing for a lag time of 12 days (~2 weeks), Hudson Hope flow (the main contributor to Peace Point flow) was calculated for the first week of November up to 1967 and shown to have been unusually high during the 1960s. In turn this suggests that natural Peace Point freezeup flows and water levels were likely higher than usual during the instrumental period.
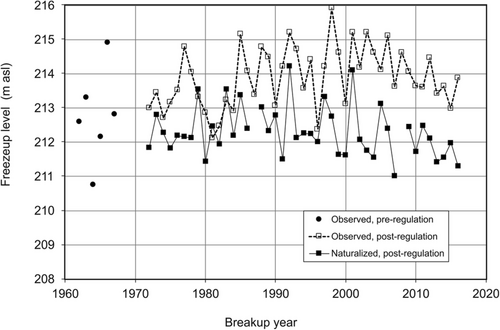
Freezeup levels from Table 2 are plotted in Figure 7, where the effect of regulation can be visually assessed. Linear regression on the naturalized time series indicated a slight negative slope of 1.35 cm/year, which is not statistically significant at the 0.05 level (p-value = 0.12). The lack of significant trend is consistent with the aforementioned lack of trend in November reservoir inflows (Section 2.1). The regulated time series indicated an overall positive, statistically significant, slope of ~2 cm/year (p-value = 0.05), though the post-2000 data points hint at a decrease rather than increase.
6 IMPLICATIONS OF RESULTS TO ICE-JAM FLOODING
As noted in the Introduction, increased HF can inhibit the formation of major ice jams in the delta reach of Peace River, thence preventing occurrence of an IJF. Herein, reference to IJFs is consistent with the designation “large” ice-jam flood in the historical compilation by Timoney (2009), who also noted “moderate” and “small" IJFs. It is the large kind that supplies sufficient water volumes to the Peace Sector for extensive overland flow that can recharge its perched basins. In this section, we explore the “naturalized” IJF regime of the lower Peace River using three different approaches.
6.1 Number of natural IJFs based on empirical probabilities
An initial estimate of the number of IJFs that might have occurred under a natural flow regime during the period 1972–2016 can be made using empirically-derived probabilities of IJF occurrence within different ranges of the HF, that is, 212–213, 213–214, 214–215 and > 215 m. The instrumental record for the period 1972–2016 (Table 1) indicates that respective probabilities are ~0.25 (2 events in 7 years; P = 2/(7 + 1) according to the Weibull formula (Makkonen, 2006)), ~0.12 (2 events in 16 years, P = 2/17), ~0.06 (1 event in 16 years, P = 1/17) and 0 (no events in 6 years). Because there are no instrumental IJF data for HF < 212, it is not possible to estimate flood probability for this range, even though HF is often between 211 and 212 m in the naturalized series. This probability is likely higher than that of the 212–213 range but is herein assumed to be the same (~0.25), to avoid over-estimation of the number of naturalized IJFs and thence exaggerate the impact of regulation. Counting the number of years in each range of the naturalized series and multiplying by the respective probabilities results in a total number of ~10 IJFs, as compared to five events that have occurred under regulated-flow conditions in our study period. In passing, it is noted that 11 natural floods would have resulted if the aforementioned probabilities had been simply calculated as number of occurrences/number of years in each set, that is, 2/7, 2/16 and 1/16.
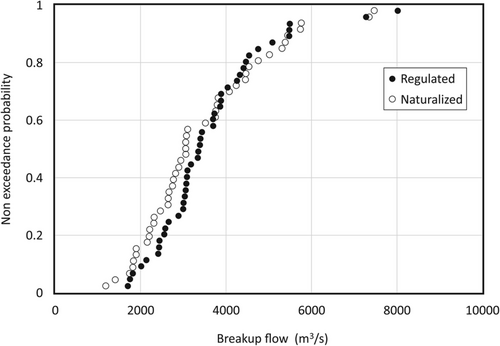
Because the aforementioned IJF probabilities derive from the regulated-period record, this initial estimate may not be rigorous if regulation has statistically altered natural breakup flows. Using the LFM, Beltaos and Peters (2020) determined naturalized daily breakup flows for the period 1972–2016 and examined three key time intervals for related events in the lower Peace River: last week of April, first week of May and second week of May. Typically, the flow rises in the last week of April and peaks during the first week of May, while breakup is usually complete by mid-May. For the first week of May, naturalized flows are, on average, slightly lower (1.5%) than regulated flows, though there can be significant differences in individual years. However, the flow that best represents potential for major ice-jam formation and flooding may not always coincide with that of the 1st week of May. Therefore, breakup flow can, more accurately, be indexed by reference to WSC's assessment of the last day with ice-caused backwater at the gauge (“last-B day”). Guided by the last-B day, the week deemed most representative of peak breakup flow in any one year was selected from among the last week of April, the 1st week of May and the 2nd week of May. The resulting regulated and naturalized time series are statistically similar, as illustrated in Figure 8. Significantly, the two distributions nearly coincide in the range of flows that can generate IJFs (>4000 m3/s; see also later discussion in this section). Regulated, unregulated and naturalized breakup flows and freezeup levels are presented as supplementary material.
6.2 Number of natural IJFs based on both freezeup level and breakup flow
Identification of specific years of the regulated period, in which an IJF might have occurred under natural conditions, can be based on simultaneous consideration of breakup flows and freezeup levels. Using data from Beltaos and Peters (2020), salient parameters of known IJFs and of years that might have produced floods under a natural regime are summarized in Table 3.
| Breakup year | Regulated HF (m) | Naturalized HF (m) | Regulated breakup flow (m3/s) | Naturalized breakup flow (m3/s) | IJF under natural conditions? |
|---|---|---|---|---|---|
| 1972a | 213.01 | 211.85 | 4529 | 4442 | Likely |
| 1974a | 212.71 | 212.28 | 8001 | 7462 | Likely |
| 1979 | 213.33 | 213.55 | 5081 | 5441 | Possibly |
| 1989 | 214.50 | 212.33 | 3689 | 5752 | Likely |
| 1991 | 214.23 | 211.51 | 3871 | 4461 | Likely |
| 1992 | 215.21 | 214.23 | 4240 | 4522 | Unlikely |
| 1996a | 212.38 | 212.01 | 5466 | 5733 | Likely |
| 1997a | 214.22 | 213.34 | 7266 | 7337 | Likely |
| 2003 | 215.22 | 211.76 | 4744 | 4750 | Likely |
| 2007 | 213.62 | 211.02 | 5483 | 5303 | Likely |
| 2013 | 213.42 | 211.42 | 3693 | 5009 | Likely |
| 2014a | 213.64 | 211.56 | 5464 | 5371 | Likely |
- a Ice-jam flood year.
The selection of years for inclusion in Table 3 was partly based on the smallest known breakup flow value that resulted in an IJF (4529 m3/s, 1972 event): it comprises years with similar or higher naturalized flows, since such flows can generate overbank flooding if a major ice jam forms in the delta reach. Based on numerical modelling, Beltaos (2003) estimated that a flow of 4000 m3/s at Peace Point could raise water levels to the bank tops in the delta reach when a sizeable jam is present. For significant flooding to occur, this value would have to be exceeded for a sustained time interval, so that the average over a period of 7 days should likely exceed 4000 m3/s. The 1972 regulated-flow value is in accord with this expectation. Consequently, a value of ~4300 m3/s (or 95% of the 1972 flow) is adopted as a practical 7- day threshold, below which significant flooding would not be expected to occur, even with an ice jam in place. For clarity, we caution that exceedance of this value implies flooding potential but does not guarantee flooding because a sizeable ice jam may not form at all, owing to high freezeup levels and/or unusual weather conditions. For example, one of the most extensive IJFs occurred in 1974 when breakup flows of ~8000 m3/s (Table 3) combined with an extended period (>10 days) of overland flow (Peters, Prowse, Pietroniro, & Leconte, 2006). By comparison, ice-jam flooding of the Peace Sector was negligible in 2020 despite comparable breakup flows (GC-WBNP, 2020); the applicable HF was exceptionally high (estimated as 214.9–215.5 m; Beltaos & Carter, 2021).
The assessment of naturalized IJF likelihood in the last column of Table 3 is straightforward for the “likely” label: it applies to natural flows that exceed ~4300 m3/s, accompanied by substantially lower natural HF than respective observed values in years when no IJF occurred. In years when an IJF did occur (e.g., 1996), even slightly lower natural HF values coupled with comparable or higher natural flows were also deemed evidence of a likely natural IJF. In the case of 1979, we have higher natural, than regulated, flow but the HF is also slightly higher; since no IJF, as defined herein, occurred in that year (smaller events were observed in distributary channels with localized flooding; Timoney, 2009), a naturalized flood occurrence is assessed as “possible” for 1979. For 1992, the naturalized HF, though considerably lower than the observed, is probably too high for an IJF: to date, only one IJF (1997) has been associated with an HF exceeding 214 m; and in that year the 7- day observed breakup flow (7266 m3/s) was much greater than the 1992 naturalized value (4522 m3/s).
In addition to the “large” IJFs being discussed herein during 1972–2016, Timoney (2009) noted occurrence of “moderate” and “small” Peace River events in 1994 and 2007, respectively. The former year does not appear in Table 3 because the associated natural breakup flow was <4300 m3/s, as was the regulated value. For 2007, a natural IJF has been labelled as “likely”, due to the considerably lower naturalized HF while the corresponding flow, though slightly lower than the regulated value, is well above 4300 m3/s.
Table 3 shows that there are 10 years in the period 1972–2016 in which occurrence of a natural IJF would have been likely. In all of these years, the naturalized resistance to breakup would have been smaller than the regulated value, meaning that ice runs from upstream reaches of Peace River would be arriving at the delta earlier, reducing the time available for melting of incoming ice rubble and for thermal deterioration of the local ice cover. Such effects enhance the chances of ice-jam formation. Similar results (10 likely natural IJFs) were obtained with a more “surgical” approach, that is, reducing the averaging interval to 5 days and selecting the highest 5- day running-average flow prior to the last-B day. The probability distributions of regulated and observed maximum 5- day breakup flows indicated similar agreement as that of Figure 8.
In response to a recommendation by an anonymous reviewer, we also explored a graphical approach for estimating the number of naturalized IJFs, as detailed in Appendix A. This approach resulted in 9–11 naturalized IJFs during the period 1972–2016 and indicated that two additional IJFs might have occurred under natural conditions after 2016.
One may recall here that the simpler approach of using empirical event probabilities, estimated via HF alone, resulted in 10 likely IJFs, consistent with the results of the more elaborate approaches. Altogether, the present results indicate that IJF frequency under natural conditions would have exceeded the observed value (five events during 1972–2016) by a factor of 2 or less. This finding is consistent with the outcome of statistical analysis of known IJF time series (Beltaos, 2018, based on Traditional Knowledge and Historical IJF records (Peterson, 1995; Timoney, 2009)).
7 DISCUSSION
The preceding sections suggest that reliable estimates of natural freezeup flows at the Peace Point gauge on the Peace River can be obtained using the LFM in conjunction with reservoir inflows and WSC derived flows of a few significant (during fall and winter) tributaries, viz. the Halfway, Pine, Beatton, Smoky and Wabasca Rivers. Naturalized freezeup flows can be translated to HF values using a site-specific freezeup rating relationship, based on local hydraulics and past hydrometric data. The present methodology can be readily applied to other regulated cold-region rivers, of which the primary tributaries are gauged. If such tributaries are not gauged, it may be possible to estimate fall/early winter flows via hydrological modelling (e.g., Rokaya et al., 2019; Toth et al., 2006), combined with targeted flow measurements for model calibration and validation. Because knowledge of reservoir inflows is important to the safe and efficient operation of a reservoir-dam complex, it is expected that such data are routinely generated by respective hydro agencies and can be used for naturalization studies.
Other factors being equal, the typically higher HF associated with the regulation of ice-forming rivers is likely to reduce the frequency of major ice jams and floods in reaches downstream of a dam. In the case of the PAD, this change is not ecologically beneficial to the perched basins of the Peace Sector, which under prevailing semi-arid climate rely on occasional floodwater inputs to maintain ponded water conditions (Peters, Prowse, Marsh, et al., 2006; Peters, Prowse, Pietroniro, & Leconte, 2006).
Post regulation decrease in ice-jam flood frequency has been mentioned as a possible factor in the drying of the Saskatchewan River Delta (Abu, 2017; PFSRB, 2009). On the other hand, such changes could reduce flood damages to communities situated along a regulated river. Experience in the Ning-Meng reach of the Yellow River, China (Chang et al., 2016) has indicated that construction of two dams (1968, 1986), has resulted in a 36% reduction in the frequency of downstream floods caused by breakup ice jams, after accounting for the effects of climate. This consequence of regulation may be enhanced, moderated or even reversed where, unlike in the lower Peace River, natural breakup flows are significantly modified. Therefore, assessing the effects of existing or proposed dams on downstream flood frequency would need to take into account changes to both freezeup and breakup flows.
An interesting by-product of this study is that naturalized HF values in lower Peace River do not exhibit a significant temporal trend during the studied period (1972–2016). A similar finding was reported by Beltaos and Peters (2020) for breakup flows. These results suggest that climate change has not yet produced perceptible impacts on the freezeup and breakup flows of the lower Peace River during the 45 year study period.
8 SUMMARY AND CONCLUSIONS
The lagged-flow method, which utilizes reservoir inflows, is validated and successfully applied to reconstruct the naturalized freezeup regime of the lower Peace River. Freezeup water levels during the breakup years 1972–2016 are decidedly lower than their regulated counterparts, by about 1.6 m on average; they exhibit a slight negative temporal trend, which is not statistically significant and largely results from a few low values that occurred between 2010 and 2016. The present methodology can also be used to generate reliable regulated freezeup hydrographs at Peace Point, identifying and potentially correcting rare errors and filling occasional gaps in hydrometric archives.
Three different approaches are applied to explore the implications of the increased HF to the frequency of ice-jam flooding and all three suggest that up to twice as many IJFs could have occurred under natural conditions during the studied period. Post-regulation reduction of the frequency of ice-jam floods has also been reported for the Yellow River, China. Caution is advised against extrapolations to other rivers without careful examination of local conditions. The present work provides robust methodology for performing such assessments.
ACKNOWLEDGEMENTS
This study was conducted with funding provided by the Climate Change adaptation (CCA) programme of Environment and Climate Change Canada. The authors thank BC Hydro for the inflow data set and related background information; and Angus Pippy of the WSC Yellowknife office for unpublished Peace Point daily mean water level data, going back to 1959.
APPENDIX A.: GRAPHICAL ASSESSMENT OF NATURALIZED IJFs
Beltaos (2019a) plotted maximum breakup discharge (Qmax) versus HF and delineated the region containing all IJF-related data points. This region encompassed breakup events associated with large Qmax and moderate or low HF, illustrating how the chances of ice-jam flooding diminish as HF increases and rise as Qmax increases. It is of interest to examine whether this kind of diagram can also be used in estimating the number of floods that would have occurred in the period 1972–2016, had Peace River retained its natural state.
Figure A1 is a similar plot to that of Beltaos (2019a), but is based on 7- day average flows rather than on Qmax, to be consistent with the data and analysis discussed in the main text. Pre-regulation data are excluded so that a comparison over strictly the same time period can be made between regulated and naturalized datasets. Known regulated data after 2016 are shown as a separate series. Two of the three data series in Figure A1 represent actual occurrences (hollow markers), deriving from the instrumental record at Peace Point. The third series represents naturalized freezeup levels and flows (solid markers).
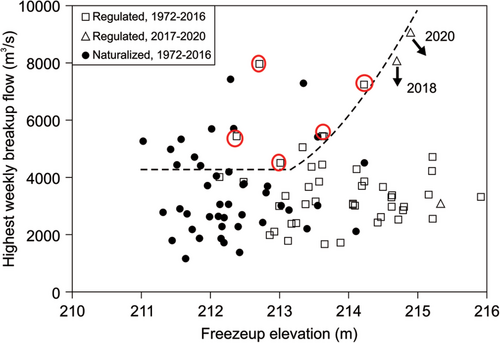
The “probable-flood” (or PF) region contains 11 naturalized and 7 regulated events. Of the latter, 5 were IJFs (only one of the two nearly-coincident markers was a flood). If all markers in the PF region had the same probability of representing IJFs, the number of naturalized IJFs would be 11 × (5/7) = 7.86 or 8 (nearest integer) events. However, IJF probability increases as HF decreases, as has been shown in the main text and as evinced by the fact that the two non-flood hollow markers are located close to the curved demarcating line of the PF region. At the same time, a clear shift towards lesser HF values is exhibited by the naturalized data (solid circles), suggesting that the average IJF probability within the PF region is greater for the naturalized events than for the regulated set. Consequently, the number of naturalized IJFs would likely exceed 8 and, at most, equal 11. Similar results are obtained with 5- day running average flows and with maximum breakup flows in place of the weekly flows depicted in Figure A1.
The data series for observed occurrences after the 2016 breakup year (missing flow data for the thermal 2019 event) further illustrates the effect of HF on IJF occurrence. Exceptionally high flows that occurred in 2018 (Beltaos, 2019a) and 2020 (Beltaos & Carter, 2021) failed to generate IJFs. In both instances, 7- day average values are not known; the data points represent estimated peak values, while the downward components of the associated arrows indicate that corresponding average values would have been lower. In the case of 2020, there is also uncertainty with respect to HF, which could have been as high as 215.5 m (thence the “south-easterly” direction of the arrow). Inspection of the third column of Table 2 suggests that the 2018 and 2020 data points would have almost certainly moved inside the PF region under natural conditions. A relatively thin ice cover near the mouth of Peace River in 2018 and diversion of a limited volume of ice rubble to Lake Athabasca in 2020 via the reversed Riviere des Rochers (a tributary under normal conditions) were likely co-contributing factors in the “failure to flood” (Beltaos & Carter, 2021).
Open Research
DATA AVAILABILITY STATEMENT
The main datasets are presented in the paper and as as supplemental information; additional data can be made available on request from the authors.


