Spatial and temporal variability of water table dynamics in an afforested catchment of the Central Spanish Pyrenees
Abstract
Human-induced afforestation has been one of the main policies for environmental management of farmland abandonment in Mediterranean areas. Over the last decades, several studies have reviewed the impact of afforestation activities on geomorphological and hydrological responses and soil properties, although few studies have evaluated the effects on water table dynamics. In parallel to human-induced afforestation activities, natural revegetation occurred in abandoned fields and in fields where the intensity of human activity declined, driving the expansion of shrubs. This research addresses the spatial and temporal variability of water table dynamics in a small afforested sub-catchment located in the Central Spanish Pyrenees. Differences between afforestation (Pinus nigra and Pinus sylvestris) and natural plant colonization (shrubs, mainly Genista scorpius, Buxus sempervirens, and Juniperus communis) and early abandoned meadows (G. scorpius), are analysed in terms of runoff generation and seasonal water table depth dynamics. Precipitation, runoff and water table datasets recorded for the 2014–2019 period are used. Results show a high temporal and spatial variability with large fluctuations in discharge and water table. Groundwater dynamics varied markedly over the year, identifying a wet and dry period with different responses suggesting different runoff generation processes (Hortonian flow during dry and wet periods, and saturation excess runoff during wet conditions). Furthermore, important differences are noted among the various land cover types: (i) in the natural revegetation area (shrubland and meadows) a marked seasonal cycle was observed with short saturation periods during winter and spring; and (ii) in the afforestation areas, the water table dynamics showed a seasonal cycle with a high variability, with fast responses and rapid oscillations. Likewise, the relationship between the depth of water table and hydrological variables was not straightforward, suggesting complex hydrological behaviour.
1 INTRODUCTION
Hydrological processes within a catchment have implications on a broad range of domains: catchment connectivity (Cammeraat, 2004; Lexartza-Artza & Wainwright, 2009), runoff dynamics (Latron et al., 2009; Price et al., 2010; Zimmermann & Elsenbeer, 2008; Zuecco et al., 2018) or sediment yield to rivers (Bakker et al., 2008; Juez & Nadal-Romero, 2020a; Llena et al., 2021; Piégay et al., 2004). Climate variability and land use change are the main drivers of hydrological processes in the Mediterranean areas, where water is a scarce and a precious natural resource (Immerzeel et al., 2020; Viviroli et al., 2007, 2020). Water resources in the Mediterranean environments are mainly supplied by headwaters, located in the upper mountain regions. These mountain areas are identified as wet islands or water towers (Immerzeel et al., 2020; Viviroli et al., 2007, 2020), and they constitute the primary regions in the Mediterranean area where hydrological processes are modulated by climate variability and land cover types.
Climate in Mediterranean areas is characterized by low to moderate annual precipitation and strong seasonality, with maximum temperatures and minimum precipitation during summer (leading to a high water deficit), in contrast with moderate precipitation and low temperatures during winter. Most climate models forecast an increase in temperature and a decrease in precipitation at the end of the 21st century in this region (Lionello & Scarascia, 2018). This will lead to more water consumption and evapotranspiration, ultimately resulting in changes in runoff and groundwater flow (Germer et al., 2010; Morán-Tejeda et al., 2015). Thereby, vegetation will undergo increasing drought stress. Land use and land cover traits in most Mediterranean mountains have been subjected during centuries to significant human pressure through deforestation, cultivation of steep slopes, fires and overgrazing. However, during the 20th century, especially in the 1960s and 1970s, the mountainous areas of the Mediterranean region were affected by strong migration of rural population and abandonment of cultivated fields (García-Ruiz, 2010). In general farmland abandonment was observed for the 1960s and 1970s in mountain areas of Spain, Italy, France and Greece (García-Ruiz & Lana-Renault, 2011; Zavalloni et al., 2019). To counter land degradation after land abandonment, extensive afforestation campaigns were carried out by national forest services all over the Mediterranean region (Granados et al., 2016; Sorriso-Valvo et al., 1995; Vallauri et al., 2002). The objectives of the afforestation polices were: (i) to control hydrological and geomorphic processes in order to reduce flood frequency and magnitude, and soil erosion; (ii) to improve the use of abandoned land as a natural and economical resource; and (iii) to achieve self-sufficiency in the supply of pulp and paper. During the last 70 years, 5.4 million ha have been afforested in Spain, representing approximately 11% of the land area (Sociedad Española de Ciencias Forestales, 2010).
Afforestation causes a strong shift in land use that may have significant effects on the environment and ecosystems. Previous studies showed that afforestation activities can lead to extreme landscape changes that may affect the hydrological processes at the catchment level (Juez & Nadal-Romero, 2020b; Nadal-Romero, Cammeraat, Pérez-Cardiel, & Lasanta, 2016a; Sorriso-Valvo et al., 1995). From an environmental point of view, land abandonment and subsequent afforestation may have beneficial effects, including a reduction of pesticides and fertilizers (Gafur et al., 2003), increased carbon sequestration (Bravo et al., 2008; Zethof et al., 2019) and soil stability (Keim & Skaugset, 2003) and cleaner water (Serpa et al., 2017). A reduction in water discharge has also been reported, with decreased peak flows and flooding (Andréassian, 2004). However, an accurate understanding of the hydrological dynamics and functioning of a catchment is not possible if only precipitation and discharge data are analysed. From a geomorphological point of view, the reported effects of afforestation may include channel narrowing, armoring applications, stream incision, a change from braiding to meandering systems, colonization of bars by vegetation, reduced erosion, and a decrease of sediment supply (Beguería et al., 2006; Comiti et al., 2011; Keesstra et al., 2005; Scorpio & Piégay, 2021).
In parallel to human-induced afforestation activities, natural revegetation occurred in most of the fields that were abandoned or where the intensity of human activity declined, yielding an expansion of shrublands. For instance, in the Central Spanish Pyrenees, abandoned lands (representing 22% of the total area) turned over to forest (66%), shrubs (27%) and meadows (6%; García-Ruiz & Lana-Renault, 2011). The combination of natural revegetation and afforestation have led to a substantial increase in forest cover in Spain: 130 000 km2 in 45 years (MAPA, 2020). The revegetation process is expected to continue in the Mediterranean mountain areas with afforestation activities carried out to prevent soil degradation and to promote soil retention in former agricultural lands (Skulska et al., 2020; Vadell et al., 2016). However, despite the extensive revegetation, the role of afforested lands has been poorly studied with regard to natural plant colonization (shrubs) and early abandoned meadows, in terms of the consequences for hydrological and water table dynamics.
The main objective of this research aims at identifying the spatiotemporal differences in hydrological and groundwater table dynamics for afforested, natural plant colonized (shrubs), and early abandoned meadows in a small Mediterranean mountain catchment. The specific objectives of this study are to evaluate: (i) the temporal variations (at seasonal, monthly, daily and event scale) on recharge-discharge cycles; (ii) the influence of the site-land use and slope positions on recharge, and (iii) to characterize the dynamics of precipitation-runoff events that occurred during the monitoring period. Few evaluations of the hydrological effects of afforestation in Mediterranean mountain areas at catchment scale have been carried out (Nadal-Romero, Cammeraat, Pérez-Cardiel, & Lasanta, 2016a). Likewise, the water table is one of the most difficult, complex and uncertain hydrological parameters to quantify (Dripps & Bradbury, 2010), and few attempts have been made in Mediterranean afforested areas. This leads to the following research hypotheses: (i) the different forms of revegetation (afforestation, shrub colonization and abandoned meadows) have an impact on the spatial and temporal water table dynamics, and (ii) the relationships between precipitation, discharge and piezometric responses are variable, and suggesting complex hydrological dynamics. In this study the hydrological response and water table dynamics during a 6-years period (2014–2019) of a small experimental afforested sub-catchment located in the Central Spanish Pyrenees will be used. This sub-catchment has been monitored with a gauging station located at the outlet of the catchment and with four piezometers deployed in afforested, shrubs and meadow areas, and offers relevant information needed to relate the interannual and seasonal variability of water resources in this Mediterranean region.
2 FIELD SITE AND FIELD METHODS
The small experimental Araguás afforested sub-catchment (0.124 km2, see Figure 1) is the headwater sub-catchment of the Araguás catchment (see Nadal-Romero et al., 2018; Nadal-Romero, Cammeraat, Pérez-Cardiel, & Lasanta, 2016a). It is located in the Central Spanish Pyrenees, at an altitude of 920–1105 m a.s.l. The substratum is Eocene flysch, with alternating thin beds of sandstones and marls. The catchment is representative of mid-altitude Mediterranean mountain environments and for areas having an evolution of land management with a complex mosaic landscape. This catchment was fully cultivated until the beginning of the 1950s and then abandoned. In 1960, the catchment suffered a high level of soil degradation due to the combination of the non-vegetated land cover and the presence of steep slopes. To control soil degradation, the catchment was afforested with conifers (mainly Pinus nigra, and to a lesser extent with Pinus sylvestris) because they are fast-growing species, and lead to a rapid restoration of soil hydrological processes and to the formation of a protective vegetation cover. The soils are stony and thin following centuries of cultivation and are classified as Leptic Calcaric Regosols with a silt loam texture (FAO, 2014) and showing little variation. The average annual precipitation is about 720 mm, with annual precipitation varying between 500 and 1000 mm (see Nadal-Romero, Cammeraat, Serrano-Muela, et al., 2016b for further details).
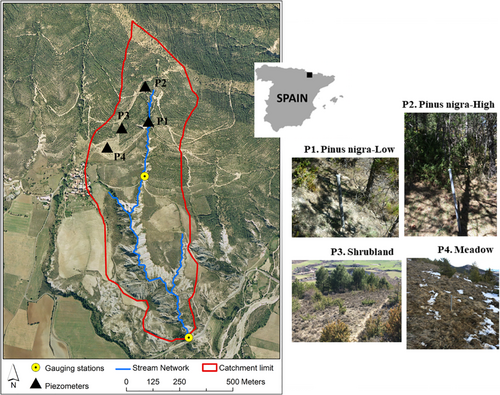
The sub-catchment is equipped with a weather station to measure precipitation and air temperature and with a hydrometric gauging station located at the lower end of the catchment. Precipitation is measured by a tipping bucket rain gauge. Discharge at the gauging station was calculated using a stage-discharge rating curve method. The water level was measured by means of pressure sensors (Keller DCX-22). All the monitoring data were connected to a datalogger that scans information every 10 s and stores average values every 5 min. Furthermore, a small network of four piezometers was installed at two distinctive land cover locations: (i) in the afforested areas two piezometers were installed, one in the upper part of the catchment (‘P. nigra—High’) and one in the lower part of the catchment (‘P. nigra—Low’; see Table 1). In these areas, undergrowth is composed by Genista scorpius (L) DC, Rosa gr. canina L., Buxus sempervirens L. and Juniperus communis L.; and (ii) in the natural vegetated areas two other piezometers were deployed, one in the shrubland (‘Shrubland’) and one in early abandoned meadows (‘Meadow’). In the shrubland area vegetation is mainly composed of G. scorpius, B. sempervirens and J. communis, while in the abandoned meadows it is composed mainly by G. scorpius. All four piezometers are located in lower slope positions (except ‘P. nigra—High’) with similar topographic characteristics (slope and curvature) and may be considered as representative of the general groundwater dynamics within the area (see Figure 1). The piezometers are made of PVC tubes (32 mm in diameter) and were dug to refusal with maximum depths ranging between 0.22 and 0.68 m from the soil surface. The piezometers, measuring the water table, were equipped with an internal pressure transducer connected to a data logger, where data is stored as 10 min averages. Since the piezometers were installed at different depths, and as it was not certain whether the bedrock interface was reached, the soil surface was used as reference to describe the fluctuating ground water levels. Water levels were expressed in meters below the surface. Thereby, low values closer to 0 indicate water table close to the soil surface and vice-versa. Furthermore, depth to water table values were occasionally normalized with the absolute minimum depth to water table of each piezometer. We applied this standardization to homogenize the peak and valley position of the water table for the four piezometers, regardless the different depths at which they were installed.
| P. nigra—low | P. nigra—high | Shrubland | Meadow | |
|---|---|---|---|---|
| Vegetation species | Pinus nigra, and undergrowth of Genista scorpius, Buxus sempervirens, Rosa gr. canina, Juniperus communis | Pinus nigra and undergrowth of Genista scorpius, Buxus sempervirens, Rosa gr. canina, Juniperus communis | Genista scorpius, Buxus sempervirens and Juniperus communis | Genista scorpius |
| Altitude (m a.s.l.) | 979 | 1049 | 1001 | 974 |
| Slope aspect | South-facing | South-facing | South-facing | South-facing |
| Mean slope (°) | 52.0 | 50.2 | 30.0 | 40.7 |
| Lithology | Eocene flysch | Eocene flysch | Eocene flysch | Eocene flysch |
| Minimum water depth (m) | −0.68 | −0.42 | −0.22 | −0.48 |
| Maximum water depth (m) | −0.06 | −0.17 | 0 | −0.06 |
| Variation range of water depth (m) | 0.62 | 0.25 | 0.22 | 0.42 |
| Distance to the main stream network (m) | 8 | 45 | 140 | 200 |
3 DATA AND METHODS
3.1 Data time-series
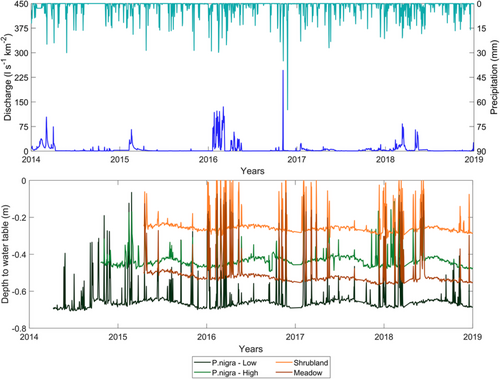
The hydrological variables (precipitation and discharge) used in this study started to be continuously monitored in 2007. Piezometers were installed progressively in the different selected spots in the catchment and the four devices were concurrently running since April 2015 (see Figure 2). Years were split at 1 January. The total cumulative precipitation recorded in the catchment was 675, 719, 692, 714 and 561 mm for the 2014–2019 period. The 11-year average precipitation (2008–2019) for this area was 720 mm; this reveals that the 2014–2018 period remains close to the average long-term precipitation value, whereas 2019 was a dry year.
3.2 Data analysis
The study of the piezometric response to hydrological variability was carried out: (i) to analyse the temporal variations (at seasonal/monthly, daily and event scale) on recharge and discharge cycles; (ii) to assess the influence of the different land cover and slope positions (P. nigra—High and P. nigra—Low) on these recharge and discharge cycles; and (iii) to identify, characterize and understand the dynamics of independent precipitation-runoff events that occurred during the monitoring period. Thus, monthly, daily and event analyses were carried out to study the hydrological responses for the 2014–2019 period.
For the monthly analysis, precipitation and depth to water table datasets were plotted to identify the annual discharge-recharge cycles and to characterize its spatio-temporal scale dependency (i.e., the presence or absence of hydrological hysteresis).
For the daily analysis, violin plots of daily precipitation, discharge and depth to water table time-series were plotted. Violin plots are histograms, where the width along the x-axis indicates the normalized fraction of data at the corresponding y-axis value. Thereby, the data distribution for precipitation, discharge and four piezometers all through the 2014–2019 period was assessed. Furthermore, correlations between piezometer responses and precipitation and discharge variables were used to better understand hydrological dynamics and runoff generation mechanisms. Due to the non-normality of the data, to determine correlations between variables and piezometers, the nonparametric Spearman rank correlation coefficient was calculated (Seibert et al., 2003).
Regarding the event analysis, independent storms events were defined as events when more than 6 mm of precipitation fell within 6 h. Furthermore, the runoff coefficient was computed to compare the magnitude of the response of the catchment to each precipitation event. The method used to separate stormflow (runoff components) is based on the classical approach stated by Hewlett and Hibbert (1967). The hydrograph separation for every runoff event was defined based on an increase of 1.83 L s−1 km−2 identified in the discharge daily time-series. This methodology was used in previous studies on Mediterranean catchments (Latron et al., 2008; Nadal-Romero et al., 2018). Thereby, the analysis of the piezometric response to storms was based on 98 precipitation-runoff events selected over the study period.
4 RESULTS AND DISCUSSION
4.1 Monthly recharge-discharge cycles
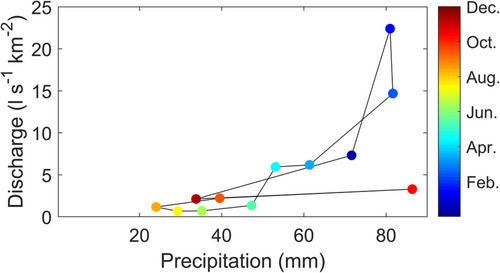
Figure 3 displays the mean monthly precipitation plotted against corresponding mean monthly discharge in the afforested sub-catchment. A wetting-up period, starting at the beginning of autumn, triggered the gradual increase of the discharge from autumn to winter and early spring. During spring, water demand due to vegetation growth and evapotranspiration demand triggered the decline of the discharge, until the minimum value is reached during the summer. A preliminary study focused in the hydrological response of the catchment during the period 2007–2010 showed the complexity of the hydrological response in the Araguás afforested sub-catchment and identified a seasonal dynamic with a unimodal shape, with large values in spring (see also Figure 2) and low values in summer and the beginning of autumn (Nadal-Romero, Cammeraat, Serrano-Muela, et al., 2016b). Similar general temporal patterns have been observed in other neighbouring Mediterranean mountain areas with different land uses (Serrano-Muela et al., 2008).
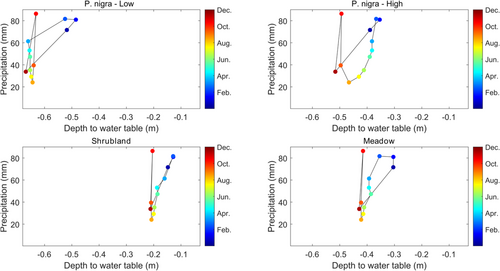
Related to the monthly water table dynamics, Figure 4 depicts the mean monthly precipitation plotted against the corresponding mean monthly depth to water table for the four piezometers deployed in the catchment. In general, in autumn, even if the precipitation values are high, the depth to water tables is minimum in all the cases. The highest groundwater values are recorded at the end of winter and beginning of spring, decreasing the piezometer levels until the summer. ‘P. nigra—Low’ and ‘P. nigra—High’ display higher and faster variability through the year. ‘Shrubland’ shows a linear relationship without hysteresis and ‘Meadow’ depicts the recharge-discharge cycle as the afforested land cover types, but with a less sharp change.
4.2 Temporal variability analysis at daily scale
Violin plots of daily precipitation, discharge and depth to water table time-series are displayed in Figure 5. Precipitation time-series displayed in Figure 5-left shows a great variability. Precipitation events mainly occurred during the wet seasons: primarily during spring (April–May months) and secondary during autumn (October–December). Discharge values are larger during the wet seasons and lower during summer (July–September; see Figure 5—left).
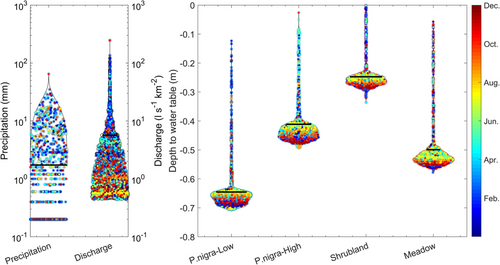
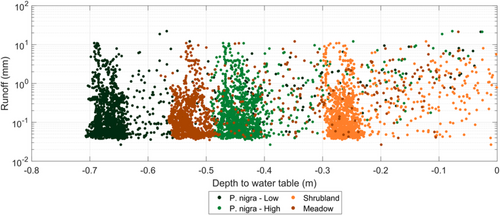
Regarding the piezometer information (see Figures 2 and 5—right) large fluctuations are observed, with general sharp declines once precipitation has ceased. Water tables measured in the piezometers only occasionally reached the surface, confirming field observations that saturated excess overland flow did not typically occur on the catchment, contrary to the processes observed in the neighbouring Arnás revegetated catchment (Lana-Renault et al., 2014). Over the 5-year period in the Araguás afforested sub-catchment, surface saturation or near saturation conditions (defined as water table 20 cm below the surface) were only observed for 0.8% of the time at the ‘P. nigra—High’ piezometer, 1.3% at ‘P. nigra—Low’, 3.5% at ‘Meadow’, and 11.2% at ‘Shrubland’. Similar low values were reported in Latron et al. (2008) over a 6-year study period in a small experimental catchment (Can Vila), identifying that surface saturation or near-saturation conditions were only observed for 4% of the time (Latron et al., 2008).
A clear seasonal pattern is observed for the four piezometers that was repeated each year (see Figure 2). This pattern is similar to the discharge pattern and it implies: (i) a wet period, including short saturation periods (especially in the shrubland site) or maximum depth to water table levels close to the soil surface period (‘P. nigra’ and ‘Meadow’) during winter and spring; and (ii) a dry period between the beginning of summer and autumn, during which low values are observed with small water table peaks, mainly related to high precipitation intensities (see Figure 2). Other studies in mountainous Mediterranean areas and humid environments reported a slightly different seasonal pattern (Latron et al., 2009; Molénat et al., 2005). Lana-Renault et al. (2014) working in the Arnás catchment (cultivated, abandoned and revegetated naturally), identified a wetting-up period, corresponding to a rise in the piezometric levels, which started with the first autumn precipitation events and lasted until the underground water reserve is filled, a saturation wet period over winter and spring, with water table close to the soil surface during long periods, and a drying-down and dry period with a progressive decline in the water table. The wetting-up period in the Araguás afforested sub-catchment is not clearly identified, although some transitional stages between wet and dry periods can be recognized. The seasonal pattern observed in Araguás and in other Mediterranean areas is related to the precipitation and evapotranspiration cycle over the years. The decline of groundwater levels is related to the increasing water deficit during summer, which is caused by high evapotranspiration, due to high temperatures, and by a decrease in precipitation rates. The increase of the groundwater levels is triggered after summer, when evapotranspiration is lower than precipitation. Indeed, the low evapotranspiration demand during autumn and winter guarantees a high water table level, even with low precipitation levels, as it has been observed in other Mediterranean mountain areas (Lana-Renault et al., 2014).
Figure 6 shows the relationship observed between the daily depth to water table and runoff. Results show a high variability with a large scatter, with the lowest runoff values occurring when the water table is really low. Only the relationship of the ‘Shrubland’ piezometer, despite being weak, is statistically significant with runoff and maximum discharge (p-value 0.01 and 0.05, respectively; see Table 2). This result is consistent with other studies reported from other Mediterranean areas that are concluding that runoff response is fairly independent of water table dynamics (Gaillard et al., 1995). Runoff values higher than 10 mm are most of the times recorded with water tables lower than 0.20 below the surface or close to the surface (near saturation conditions).
| P. nigra—low | P. nigra—high | Shrubland | Meadow | |
|---|---|---|---|---|
| Precipitation | 0.123** | 0.016 | 0.015 | 0.036 |
| Precipitation intensity | 0.063** | −0.027 | 0.003 | 0.034 |
| Discharge | 0.074** | −0.029 | 0.047 | −0.14 |
| Runoff | 0.034 | 0.006 | 0.060* | 0.003 |
| Maximum discharge | 0.029 | 0.008 | 0.067** | −0.032 |
- Note: Discharge (l s−1 km−2) refers to the streamflow recorded at the river gauging station and runoff (mm) refers to the stormflow after separation of the base-flow (see Section 3.2 for further details).
- ** Significant correlation at p-level 0.01.
- * Significant correlation at p-level 0.05. Variables were considered at daily timescale.
Spearman rank correlation results showed significant correlations between precipitation and discharge variables and the piezometers, and between the different piezometer sites (see Table 3). The best relationships were observed between precipitation and hydrological variables and the depth to water table values located in the ‘P. nigra—Low’ site. This piezometer is close to the stream (see Table 1), and as it has been suggested in other studies that groundwater levels close to the stream have temporal dynamics similar to runoff and are strongly correlated (Seibert et al., 2003). Likewise, groundwater levels farther from the stream show no significant correlation (‘Meadow’ and ‘P. nigra—High’). This suggests a disconnection from the stream for the majority of the time with no direct contribution to the streamflow. Similar results were recorded in Seibert et al. (2003) and Haught and Meerveld (2011) in different environments.
Correlations were systematically weak and not statistically significant with precipitation intensity indicating, in agreement with Dhakal and Sullivan (2014) and Fannin et al. (2000), that piezometric response was independent of precipitation intensity. Small correlations observed at other piezometric sites suggest a different response, and especially a slower response of the groundwater level to precipitation in the upslope position (‘P. nigra—High’). In that sense, results displayed in Table 2 suggest little connection between groundwater and the hydrological response (except for ‘P. nigra—Low’ and ‘Shrubland’). These results also imply the occurrence of different runoff generating processes, such as Hortonian flow, when precipitation intensity is larger than the soil infiltration capacity.
4.3 Spatial variability analysis
To investigate the water table spatial variability in relation to land cover and slope position (high and low slope position of ‘P. nigra’ piezometers), the daily water table depths for each piezometer were analysed (see also Table 3). Figure 7 displays the differences in water table depth between successive days for the four piezometers. Thereby, positive differences (second quadrant) depict declining water table levels and negative differences (third quadrant) indicate an increase of the water table levels. Values closer to 0 indicate a quiescent water table level. Furthermore, the black dashed line represents the 1:1 linear relationship. Data points above and below that line help to determine the rate of the dynamics.
| P. nigra—low | P. nigra—high | Shrubland | Meadow | |
|---|---|---|---|---|
| P. nigra—Low | – | – | – | – |
| P. nigra—High | 0.295** | – | – | – |
| Shrubland | 0.311** | 0.467** | – | – |
| Meadow | 0.378** | 0.552** | 0.759** | – |
- ** Significant correlation at p-level 0.01.
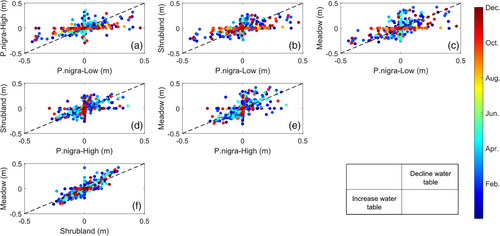
We first discuss the nature of the re-vegetation, being natural (shrubland and meadow) or afforested (P. nigra). Afforested areas display larger scatter than natural areas (see Figure 7(a) vs. Figure 7(f)). Fluctuations in water table levels are faster in ‘P. nigra—Low’ than in ‘P. nigra—High’ and ‘Shrubland’ (see Figures 7(a),(b)). ‘Meadow’ and ‘Shrubland’ show a more linear relationship (see Figure 7(f)). However, rising and declining water table dynamics are faster in the meadow land cover type.
High spatial variability due to different factors (e.g., slope position, vegetation) has also been observed in other Mediterranean mountain areas (Lana-Renault et al., 2014; Latron et al., 2009; Penna et al., 2015; Zuecco et al., 2018). Seibert et al. (2003) suggested that spatial variability is related to the position on the slope, and Dripps and Bradbury (2010) identified differences linked to vegetation cover. Our study in the Araguás afforested sub-catchment, shows that both factors can control the water table dynamics, as piezometers are located in different slope positions (low and close to the stream network, and high and far from the stream network) and under different vegetation cover types. No differences in soil properties have been identified in the field site (Nadal-Romero, Cammeraat, Pérez-Cardiel, & Lasanta, 2016a), hence it is unlikely that differences soil properties can explain the observed patterns.
4.4 Analysis of precipitation-runoff events
The analysis of the piezometric response to storms was based on 98 precipitation-runoff events selected over the study period. Figure 8 displays the boxplots of precipitation and discharge (left) and the depth to the water table of the four piezometers deployed in the area (right) for the precipitation-runoff events. The comparison of the boxplots allows for the analysis of the skewness of the different piezometer time-series.

Piezometers in afforested areas show a positive skewness in the data distribution which implies that positive deviations from the mean are frequent and fast. The water table increases rapidly during precipitation-runoff events, and it also falls down quickly, having little impact on the mean values. Furthermore, the scatter in the afforested data is larger than in shrubland and meadow land cover type.
Conversely, in the shrubland and meadow land cover type, the skewness of the data distribution is negative, which implies that water table fluctuations below the mean value are frequent. In this case, the water table levels remain higher and during episodic periods of higher water demand the levels decline.
Figure 9 displays the time location of storm events recorded in the Araguás afforested sub-catchment for precipitation and related piezometers values for the whole study period (top to bottom). Those storm events which do not cause a variation in the depth to water table of more than 10% with respect to the antecedent day values are not included. This figure shows the large variability of the depth to water table dynamics, and the variability is notably lower for ‘Shrubland’ and ‘Meadow’. During dry season (June–September) water table values remain low. On the contrary, by the end of autumn and winter (December–March), the water values are close to zero, indicating that the water reserves of the soil are recharged and the excess of water is supplied as runoff. This saturation is also observed in shrubland and meadow land cover types during periods relatively dry (beginning of autumn, September–October).
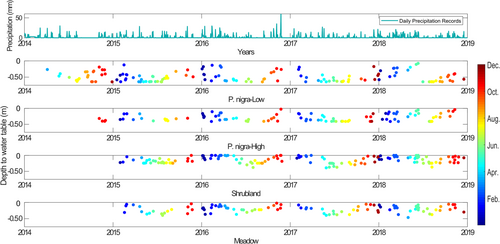
Figure 10 displays the relationship between the antecedent depth to water table value (3 days before the storm event) and the runoff coefficient for the four piezometers deployed in the area all through the study period. Data points are normalized to the absolute minimum depth to water table value of each piezometer to facilitate comparison. Results show a high variability and a no linear correlation between antecedent conditions of the water table and runoff response. A high variability is observed at all the recording sites: large runoff coefficients are observed for the minimum depth to water table values in the ‘P. nigra—Low’, ‘Shrubland’ and ‘Meadow’ sites. This could be related to intense precipitation events during dry catchment conditions, with a precipitation intensity greater than soil infiltration capacity, resulting in Hortonian flows. Large runoff coefficients are also observed during wet periods, when the water table levels remain high. During dry season and beginning of the wetting season (October–December) runoff coefficients are low and the depth to water table remains close to the minimum values. A higher variability in runoff coefficients is observed in ‘P. nigra—High’.
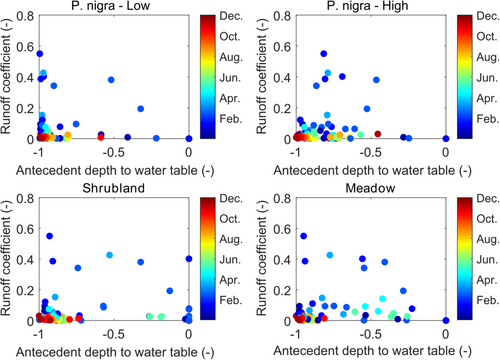
Interestingly, for the meadow land cover type, the runoff coefficients with values around 0.15 are spread all along the antecedent depth to water table. This occurs during the months of January and May. This indicates that during the wet season a significant contribution to flow discharge comes from meadows, which become hydrologically connected to the stream thanks to the groundwater flow (see also Zuecco et al., 2019).
4.5 Analysis of selected events
We compare the relationship between water table depth and discharge response during three selected events. For this purpose, Figure 11 displays an example of the timing of the piezometric response for the four different land cover types, and for the events on 18 April 2015 (P = 29 mm, runoff = 16 mm), 13 June 2015 (P = 29 mm, runoff = 7 mm), and 2 November 2015 (P = 14 mm, runoff = 7 mm). In general, large fluctuations in discharge and water table can be observed. The water table fluctuates intensively, with sharp declines once precipitation has ceased indicating a quick response of water flow within the soil. Piezometric responses under afforestation during individual events showed that the piezometers react differently under different event characteristics and also under different antecedent conditions. This phenomenon has been widely discussed in the literature (Anderson et al., 2012; Latron et al., 2008). We identified three types of response, related to discharge and the water table, and is comparable to other classifications as proposed for other study areas (Fannin et al., 2000; Lana-Renault et al., 2014; Latron et al., 2008): (i) During wet conditions a rapid response of high discharge was observed, even when the water table was really low at the beginning of the storm. A rapid reaction was observed and the depth to water level always reached the soil surface. These events can be characterized by long precipitation events (including high intensity events), with large runoff responses and high peak flows. Wet soils respond quickly but drain slowly, especially when the soils are clay-rich (Fannin et al., 2000); (ii) During dry conditions with high precipitation intensities, a more flashy and quick response was observed (fast response with steeper rising and falling limbs). The water table was dry at the beginning of the event and a rapid reaction was observed. However the water table only reached the soil surface in the revegetated areas. Also, high values were observed at ‘P. nigra—Low’, due to the short distance to the main stream network (see Table 1 and Figure 1). The water table was thus discontinuous and only some areas were hydrologically connected to the stream. Infiltration excess runoff was probably the dominant runoff processes with high peak flows; and (iii) During transition conditions a slow response of discharge and water table was observed, showing a high variability between the different piezometers. Under these conditions large precipitation events showed a relatively gentle recession limb of the runoff curve and a slow increase of the water table.
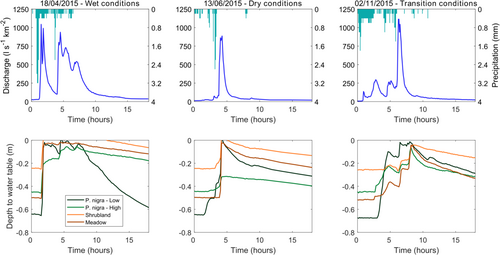
To further investigate the water table response, we compared the relationship between water table depth and discharge response during these selected events (see Figure 12). Results indicate that the peak of the water table level was reached almost at the same time of the peak of the discharge or just reached following the peak of discharge (5-min delay), suggesting rapid water movement in the soil. Both results, with small differences related to vegetation, suggest an important contribution of surface runoff to the hydrological response as was also suggested by Lana-Renault et al. (2014). These differences observed in the different piezometers can be related to the position of the slope (as it is observed differences between ‘P. nigra—High’ and ‘P. nigra—Low’; Haught & Meerveld, 2011; Penna et al., 2015), local topography (Rinderer et al., 2016; Zuecco et al., 2019), vegetation, and in some cases due to soil properties (Beiter et al., 2020; Pavlin et al., 2021).

5 CONCLUSIONS
Given the lack of previous studies concerning water table dynamics in an afforested environment (that was previously cultivated and abandoned, and then afforested), this study was implemented as a first attempt to investigate the spatial and temporal variability of water table dynamics in a small catchment in the Central Spanish Pyrenees. Data were collected at four sites with different land cover types such as P. nigra (−High and -Low), shrubland and meadows during the period 2014–2019.
This research corroborates that different land cover types after land abandonment have an impact on the spatial and temporal water table dynamics. In general, results indicated a high temporal and spatial variability with large fluctuations of discharge and water table. The water table fluctuates intensively, with a sharp decline once precipitation has ceased, suggesting that water flows quickly within the soil. At times, the water table just reaches the soil surface but only during some short time periods. Differences related to vegetation cover and slope position have been reported, preliminary confirming our first hypothesis (i.e., the different forms of revegetation have an impact on the spatial and temporal water table dynamics). Results indicate that the water table at shrubland and meadows sites displayed a greater and faster response than at the afforested sites.
The results also support our second initial hypothesis concluding that the relationships between precipitation, discharge and water table are variable, thus suggesting complex hydrological dynamics in the Araguás afforested sub-catchment. The relationship between water table levels and discharge was weak, suggesting little connection between ground water and the hydrological response in the Araguás afforested sub-catchment, except at the ‘P. nigra—Low’ site due to the short distance to the main stream network. These results suggest the occurrence of different runoff generation processes in the catchment, such as infiltration excess flow (Hortonian flow), subsurface flow and sporadically saturation excess runoff processes. Such complexity is mainly related to the marked climatic variability (seasonality), but also varies with landscape characteristics, such as vegetation, topography and land cover types.
Groundwater levels fluctuated seasonally in response to precipitation and the response to individual storms is highly variable. Under wet conditions (mainly winter and spring), storms generate maximum groundwater response for all the piezometers, and during dry conditions a flashy hydrological response was observed, with a rapid water table reaction only in areas that are hydrologically connected to the stream. In this case, infiltration excess runoff is the dominant runoff process. A third period linked to transition conditions has been identified with slow responses of discharge and water table and high variability.
Considering the presence of similar soils conditions between the sites (see Nadal-Romero, Cammeraat, Pérez-Cardiel, & Lasanta, 2016a), the small size of the sub-catchment, and the close geographical proximity of the sites, it is reasonable to infer that land cover, vegetation, and topography (as slope position) explained the observed spatial and temporal differences in the water table dynamics in the Araguás afforested sub-catchment.
To conclude, we highlight that the small number of groundwater sites can constrain the representativeness of the conclusions. However, we consider these results highly relevant because it is the first time that afforestation and natural revegetated areas were compared in a small afforested Mediterranean mid-mountain catchment with regard to water table dynamics. Further studies should be focused on increasing the number of groundwater measuring points, together with complementary information provided by means of soil moisture sensors.
ACKNOWLEDGEMENTS
This work was funded by the H2020-MSCA-IF-2018 programme (Marie Sklodowska-Curie Actions) of the European Union under REA grant agreement, number 834329-SEDILAND, and by the MANMOUNT project (PID2019-105983RB-I00/AEI/10.13039/501100011033, funded by MICINN-FEDER).
Open Research
DATA AVAILABILITY STATEMENT
Data sharing is not applicable to this article as no new data were created or analyzed in this study.


