Guidelines for clinical interpretation of variant pathogenicity using RNA phenotypes
Abstract
Over the last 5 years, RNA sequencing (RNA-seq) has been established and is increasingly applied as an effective approach complementary to DNA sequencing in molecular diagnostics. Currently, three RNA phenotypes, aberrant expression, aberrant splicing, and allelic imbalance, are considered to provide information about pathogenic variants. By providing a high-throughput, transcriptome-wide functional readout on variants causing aberrant RNA phenotypes, RNA-seq has increased diagnostic rates by about 15% over whole-exome sequencing. This breakthrough encouraged the development of computational tools and pipelines aiming to streamline RNA-seq analysis for implementation in clinical diagnostics. Although a number of studies showed the added value of RNA-seq for the molecular diagnosis of individuals with Mendelian disorders, there is no formal consensus on assessing variant pathogenicity strength based on RNA phenotypes. Taking RNA-seq as a functional assay for genetic variants, we evaluated the value of statistical significance and effect size of RNA phenotypes as evidence for the strength of variant pathogenicity. This was determined by the analysis of 394 pathogenic variants, of which 198 were associated with aberrant RNA phenotypes and 723 benign variants. Overall, this study seeks to establish recommendations for integrating functional RNA-seq data into the the American College of Medical Genetics and Genomics and the Association for Molecular Pathology guidelines classification system.
1 INTRODUCTION
1.1 ACMG guidelines to standardize clinical variant interpretation
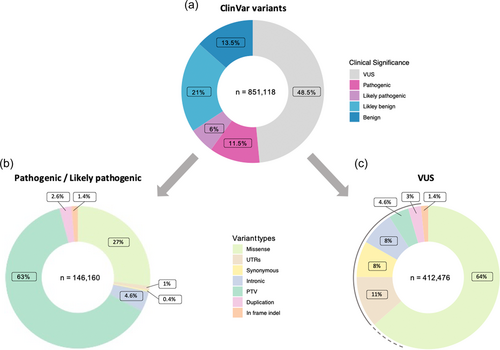
Routine clinical implementation of whole-exome (WES), whole-genome, and panel sequencing have led to the detection of thousands of rare variants per patient, shifting the major challenge of genetic testing from variant detection toward variant interpretation. To standardize the diagnostic process, the American College of Medical Genetics and Genomics and the Association for Molecular Pathology (ACMG/AMP) established guidelines for the interpretation of genetic variants identified by DNA sequencing (DNA-seq) in 2015 (Richards et al., 2015). The ACMG/AMP guidelines comprise 28 criteria stratified by the type and level of strength of evidence of variant pathogenicity. When combined, these criteria contribute to the classification of variants into a five-tiered system: pathogenic (P), likely pathogenic (LP), variant of uncertain significance (VUS), likely benign (LB), or benign (B) (Figure 1a).
1.2 Variant types and their pathogenicity
While less than 20% of the variants submitted to ClinVar (Landrum et al. 2014, 2016), a public server of genetic variants and their clinical significance, are classified as likely pathogenic/pathogenic and about 30% are likely benign/benign, more than 50% fall into the category of VUS (Figure 1a) (Pérez-Palma et al., 2019). Protein truncating variants (PTVs; nonsense, frameshift, canonical splice sites [±1 or ±2 intronic positions], initiation codon, and deletion) represent the most frequent type of variants in the pathogenic and likely pathogenic categories. Pathogenic PTVs result in the absence of a functionally important part of the expressed protein or trigger nonsense-mediated RNA decay (NMD) leading to no/minimal amounts of the expressed truncated protein (Brandt et al., 2020) (Figure 1b). Therefore, PTVs are the only variant type that can be assigned with the very strong level of pathogenicity (PVS1) purely based on computational predictions. In combination with at least one moderate criterion, like matching a patient's phenotype, such variants are classified as likely pathogenic (Richards et al., 2015).
1.3 Variants of uncertain significance
Variants with less clearly predicted molecular consequences and insufficient or conflicting evidence are classified as VUS (Figure 1c). The largest fraction of VUS is missense and inframe indel (insertion/deletion) variants. For those variants, the prediction of the functional consequences and clinical relevance has low accuracy. Moreover, VUS in the noncoding regions (intronic, intergenic, untranslated region [UTR], etc.), are rarely prioritized by diagnostic pipelines but have the potential to affect gene expression or splicing and cause aberrant RNA phenotypes resulting in clinically relevant reduced protein function. Through the widespread usage of high-throughput DNA-seq techniques, variant detection is outpacing the ability of variant interpretation, consequently leading to a constantly increasing amount of VUS (Starita et al., 2017). According to ACMG/AMP guidelines, VUS can not be the basis for clinical decision making but additional evidence is required for clarification of the functional consequences of these variants.
1.4 Functional assays for reclassifying VUS and limitations
Functional data has been shown to be one of the best types of evidence for the reclassification of VUS. Hence the ACMG/AMP framework determines well-established in vivo or in vitro functional studies as strong evidence (PS3/BS3) for variant interpretation (Brnich et al., 2018; Richards et al., 2015). However, as functional assays are typically gene-specific and require special knowledge and equipment, they are only rarely established in routine clinical diagnostics (Gelman et al., 2019). In addition, variants are often private to each patient and have not been tested beforehand. High-throughput functional assays are needed to test the full spectrum of genetic variants in each gene. Such assays have been developed for some genes focussing on coding variants (Findlay et al., 2018; Matreyek et al., 2018) but are much more difficult for noncoding variants. Hence, novel strategies helping variant interpretation are required.
1.5 RNA sequencing (RNA-seq) as transcriptome-wide functional read-out
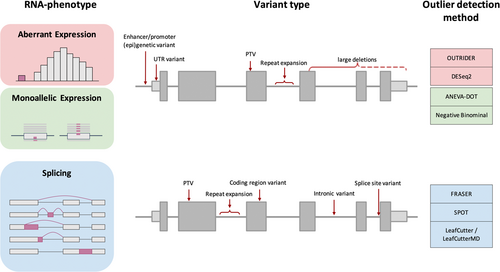
RNA-seq, a genome-wide tool for functional characterization and quantification of transcript levels and isoforms, can aid variant interpretation when applied on a patient sample. It serves for the quantification of gene expression or splicing and allows for the detection of relative changes in RNA phenotypes within patient cohorts. RNA-seq analysis facilitates validation of regulatory effects of VUS located in coding and noncoding regions on RNA phenotypes for thousands of genes in a single standardized assay. Depending on the tissue this may cover up to 90% of known disease genes (Gonorazky et al., 2019; Yépez et al., 2022). Moreover, the comprehensive transcriptome-wide analysis may discover disease-relevant RNA phenotypes not expected based on the interpretation of genome sequences. The universal functional readout aids to streamline the functional interpretation of variants and provides at the same time information on the normal physiological range of RNA phenotypes for all expressed genes not affected by the disease. Statistical analysis of RNA-seq data thereby enables the systematic identification of aberrant RNA phenotypes, defined as (1) genes expressed at aberrant levels, (2) monoallelic expressed variants, and (3) aberrantly spliced genes (Figure 2) (Cummings et al., 2017; Frésard et al., 2019; Gonorazky et al., 2019; Kremer et al., 2017). The ability to detect these outlier events deems RNA-seq an invaluable tool for the reclassification of VUS.
2 ABERRANT RNA PHENOTYPES
2.1 Aberrant expression
Aberrant expression, identified as gene expression outliers outside the physiological range, often presents with low levels of gene expression (Kremer et al., 2017). Depending upon whether one or both alleles are affected, a moderate or severe reduction in gene expression and consequently protein function is observed. Transcripts with nonsense variants are frequently degraded via nonsense-mediated decay, which can be detected by aberrant underexpression of genes. Besides nonsense and frameshift variants, also splice variants often result in the creation of premature termination codons. Additionally, noncoding variants in regulatory regions such as promoters, enhancers, or suppressors, variants in the untranslated or intronic region, or large deletions have the potential to cause aberrant underexpression of disease genes (Ferraro et al., 2020).
Gene expression levels are quantified by the number of read counts mapping to transcript isoforms of genes. These read counts thereby allow measuring the impact of variants on steady-state RNA expression level. Within the first study applying RNA-seq in rare disease diagnostics, outliers were originally called by DESeq2, a method developed for differential gene expression analysis (Kremer et al., 2017; Love et al., 2014). Other studies did not apply a formal statistical test, but computed z-scores on the log-transformed gene-length-normalized read counts and used manually defined threshold to define aberrant expression (Cummings et al., 2017; Gonorazky et al., 2019). Later, specific methods such as OUTRIDER (OUTlier in RNA-seq fInDER, Brechtmann et al., 2018) have been developed for the systematic detection of expression outliers in RNA-seq data.
2.2 Monoallelic expression (MAE)
Apart from aberrant expression, RNA-seq provides information about allele-specific expression, whereby primarily one allele out of the two alleles is expressed (at least 80% of reads as defined by Yepez, Mertes, et al., 2021) and can be detected as MAE. MAE is a specific form of aberrant expression and an extreme form of allelic imbalance. It often escapes detection by aberrant expression since expression of mainly one allele does not always result in expression levels outside the physiological range (Yépez et al., 2022). Nevertheless, MAE can indicate the presence of a clinically relevant situation. Under the assumption of a recessive inheritance model, rare monoallelic DNA variants are not prioritized. Thereby, detection of MAE of a rare variant indicates a previously unidentified defect of the second allele, such as a promoter variant resulting in loss of expression of the second allele. Hence, MAE can reprioritise rare heterozygous variants detected by DNA-seq. The reasons for reduced expression of an allele in MAE can be diverse and may be due to genetic as well as epigenetic reasons, such as inactivation of the X chromosome and imprinting of autosomal genes (Bartolomei, 2009; Ferraro et al., 2020; J. T. Lee & Bartolomei, 2013; Lyon, 1961). Using RNA-seq monoallelic events are detected by counting the reads aligned to each expressed allele at genomic positions of heterozygous single-nucleotide variants. Different methods have been developed for MAE detection, including negative binomial test (Kremer et al., 2017) and ANEVA-DOT (ANalysis of Expression Variation-Dosage Outlier Test) (Mohammadi et al., 2019). While the negative binomial test uses a fixed dispersion for all genes, ANEVA-DOT takes into account gene-specific variance that promises better performance. However, as ANEVA-DOT is not applicable for all genes so far, the negative binomial test has been mostly applied for MAE detection.
2.3 Aberrant splicing
Finally, aberrant splicing of a gene is a long-known cause of genetic diseases, which can be detected by RNA-seq (Scotti & Swanson, 2016; Singh & Cooper, 2012; Tazi et al., 2009). The majority of human genes are spliced, usually resulting in multiple transcript isoforms. Being a tightly regulated process, various variant types can disrupt splicing. The most canonical example, splice site variants, located at the exon−intron boundary, frequently, but not always lead to clear splice defects. In addition, intronic and coding variation can lead to splicing disruption. Quantitative predictions of aberrant splicing, based on genetic variants outside the splice regions, are usually inaccurate and rarely provide sufficient evidence for assessing the variants' pathogenicity (Ferraro et al., 2020). RNA-seq allows quantification of splicing events by detection of split reads, whose ends align to distinct sequence elements. For accurate detection of aberrant splicing for diagnostic purposes, different methods including FRASER (Find Rare Splicing Events in RNA-seq) (Mertes et al., 2021), SPOT (SPlicing Outlier deTection) (Ferraro et al., 2020), and LeafCutter/LeafCutterMD (LeafCutter for Mendelian disease) (Jenkinson et al., 2020; Y. I. Li et al., 2018) have been established.
2.4 Introduction of RNA-seq data into the ACMG/AMP variant interpretation framework using evidence strength
Across RNA-seq studies, different statistical methods, metrics and thresholds were used to identify outliers and subsequently provide pathogenicity evidence to underlying variants. In addition, various technical and biological factors can have an impact on RNA-seq readout, bringing uncertainty in evidence strength. Although the diagnostic benefit in aiding variant interpretation in rare diseases has been shown within these studies, no detailed thresholds and recommendations exist. Aiming to standardize diagnostic procedures and integrate RNA-seq analysis in the ACMG/AMP framework, we evaluated quantitative metrics of RNA phenotypes and provide recommendations on RNA-seq application in clinical practice. Our recommendations on quantitative RNA-seq data interpretation are based on the evidence strength evaluation proposed by Brnich et al. (2019) by evaluation of the performance of RNA phenotypes to classify variants as pathogenic or benign.
3 MATERIALS AND METHODS
3.1 Public data acquisition and analysis cohort
For the analysis of the diagnostic power of clinical RNA-seq, we collected data from eight studies systematically detecting RNA phenotypes with a minimum of 25 cases (Cummings et al., 2017; Frésard et al., 2019; Gonorazky et al., 2019; Kopajtich et al., 2021; Kremer et al., 2017; H. Lee et al., 2020; Murdock et al., 2021; Yépez et al., 2022; Supporting Information: Table S1). Causal gene and variant information, as well as available data on RNA phenotypes, from 178 genetically diagnosed cases were extracted from the text and the Supporting Information Material of the corresponding studies (Supporting Information: Table S2).
This data set includes 119 cases from Yépez et al. (2022) study, from which WES and RNA-seq data was available in-house. All individuals included in the study or their legal guardians provided written informed consent before evaluation, in agreement with the Declaration of Helsinki and approved by the ethical committees of the centers participating in this study, where biological samples were obtained.
3.2 Whole exome sequencing data and analysis
Variant annotation of WES data was performed as described in (Yépez et al., 2022). In brief, reads were aligned to the human reference genome (UCSC build hg19) using the Burrows−Wheeler Aligner (BWA) v0.7.5a (H. Li & Durbin, 2009). Variants were called with Genome Analysis ToolKit (GATK) v3.8 (Van der Auwera et al., 2013) and annotated with Variant Effect Predictor (VEP) v1.32.0 (McLaren et al., 2016). In addition, automatic interpretation of rare variants (minor allele frequency < 0.01; MAF) with ACMG guidelines was performed with InterVar software using default parameters (Li & Wang, 2017).
3.3 RNA-seq data analysis
For quantification and analysis of RNA phenotype metrics, the compendium of RNA-seq data described in Yépez et al. (2022) was used. The compendium includes 70 individuals from Kremer et al. (2017), 152 individuals from Kopajtich et al. (2021), and 81 additional individuals recruited by Yépez et al. (2022). The data set consists of 303 fibroblast cell lines derived from patients with suspected Mendelian disorders. Gene expression and splicing counts are available via Zenodo: strand-specific (Yepez, 2021) and nonstrand specific (Yepez, et al., 2021). Aberrant RNA phenotypes were detected as described in the Yépez et al. (2022) study using the DROP pipeline. In brief, aberrant expression was detected using the OUTRIDER package (Brechtmann et al., 2018), and four metrics were obtained: fold-change, z-score, p value and p adjusted. For this study OUTRIDER was selected for aberrant expression detection as it has been shown to outperform other methods based on the z-score transformation of RNA-seq data in three different benchmarks (Brechtmann et al., 2018). Aberrant splicing was called with the FRASER package (Mertes et al., 2021), resulting in the following metrics: delta PSI (delta percent spliced in, Δψ) and delta Theta (delta of splicing efficiency, Δθ) calculated for both 5′ and 3′ splices sites, as well as p value and p adjusted. Algorithm utilizes RNA-seq split reads, non-contiguous reads whose ends align to two separated genomic locations of the same chromosome strand and are, therefore, evidence of splicing events. The percent-spliced-in (ψ) is calculated as the ratio between split-reads spanning the given intron and all split-reads sharing the same donor (5′) or acceptor site (3′), respectively. The splicing efficiency (θ) is calculated as the ratio of all split-reads and the full read coverage at a given splice site. Although other methods exist for calling aberrant splicing events, such as SPOT and LeafCutterMD, FRASER was the method of choice for this study. Within a benchmarking study of three different aberrant splicing detection methods, FRASER obtained the highest enrichment of rare splice variants (Mertes et al., 2021). MAE was detected using the negative binomial test (Kremer et al., 2017) computing, for each heterozygous variant, an alternative allele ratio, p value and p adjusted. Allelic ratio is defined for each heterozygous variant as the ratio of reads mapped to alternative allele in relation to the total number of reads mapped at this position. No formal benchmarking has been done to evaluate the performance of methods detecting MAE. However, since ANEVA-DOT (v.0.1.1) is currently limited only to 6365 genes expressed in fibroblasts, the negative binomial test was chosen for the detection of monoallelic events.
3.4 Variant classification based on predicted functional consequence
A series of variant categorizations were performed based on the predicted functional consequence. First, for the analysis of variants reported in the ClinVar database, nonsense, frameshift, canonical splice sites (±1 or ±2 intronic positions), initiation codon, single or multiexon deletions were categorized as “PTV.” Next, for the variants reported pathogenic in the eight RNA-seq studies, we grouped promoter, 5′ untranslated region (5′ UTR), 3′ UTR, in-frame indel, and start-loss variants as category “Other” due to the small number of individuals carrying them. For all posterior analyses variants were divided into four types based on their location and predicted functional consequence. “PTV” included nonsense, frameshift, deletion, and start-loss variants, “Splice” combined canonical splice sites, and variants in splice region, refers to variants in the first/last nucleotide of an exon, the +3 to +6 intron position (splice donor site) and variants generating a new AG-dinucleotide directly upstream of a splice acceptor site (AG). While the “Non-coding” type comprised intronic, promoter, 5′ UTR, 3′ UTR, copy number variation and intergenic variants. Finally, the “Coding” category included missense, synonymous, stop-loss and inframe insertion and deletion variants.
3.5 Calculation of OddsPath
The magnitude of evidence strength provided by RNA phenotypes was estimated based on a framework proposed by Brnich et al. (2019) and calculation of the odds of pathogenicity (OddsPath, Tavtigian et al., 2018). OddsPath was computed as OddsPath = [P2 × (1 − P1)]/[(1 − P2) × P1], where P1 is the prior probability, calculated as the proportion of pathogenic variants in the overall data. P2 is the posterior probability, defined as the proportion of pathogenic variants with functionally abnormal (aberrant) RNA phenotypes.
A set of known benign and pathogenic variants is required for the OddsPath calculation. A total of 394 pathogenic variants were selected for the OddsPath calculations based on two inclusion criteria: (1) pathogenic variants located in genes expressed in fibroblasts and reported as disease-causing for the 119 genetically diagnosed individuals described by Yépez et al. (2022). (2) ClinVar pathogenic or likely pathogenic variants located in genes expressed in fibroblasts and detected across the full cohort of 303 individuals (Yépez et al., 2022) (Supporting Information: Table S3). A total of 723 benign variants were selected based on the following two criteria: (1) rare variants with a MAF < 0.01 reported benign or likely benign in the ClinVar database (Landrum et al., 2014, 2016) and classified as benign or likely benign according to ACMG/AMP criteria as implemented in the InterVar software (Li and Wang, 2017). (2) as the first procedure resulted in a low number of PTV variants, nonsense and frameshift variants detected in causal genes with a MAF > 0.05 were additionally included, as suggested by Brnich et al. (2019) (Supporting Information: Table S3).
OddsPath analysis was performed separately for monoallelic and biallelic genetic defects. Homozygous and compound heterozygous variants were considered biallelic, heterozygous as monoallelic. An exception was made for nonmissense variants compound heterozygous with missense alleles, which were considered as monoallelic because missense variants typically do not result in aberrant RNA phenotypes. For each RNA phenotype, the OddsPath was calculated given different thresholds and was interpreted based on the evidence strength equivalents provided by Brnich et al. (2019). An OddsPath > 2.1 was considered as PS3 supporting, OddsPath > 4.3 as PS3 moderate, OddsPath > 18.7 as PS3 (strong), and OddsPath > 350 as PS3 very strong.
4 RESULTS
4.1 Overview of studies implementing clinical RNA-seq
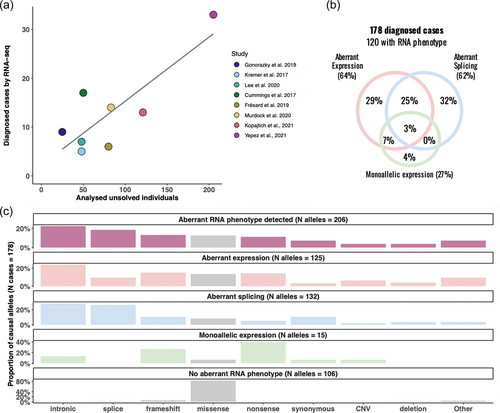
To date, eight studies applied RNA-seq in large-scale, with at least 70 individuals in the cohort and a minimum of 25 affected individuals, aiming to reclassify VUS or to identify disease-causing genes and variants (Cummings et al., 2017; Frésard et al., 2019; Gonorazky et al., 2019; Kopajtich et al., 2021; Kremer et al., 2017; LHee et al., 2020; Murdock et al., 2021; Yépez et al., 2022; Supporting Information: Table S1). The median reported RNA-seq diagnostic rate is 15% (Figure 3a). For 74% (132/178) of cases, pathogenic variants were identified in genes associated with diseases with an autosomal recessive mode of inheritance. We extracted variant and RNA phenotype information from 178 genetically diagnosed cases from the corresponding literature (Supporting Information: Table S2). In 120 out of the 178 cases at least one RNA phenotype was detected. Aberrant expression and aberrant splicing were the most common RNA phenotypes contributing to diagnosis in 64% and 62% of cases, respectively, (Figure 3b). In addition, as aberrant splicing often created premature stop codons causing NMD, almost in half of these cases it also led to aberrant expression. Detection of MAE contributed to diagnosis in 27% of cases.
4.2 Variants underlying RNA phenotypes
Across all studies, pathogenic variants were discovered in genes with known loss-of-function mechanisms for recessive disorders or haploinsufficiency for dominant diseases (Supporting Information: Table S2). Although RNA-seq could potentially discover genetic defects with the gain-of-function mechanism by calling overexpression outliers, it was not described in any of these studies. Intronic, splice site and frameshift variants represented the three most common variant types causing pathogenic RNA phenotypes (Figure 3c). Notably, intronic variants are often not prioritized by WES and have been identified following prioritization by RNA-seq analysis. Intronic variants were found to cause aberrant expression and splicing phenotypes. Among cases where no RNA phenotype was detected, missense variants were the most frequent cause of the disease (Figure 3c). Though missense variants were detected in around 10% of cases with an aberrant RNA phenotype, in most of these cases the missense variant was compound heterozygous with a PTV or noncoding variant.
5 RECOMMENDATIONS FOR VARIANT INTERPRETATION WITH RNA-SEQ
Based on the analysis of available data, and the recommendations provided by Brnich et al. (2019), we propose the following recommendations for the analysis of RNA-seq data and interpretation of RNA phenotypes in the context of ACMG/AMP guidelines.
5.1 General considerations
5.1.1 Assay description
RNA-seq is a transcriptome-wide assay of RNA sequence providing qualitative and quantitative characteristics. It is the method of choice to study predicted RNA phenotypes (Figure 3, Supporting Information: Table S1 and S2). Here, we focus on the interpretation of transcriptome-wide RNA-seq data and do not address the single-gene RNA assays. Universal readout of RNA-seq provides evidence to a large fraction of genes, however, clinical interpretation implies gene-specific considerations. These considerations include mode of inheritance and described mechanisms of variant action like a loss- or gain- of function. Still, for the majority of the genes, common rules could be applied, allowing transcriptome-wide approaches to be used for high-throughput variant interpretation.
5.1.2 Mechanism of the disease and mode of inheritance
These recommendations are specific for diseases with a loss-of-function pathomechanism, characterized by reduced or abolished gene product function. RNA-seq is well established to validate predicted RNA effects of rare variants by detecting aberrant low expression, MAE, and splice defects, resulting in reduced or abolished gene activity.
Disorders with characterized loss-of-function due to variants causing aberrant RNA phenotypes include autosomal recessive, autosomal dominant, and X-linked modes of inheritance. The interpretation of mtDNA variants, and thereby maternal inheritance, is not covered by these guidelines. However, given that mitochondrial RNA processing defects are caused by nuclear gene mutations, their consequence may indeed be detected by RNA-seq.
5.1.3 RNA-seq in patient-derived material, tissue specificity, and artificial systems
For the RNA phenotype analysis by RNA-seq, patient-derived material or an artificially generated system is needed. RNA-seq performed in patient-derived material captures the physiological context and thereby allows quantification of disease-relevant genetic and epigenetic effects, otherwise missed in artificial systems. However, patient-derived material is not informative if the gene or transcript isoform potentially affected by the variant of interest is not expressed in this tissue. Furthermore, variant effects could be modified by tissue-specific factors. Hence, for tissue prioritization, it is important to consider not only tissue-specific characteristics of gene expression but also transcript isoform-specific variant effects (Cummings et al., 2020).
The disease-affected tissue is considered to be most informative, however, often not available. Among clinically accessible tissues, skin fibroblasts, and muscle biopsies have proven to be valuable for clinical RNA-seq, expressing ~70% of known Mendelian disease genes (Yépez, Mertes, et al., 2021). Conversely and regrettably, blood, the most frequently clinically available tissue, has been described to be of limited value for Mendelian disease diagnostics, especially concerning the detection and quantification of aberrant splicing events (Gonorazky et al., 2019; Murdock et al., 2021). If the gene of interest is not expressed in the available tissue, induced pluripotent stem cell lines (Bonder et al., 2021) could be differentiated into nonaccessible tissues (Burke et al., 2020).
When patient-derived material is not available, RNA-seq can be performed on artificial systems, such as cell lines with CRISPR-introduced genetic variants (Adli, 2018; Meng et al., 2020; Sterneckert et al., 2014; Xie et al., 2020). Artificial systems with introduced variants directly probe the effect of defined variants on the RNA phenotype and are therefore applied to define the causative variant or combination of variants in complex haplotypes. However, interpretation of the results obtained in such artificial systems should be undertaken with caution as potential disease-relevant effects on transcripts, influenced by physiological context, could be missed.
Here, we provide recommendations for the interpretation of RNA phenotypes detected in patient-derived material. Artificial systems are not further discussed.
5.1.4 Consequences on protein level
Genetically caused aberrant RNA phenotypes likely result in a functionally abnormal protein. However, as exemplified by Brnich et al. (2019), aberrant splicing can result in truncated proteins with intact functional properties. In addition, the effects of variants leading to aberrant RNA phenotypes, such as aberrant underexpression, can be compensated on the protein level by protein buffering mechanisms (Battle et al., 2015; Ishikawa et al., 2017; Vogel & Marcotte, 2012).
5.1.5 Terminology
Here, “functionally abnormal” RNA phenotypes are defined as “aberrant” expression level, “aberrant” splicing, or MAE. Their detection was made possible by the generation of robust control data to define the “functionally normal” physiological range for all expressed genes.
5.1.6 Statistical power to detect aberrant RNA events
A minimal number of samples is needed to estimate the normal physiological range. Thereby, the power and accuracy of detecting aberrant RNA-phenotypes increase with sample size. According to Brechtmann et al. (2018), the minimum sample size for the robust calling of aberrant RNA expression is 50. According to Mertes et al. (2021), a minimum of 30 samples is needed for the detection of aberrant splicing. Conversely, MAE is called on a per-sample basis and is therefore not affected by sample size but by coverage of the variant, thereby no minimum sample size is required. The minimal coverage at the variant position to estimate MAE is 10 reads Yépez et al. (2022). Sequencing depth also correlates with the statistical power for the detection of aberrant RNA phenotypes. As shown by Yépez, Mertes, et al. (2021), reduction of total sequencing depth from ~86 million reads to ~30 million reads results in the loss of 12% of true positive aberrant expression hits and 54% of pathogenic aberrant splicing events. This indicates that some pathogenic events could be missed due to insufficient power to reach statistical significance. For validation of RNA phenotypes, a manual inspection of the locus is therefore always recommended.
In the setting of a small sample size, it is therefore suggested to integrate publicly available RNA-seq data to increase the power and accuracy of the detection of aberrant RNA phenotypes (Frésard et al., 2019; Yépez, Mertes, et al., 2021). However, the caveat of this approach is the introduction of sample co-variations that need to be controlled for, as demonstrated by several studies (Brechtmann et al., 2018; Frésard et al., 2019; Mertes et al., 2021).
6 EVIDENCE PROVIDED BY RNA PHENOTYPES
6.1 Evaluation of functional evidence of pathogenicity provided by RNA phenotypes
According to the ACMG/AMP guidelines, genetic variants with a certainty of pathogenicity greater than 90% should be considered as likely pathogenic. This concept was further extended by Tavtigian et al. (2018) by defining 99% certainty for pathogenic variants and by the implementation of ACMG/AMP guidelines as a Bayesian framework. In line with this, Brnich et al. (2019) suggested estimating the magnitude of evidence strength that is appropriate for a given functional assay by calculating the OddsPath.
Here, to assess the functional evidence for pathogenicity provided by RNA phenotypes, WES and skin fibroblasts RNA-seq data from 303 individuals were analyzed (Yepez, Gusic, et al., 2021; Yepez, 2021). The total of 394 pathogenic and 723 benign detected variants were used to calculate the OddsPath (Methods, Supporting Information: Table S3). Subsequently, variants were divided into four variant types based on their location and predicted functional consequence: “PTV,” “splice,” “noncoding,” and “coding.” Due to the fact that aberrant expression and splicing quantify variant effect on the gene level, OddsPath analysis was performed separately for genes with mono- and biallelic variants to correctly estimate thresholds. This stratification resulted in 104 biallelic and 290 monoallelic pathogenic variants. The Bayesian framework was applied to each RNA phenotype to investigate how different thresholds affect the strength of functional evidence (see Section 3). Corresponding RNA phenotypes were detected using the DROP pipeline, which includes OUTRIDER packages for aberrant expression analysis, FRASER package for aberrant splicing and negative binomial test for MAE detection.
6.2 Evidence of pathogenicity provided by MAE
MAE is calculated by the ratio of two alleles, due to a variant causing reduced expression of the allele in cis while the second allele in trans is still expressed (Figure 4). Information about both alleles provides evidence of pathogenicity that can be applied in the clinical interpretation of the variants. For variants causing MAE of the allele in trans, OddsPath was calculated for different significance thresholds and allelic ratios (Suppoting Information:Figure S1a, S1b). MAE provides strong evidence of pathogenicity to all significant PTVs (p < 0.05). For noncoding and splice variants, the number of pathogenic variants with MAE was insufficient for robust OddsPath calculation. The vast majority of coding variants did not show an effect on gene expression and therefore can not be interpreted with gene expression as functional evidence. In addition, OddsPath was calculated for different effect size thresholds. Strong evidence for allelic imbalance was achieved if the reference allele represented more than 60% of all transcripts (Supporting Information: Figure S1c).
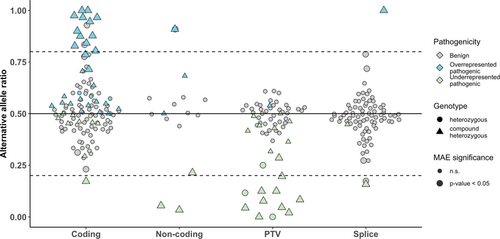
Besides the variant effect on gene expression on the allele in cis, MAE provides allelic evidence of the expressed allele in trans. According to the ACMG/AMP recommendations, for recessive disorders, moderate evidence of pathogenicity (PM3), can be assigned to a variant located in trans with known pathogenic variant (Richards et al., 2015). We evaluated evidence strength for monoallelically expressed variants and identified that moderate allelic evidence of pathogenicity (PM3) could be provided to coding variants with significant (p < 0.05) MAE (Supporting Information: Figure S1c, S1d). For clinical evaluation, manual validation of identified MAE defects using IGV is useful.
6.3 Aberrant expression as functional evidence of pathogenicity PS3
Across studies applying RNA-seq for diagnostics of Mendelian disorders, aberrant expression was defined based on one of two metrics, p value or z-score. Aberrantly expressed genes defined by p value should be interpreted in combination with the effect size, while the z-score, which represents a combination of both parameters, can be interpreted alone. The z-score distribution of benign and pathogenic variants stratified by p value, nominal significance and variant type is shown in Figure 4a. All nominal significant expression outliers are covered by a z-score threshold of −2 and vice versa. The OddsPath was calculated for a series of z-score thresholds for each variant type and for mono- and biallelic defects. A z-score threshold of <−2 provides strong evidence of pathogenicity for biallelic and monoallelic PTV and monoallelic noncoding variants (Figure 5b, Supporting Information: Figure S2b). For biallelic splice and noncoding variants, a more stringent z-score threshold of <−3 is needed to provide strong evidence of pathogenicity. For a z-score <−2 and more stringent thresholds monoallelic splice variants could be provided with supporting evidence of pathogenicity at most.
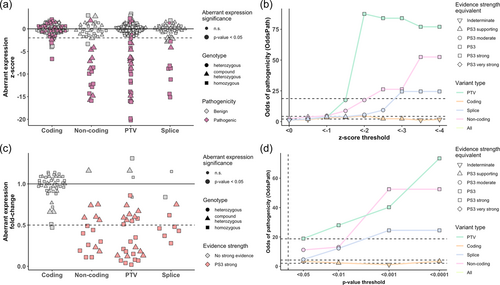
Next, an analogous analysis for different p value cut-offs was performed. Aberrant expression defined with a conventional significance threshold of p < 0.05 supports only a moderate level of pathogenicity, while more stringent thresholds provide strong evidence of pathogenicity to all variant types except for coding and heterozygous splice variants (Figure 4d, Supporting Information: Figure S2d). For the clinical interpretation, it is important to consider effect size. Therefore, the fold-change distribution of pathogenic variants with and without strong evidence of pathogenicity was analyzed. As shown in Figure 4c and Supporting Information: Figure S2c even small changes in the gene expression can support strong evidence of pathogenicity assigned based on the significance or z-score threshold. This finding supports the fact that for genes with tight regulation even small changes in gene expression can be pathogenic. For genome-wide analyses of aberrant expression and prioritization of candidate genes more stringent thresholds defined by multiple testing corrected p value are typically applied. Based on the OddsPath analysis mono- and biallelic PTV and noncoding variants can be provided with strong evidence of pathogenicity under the threshold of false discovery rate (FDR) < 0.1 (FDR; Supporting Information: Figure S3). Biallelic splice variants can be also provided with strong evidence of pathogenicity under the threshold of FDR < 0.1.
6.4 Aberrant splicing as functional evidence of pathogenicity PS3
Aberrant splicing is characterized by two metrics, statistical significance and effect size. Effect size is typically represented as four intron-centric metrics used to quantify different splice events: delta PSI (delta percent spliced in, Δψ) and delta theta (delta of splicing efficiency, Δθ) calculated for both 5′ and 3′ splices sites (Mertes et al., 2021; Pervouchine et al., 2013). Delta PSI represents the percent of transcripts that are spliced differently at a given splice site in comparison to the population mean. Delta theta is a metric introduced to cover intron retention events (Mertes et al., 2021). An effect size (delta PSI) of 30% is equivalent to 30% of transcripts showing aberrant splicing at a given splice site. Since splice defects can be complex and affect more than one splice site, the significance is calculated gene-wise. The effect size distribution of pathogenic and benign variants stratified by variant type and nominal significance is shown in Figure 6a. OddsPath calculation for significant splicing events (p < 0.05) revealed that strong evidence of pathogenicity can be assigned to monoallelic splice variants with an |effect size| >0.15 and biallelic noncoding variants with an |effect size| >0.45 (Figure 6b, Supporting Information: Figure S4). For biallelic noncoding variants with an |effect size| >0.35 strong evidence of pathogenicity was provided. Though it is known that coding variants can have an impact on splicing, the majority of them showed only weak effects on aberrant splicing and hence can not be assigned with functional evidence of pathogenicity according to our results.

For genome-wide analysis of aberrant splicing, a FDR threshold <0.1 is suggested by Mertes et al. (2021). Calculation of OddsPath based on a FDR threshold <0.1 threshold indicated monoallelic splice and noncoding variants achieve the strong level of pathogenicity independent of the effect size threshold (Supporting Information: Figure S5b). For biallelic splice and noncoding variants effect size thresholds for FDR significant aberrant splicing events were consistent with results obtained under nominal significance (Supporting Information: Figure S5a, Figure 6b). Strong evidence of pathogenicity can be provided to biallelic splice variants with an |effect size| >0.45 and biallelic noncoding variants with an |effect size| >0.35. For clinical evaluation, manual validation of identified splice defects using IGV and sashimi plots is mandatory as regions with low coverage could appear as false positives in aberrant splicing analysis.
7 CLINICAL APPLICATION OF THE GUIDELINES AND RECOMMENDATIONS
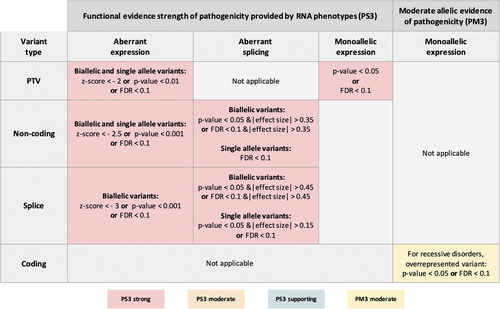
Following a comprehensive analysis, we determined thresholds for each RNA phenotype for strong or moderate functional evidence of pathogenicity (PS3) or moderate allelic evidence (PM3) (Figure 7). This framework informs important elements of the ACMG/AMP guidelines, however, all relevant criteria proposed by ACMG/AMP should be considered together for clinical interpretation of variant pathogenicity. In cases where several RNA phenotypes caused by the variant(s) under investigation are detected, only one, strongest criteria should be assigned. Notably, though detection of aberrant RNA phenotypes can provide strong or moderate evidence to support the pathogenic designation of a variant, RNA-seq can not capture the full spectra of potential functional consequences of the variants. Therefore, the absence of aberrant RNA phenotypes does not necessarily serve as an indication for the benign nature of the variant and therefore we do not recommend the assignment of benign evidence of pathogenicity (BS3). Due to the differences in the statistical procedures implemented in the different methods for aberrant RNA phenotype calling, these criteria are approved only for detection methods implemented in the DROP pipeline.
We hope that these recommendations will help to take advantage of NGS technologies not only on the DNA but also on RNA levels to advance molecular diagnostics by integrating functional evidence evaluation in a high-throughput manner. This study also provides a guideline on how to evaluate functional evidence provided by short-read RNA-seq and could be used as a blueprint for evaluation of the evidence provided by other OMICs techniques. As power for detection and accuracy for calling aberrant RNA phenotypes increases with the number of sequencing data sets available from different tissues, we encourage sharing of count and split-read count data from RNA-seq studies. To ensure updates of the current guidelines with an increasing number of pathogenic variants and size of the RNA-seq data set, we developed a web resource functionalOMICs (prokischlab.github.io/functionalOMICs/), providing an overview of recommendations for the application of RNA-seq in the ACMG/AMP framework.
ACKNOWLEDGMENTS
The authors would like to thank the research group of Julian Gagneur, especially Vicente A. Yépez, as well as Mirjana Gusic, Sarah Stenton and all members of GENOMIT consortia. This study was supported by the BMBF (German Federal Ministry of Education and Research) through the mitoNET German Network for Mitochondrial Diseases (grant number 01GM1906B, PerMiM Personalized Mitochondrial Medicine (grant number 01KU2016A) and E-Rare project GENOMIT (grant number 01GM1207). The Bavarian State Ministry of Health and Care funded this study within its framework of DigiMed Bayern (grant number DMB-1805- 0002). Open Access funding enabled and organized by Projekt DEAL.
CONFLICT OF INTEREST
The authors declare no conflict of interest.
WEB RESOURCES
Functional OMICs: https://prokischlab.github.io/functionalOMICs/
Simple ClinVar: https://simple-clinvar.broadinstitute.org/
ClinVar: https://www.ncbi.nlm.nih.gov/clinvar/
OMIM database: https://www.omim.org/
InterVar: https://wintervar.wglab.org/evds.php
HGVS: https://www.hgvs.org/
HGNS: https://www.genenames.org/
GTEx Portal: https://gtexportal.org/home/


