CAGI 5 splicing challenge: Improved exon skipping and intron retention predictions with MMSplice
Abstract
Pathogenic genetic variants often primarily affect splicing. However, it remains difficult to quantitatively predict whether and how genetic variants affect splicing. In 2018, the fifth edition of the Critical Assessment of Genome Interpretation proposed two splicing prediction challenges based on experimental perturbation assays: Vex-seq, assessing exon skipping, and MaPSy, assessing splicing efficiency. We developed a modular modeling framework, MMSplice, the performance of which was among the best on both challenges. Here we provide insights into the modeling assumptions of MMSplice and its individual modules. We furthermore illustrate how MMSplice can be applied in practice for individual genome interpretation, using the MMSplice VEP plugin and the Kipoi variant interpretation plugin, which are directly applicable to VCF files.
1 INTRODUCTION
RNA splicing is a process that removes intronic sequences from precursor RNAs to form mature RNAs. Alternative splicing occurs when exons are concatenated in alternative combinations (Alberts et al., 2008). Alternative splicing has been shown to be important for tissue development (Baralle & Giudice, 2017). The most common type of alternative splicing in humans is exon skipping (Y. Wang et al., 2015). Skipping of an exon can be quantified with percent spliced-in (PSI, Ψ), which is defined as the fraction of transcripts that include the exon (Goldstein et al., 2016). Another frequently used splicing metric is the splicing efficiency, which we here define as the fraction of spliced transcripts among spliced and unspliced transcripts (Braberg et al., 2013; Soemedi et al., 2017; Wilhelm et al., 2008). With RNA-seq data, the splicing efficiency can be defined for every splice site by considering the number of reads spanning exon-exon junction and the number of reads spanning exon-intron boundaries. Splicing efficiency captures intron retention. Unlike Ψ, which is only relevant for splice sites involved in alternative splicing, splicing efficiency is relevant for all splice sites.
Splicing defect is one of the most frequent causes of Mendelian disorders (Li et al., 2016; López-Bigas, Audit, Ouzounis, Parra, & Guigó, 2005). Moreover, thousands of splicing QTLs have been identified and linked to common diseases (Consortium et al., 2015; Li et al., 2016).
Genetic variants affect splicing in two common ways. They can change alternative splicing, in particular, exon skipping. They can also change splicing efficiency. Various methods have been developed to predict the effect of variants on splicing. Early methods focused on scoring the effects of splice regulatory elements, such as splice sites (Yeo & Burge, 2004), exon splice enhancers and silencers, intronic splicing enhancers, and silencers (Fairbrother, 2002; Fairbrother et al., 2004; Z. Wang, Xiao, Van Nostrand, & Burge, 2006; Zhang & Chasin, 2004; Zhang & Kangsamaksin, 2005), and branch points (Bretschneider, Gandhi, Deshwar, Zuberi, & Frey, 2018; Paggi & Bejerano, 2018). The potential impact of variants using these methods can be assessed with the difference of scores between the reference and the alternative sequence. Other methods focus on predicting Ψ directly. One of the early successful Ψ prediction methods was developed by Barash et al. (2010) using mouse transcriptome data. The model learned a “splicing code” from variations of Ψ across exons and across tissues. Although the model was trained only with the reference genome and not with genetic variants, it could predict the effect of variants on splicing. A similar model, SPANR, was later on developed for the human genome (Xiong et al., 2015). SPANR was successful in predicting pathogenic variants for several diseases. Even though the approach of learning the splicing code from reference sequence was successful, the model may suffer from evolutionary confounding and fail to learn causal features. To address this issue, large-scale perturbation assays, such as massively parallel reporter assay (MPRA) and saturation mutagenesis screens, have been developed (Barash et al., 2010; Xiong et al., 2015; Rosenberg, Patwardhan, Shendure, & Seelig, 2015; Adamson, Zhan, & Graveley, 2018; Ke et al., 2018). In particular, Rosenberg, Patwardhan, Shendure, and Seelig (2015) probed millions of exonic and intronic random sequences to test their impact on splicing. Their model, HAL, improved upon the state-of-the-art performance at predicting variant effects on exon skipping and alternative donor usage.
Perturbation data are ideal to benchmark computational methods for their predictive power on causal effects. The fifth Critical Assessment of Genome Interpretation (CAGI 5) had two splicing challenges with data from such assays: The Vex-seq (Adamson et al., 2018) challenge and the MaPSy (Soemedi et al., 2017) challenge. The tasks of the two challenges were related yet distinct. The Vex-seq experiment assayed 2,059 natural genetic variants, including exonic and intronic single-nucleotide variants (SNVs) and insertion/deletions (indels). The measured quantity was Ψ. The MaPSy experiment measured the impact of 5,761 exonic disease-causing missense mutations on splicing. The assay was performed both in vivo and in vitro. Approximately 10% of the mutations significantly altered splicing (intron retention) both in vivo and in vitro. Such variants were defined as exonic splicing mutations (ESM). The measured quantity was splicing efficiency (Section 2). Although the two challenges have different measured quantities, we assumed that variant disrupting splicing could affect both Ψ and splicing efficiency. Therefore, we applied a modular modeling approach, MMSplice (Cheng et al., 2019), where the modules score different gene regions and are shared across challenges. The predictors proposed for each challenge differed only in how they combine the scores of the individual modules.
We have described MMSplice and the modular modeling strategy previously (Cheng et al., 2019). In this CAGI special issue, we focus on the application of MMSplice to the CAGI 5 challenges. In particular, we provide insights into modeling assumptions and about the module architecture. We also emphasize model and variant interpretation, as these are relevant for downstream human genetic applications.
2 METHODS
2.1 Modular modeling approach for the Vex-seq and MaPSy challenges
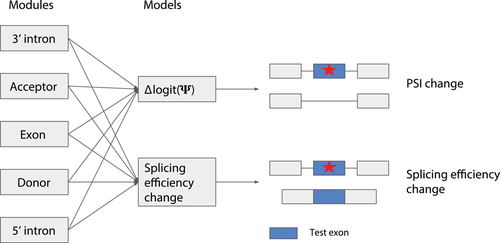
The Vex-seq data covered variants from both exons and introns. We noticed that the training data from CAGI for both challenges were limited with 957 training data points for Vex-seq and 4,964 for MaPSy. It is probably difficult to train a model capturing much of the splicing regulatory elements directly from these data. Therefore, we used complementary data from different sources that are richer (Cheng et al., 2019). We used the GENCODE 24 annotation to train a module to score donor sites and similarly a module to score acceptor sites. In total, 524,569 training data points and 131,143 evaluation data points were used to train the donor module while 566,822 training data points and 141,706 evaluation data points were used to train the acceptor module. The modules were trained by training classifiers to distinguish annotated splice sites from random sequences around the selected splice sites (with some bias to sequence with splice dinucleotide [Cheng et al., 2019]). We further used data from a massively parallel reporter assay (MPRA) that probed the effect of 2 million random sequences on splicing (Rosenberg et al., 2015). The MPRA data had exonic and intronic random sequences, from which we trained modules to score exon and modules to score intron (Cheng et al., 2019). In total, we trained six modules: donor, acceptor, 5′ exon, 3′ exon, 5′ intron, and 3′ intron. The detailed descriptions of all modules and their training methods are given in Cheng et al. (2019). To score variants for their effect on Ψ (∆Ψ) and splicing efficiency, we trained separate linear models from modular predictions from a common set of modules (Figure 1). Our modules collectively consider the sequence of the whole exon and 100 nt flanking intron from both sides and therefore score variants in this range.

MMSplice model for Vex-seq and MaPSy challenges
2.2 Vex-seq challenge
2.2.1 Data processing
The Vex-seq data tested 2,059 variants from the Exome Aggregation Consortium for their effect on Ψ (Adamson et al., 2018). For each variant-exon pair, Ψ for the reference sequences and the alternative sequences were measured on minigene reporters with RNA-Seq. The assessed variants included SNVs as well as short indels from both exonic and intronic regions. The Vex-seq CAGI challenge provided 957 variants from chromosome 1 to chromosome 8 for training. For each variant, the tested exon coordinates and the associated reference Ψ and ∆Ψ were provided. The test data consisted of 1,054 variants from chromosome 9–22 and chromosome X. The reference Ψ values for the exons with reference sequences were provided. The predictors had to predict ∆Ψ for each variant.
2.2.2 Vex-seq model
 (1)
(1) and the predicted log odds ratios (Cheng et al., 2019).
 (2)
(2) (3)
(3) (4)
(4)2.3 MaPSy challenge
2.3.1 Data processing
 (5)
(5) is the mutant spliced RNA read count,
  is the mutant input (unspliced) RNA read count,
  is the wild-type spliced RNA read count, and
  is the wild-type input RNA read count (Cheng et al., 2019; Soemedi et al., 2017). Transcripts with skipped exons or mis-splicing were ignored.
2.3.2 MaPSy model
In vivo
 (6)
(6)In vitro
 (7)
(7)Exon splicing mutation classification
-
MMSplice 5′ exon module score for the wild-type sequence
-
MMSplice donor module score for the wild-type sequence
-
MMSplice acceptor module score for the wild-type sequence
-
Experiment exon length, which is the exon length in the experimental construct and may differ from the annotated genomic exon
-
Log-transformed wild-type in vitro input
-
Log-transformed mutant in vitro input
-
Target exon phastcons conservation score (Siepel et al., 2005)
-
Target exon flanking intron length in ensemble 75 annotation
Features were selected with threefold cross-validation. Besides the above features, scores from CADD, SIFT, phastCons, LoFtool, and GC content change were also initially considered but not selected because they did not improve the prediction performance.
2.4 VEP plugin
We have developed an Ensembl VEP (McLaren et al., 2016) plugin, which integrates the functionalities of our algorithm to VEP. The VEP plugin allows direct analysis of VCF file using the VEP database and services with a common API to existing VEP plugins or pipelines. The plugin is written in Perl based on 'BaseVepPlugin' interface recommended by Ensembl. During the analysis, the plugin executes the following steps: it matches corresponding exons for each variant, obtains reference and alternative sequences using VEP APIs, sends those sequences to MMSplice python package with standard input, and fetches associated scores from the standard output. We found this to be the simplest way for the plugin to communicate with the MMSplice python package. Moreover, a Docker container that contains all the dependencies including VEP is provided to facilitate installation and usage of the plugin at https://github.com/gagneurlab/MMSplice/tree/master/VEP_plugin.
2.5 Evaluation
For all regression tasks, we chose the Pearson correlation (R) as the primary evaluation metric. However, as the Pearson correlation is invariant to affine transformations, we also report the root-mean-square errors (RMSE), which measures the deviation between predicted values and measured ones. For all classification tasks, we report the precision-recall curve and the area under the curve (auPR) for the cases where there is a strong class imbalance. For the cases where the classes are balanced, we chose to use the receiver operating characteristic (ROC) curve and report area under the ROC curve (auROC).
3 RESULTS
3.1 Training performance of modular models
The donor and acceptor modules were trained by classifying annotated splice sites versus random sequences selected around annotated splice sites of the GENCODE 24 genome annotation (Cheng et al., 2019). Both modules were able to distinguish annotated splice sites with high accuracy on the validation dataset (auROC = 0.98 for both donor and acceptor modules, Figure 2a,b).

Performance of individual MMSplice modules. (a) ROC curve for the donor module on the evaluation data. (b) ROC curve for the acceptor module on the evaluation data. (c) Predicted (y-axis) versus measured (x-axis) Ψ3 on the evaluation data from the splicing MPRA (Rosenberg et al., 2015) with the 3′ exon module. (d) Predicted (y-axis) versus measured (x-axis) Ψ3 on the evaluation data from the splicing MPRA (Rosenberg et al., 2015) with the 5′ intron module. MPRA, massively parallel reporter assay; ROC, receiver operating characteristic
We evaluated our exon modules and intron modules on predicting Ψ5 and Ψ3 measured by the MPRA experiment (Cheng et al., 2019; Soemedi et al., 2017). Our 3′ exon module and 5′ intron module predicted Ψ3 for the A5SS library with a correlation of 0.77 and 0.31, respectively (Figure 2c,d). Note that all the predictions were done with a single module ignoring all other information. This approach is not comparable to the Rosenberg et al (Rosenberg et al., 2015) approach, which used complete sequence information.
3.2 Vex-seq data does not support additive variant effects on the natural scale
The Vex-seq challenge requested to predict ∆Ψ. However, Ψ is bounded to [0,1]. This constrains the predictions. For instance, for a reference Ψ close to 1, ∆Ψ cannot be largely positive. The CAGI 5 organizers therefore also provided the reference Ψ level. MMSplice models additive effects in the log odds scale (∆logit(Ψ), Equation 2; Section 2). Application of the logistic function ensures the predictions of the alternative Ψ to be bounded to the [0,1] interval. An alternative approach would have been to model additive effects in the natural scale and to cap all predictions to the [0,1] interval.
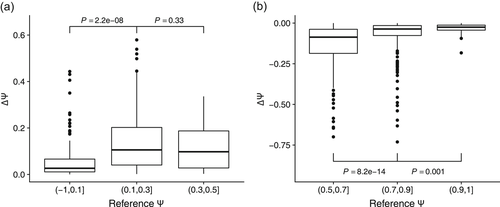
We investigated whether the Vex-seq data would support the additive natural scale model. To this end, we looked first at all Vex-seq data for which (a) the reference Ψ level was lower than 0.5 and (b) ∆Ψ was positive. If the effects of variants were additive in the natural scale and independent of the reference Ψ level, then we would expect larger deviations for the constructs with Ψref close to 0 as they can increase by as much as 1, compared with constructs with Ψref close to 0.5, which are bounded to increase by not more than 0.5. In fact, we observed the opposite trend as ∆Ψ values for variants with Ψref close to 0 were significantly smaller (P = 2.2e−08, Figure 3a). The same was also observed for the Vex-seq data for which (a) the reference Ψ level was larger than 0.5 and (b) ∆Ψ was negative (Figure 3b). Hence, the effects of variants appeared to be larger for Ψref close to 0.5 than for Ψref close to 0 or 1. This observation further motivated modeling Ψ as a result of the logistic function, which has the smallest gradient around 0 and 1 and the largest gradient at 0.5.

The difference of Ψ depends on reference Ψ. (a) Boxplot Ψ change (y-axis) on different bins of reference Ψ level (x-axis) for variants with reference Ψ smaller than 0.5 and ∆Ψ positive. (b) Boxplot Ψ change (y-axis) on different bins of reference Ψ level (x-axis) for variants with reference Ψ greater than 0.5 and ∆Ψ negative. p values were calculated by the Mann–Whitney U test
3.3 Vex-seq challenge: Predicting variant effect on exon skipping level
We trained a linear model from the modular predictions to predict ∆Ψ from the 957 training variants provided by Vex-seq challenge. As the Vex-seq variants originated from both intron and exon, five potentially overlapped modules were used: 3′ intron, acceptor, 5′ exon, donor, and 5′ intron. We used a 5′ exon module instead of the 3′ exon module because it performed better on the Vex-seq training data (McLaren et al., 2016). In total, nine parameters were trained (Section 2).
On the Vex-seq training data, MMSplice was able to score all variants including indels. When separating the variants into 3′ intron, exon and 5′ intron, MMSplice had a good performance in all three regions (3′ intron: R = 0.78, RMSE = 0.09; Exon: R = 0.61, RMSE = 0.11; 5′ intron: R = 0.72, RMSE = 0.11; Figure 4; Table S1).

Evaluation of MMSplice predicting ∆Ψ on Vex-seq training data for variants in 3′ intron (left), exon (middle), and right (5′ intron). Predicted ∆Ψ (x-axis) versus measured ∆Ψ (y-axis). The dotted line marks the y = x diagonal
On the unseen test data, MMSplice had similar performance compared with the training data (R = 0.68, RMSE = 0.1; Cheng et al., 2019), indicating that we did not overfit the training data. Moreover, we outperformed the state-of-the-art methods SPANR (R = 0.26, RMSE = 0.14; Xiong et al., 2015), and HAL (R = 0.44, RMSE = 0.28; Rosenberg et al., 2015), indicating that the modular approach was effective (Cheng et al., 2019). This model ranked the first on the Vex-seq challenge.
3.4 MaPSy challenge
Encouraged by the results on Vex-seq data, we trained linear models similarly on the MaPSy challenge training data for in vivo and in vitro separately with a log-allelic ratio as the response variable (Section 2). We first focused on training MMSplice for predicting the log-allelic ratio (splicing efficiency change, Section 2). On the training data, MMSplice accurately predicted variant effects on splicing efficiency both in vivo (R = 0.59, RMSE = 1.02) and in vitro (R = 0.56, RMSE = 0.04; Figure 5a,b; Table S2). On the unseen test data, MMSplice was still accurate (Cheng et al., 2019). Our log-allelic ratio prediction was the most accurate one in the MaPSy challenge.

Evaluation MMSplice on MaPSy. Scatter plot of predicted splicing efficiency change versus measured splicing efficiency change for in vivo (a) and in vitro (b) training data. (c) Precision-Recall curve of classifying exon splicing mutations (ESMs) on MaPSy test data
We then trained a classifier to classify ESMs (Section 2). On the training data, the classifier had auPR 0.3 (Figure 5c). On the unseen test variants, the classifier had auPR 0.19 (Figure 5c; Table S2).
3.5 Variant interpretation
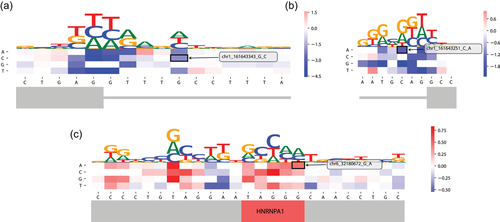
To support the interpretation of the predictions made by MMSplice, we followed the in silico mutagenesis approach. In silico mutagenesis computes predictions for every possible SNV for a given input sequence, and display the predictions in a heat map called mutation map. The mutation map allows assessing the relative importance of variants compared with other possible variants in the vicinity. The MMSplice implementation followed the Kipoi API (version 0.65), a programmatic standard for predictive models in genomics (Avsec et al., 2019). In particular, it is compatible with the Kipoi variant effect prediction plugin allowing the generation of mutation maps. As an illustrative example, we considered the variant (rs746677712; Figure 6a). This variant lies 5 nucleotides inside the intron near the donor site of exon 5 of the gene FCGR2B. MMSplice predicts this variant to increase the skipping of this exon compared with reference sequence with an odds ratio of 0.14 (log odds ratio = −1.99). The mutation maps also shows that, for the considered sequence, only SNVs on the canonical 5′ dinucleotide GT or the last two bases of the exon AG can lead to effects on exon skipping of similar amplitude (Figure 6a). Similarly, the variant rs773534127 close to the acceptor of exon 5 was predicted to strongly decrease exon inclusion level with an odds ratio of 0.20 (log odds ratio = −1.59), nearly as strong as the predicted effect of SNVs on the canonical dinucleotide AG (Figure 6b). Mutation maps are also useful to identify possible splicing regulatory elements as consecutive nucleotides that are predicted to have a strong impact on splicing when mutated. One illustrative example is provided with the mutation map around the variant rs751723286 (Figure 6c). This SNV affects the motif TAGGG, which is the binding site of Heterogeneous Nuclear Ribonucleoprotein A1 (HNRNPA1), an import splicing regulatory RNA binding protein (Burd & Dreyfuss, 1994). The mutation map shows that every mutation on this motif is predicted to increase exon inclusion level, consistent with the repressive role of HNRNPA1 on exon inclusion (Mayeda & Krainer, 1992).

In silico mutagenesis analysis of example MMSplice predictions. Red color indicates variant increase Ψ while blue color indicates variant decrease Ψ. Alphabet letter height indicates effect magnitude. Gray bars are gene structure schema, thick ones are exons while thin ones are introns. (a) G to C mutation close to the donor site. (b) C to A mutation close to the acceptor site. (c) Exonic G to A mutation
4 CONCLUSION
We have participated in two CAGI 5 splicing prediction challenges, Vex-Seq and MaPSy, with a single modeling framework MMSplice which ranked among the best on both challenges. The reasons for the success of MMSplice are multiple. First, we have trained the model mostly on richer complementary functional genomics data with about three orders of magnitude more data points than the CAGI challenge data. We have used the CAGI data only to fit a very few numbers of parameters for each model. Second, we have worked on the log odds scale rather than on the natural scale. This was not only justified by mathematical convenience but also by the Vex-seq data which showed that the higher impacts of variants were found for intermediate levels of splicing. Third, we made use of an existing high-throughput perturbation assay (Rosenberg et al., 2015) to fit the model. Because the number of publications with MPRAs keeps increasing, such datasets will play a major role in building predictive models for genomics in the future as they allow capturing causal effects. Fourth, we have used a modular approach so that we could reuse elements of the model for one challenge in the other challenge.
Depending on the assay and the genomic region of the variants, the correlation between MMSplice predicted changes and the measured changes varies between 0.56_(in vitro MaPSy) and 0.78 (3′ intronic variants for Vex-seq). The effects of many assayed variants are small, and therefore cannot be precisely predicted because their estimates are likely dominated by noise. Moreover, MMSplice might be improved by overcoming the following limitations: First, Ψ is also be affected by the stabilities (half-lives) of different isoforms. Second, the effect of certain splicing motifs dependent on the position with respect to splice sites (Erkelenz et al., 2012), which we did not model. Third, our exon and intron modules were learned from alternative 5′ and 3′ splicing events instead of exon skipping directly. Hence, they may not fully capture the biology of exon skipping. Fourth, as splicing is tissue-specific, a model that is specific for the target tissue or cell type might perform better.
Our current model will likely, and hopefully, be soon superseded by future models integrating more data. However, we hope that some of the principles identified here will be useful. In particular, we believe that if models would adopt a modular structure and satisfy some reasonable degree of compatibility, the community could more efficiently leverage models from each other. We provide MMSplice and all the individual modules in the model repository Kipoi, which could be helpful to this end.
ACKNOWLEDGEMENT
The CAGI experiment coordination is supported by NIH U41 HG007346 and the CAGI conference by NIH R13 HG006650. J.C. was supported by the Competence Network for Technical, Scientific High-Performance Computing in Bavaria KONWIHR. Z.A. and J.C. were supported by a Deutsche Forschungsgemeinschaft fellowship through the Graduate School of Quantitative Biosciences Munich.
CONFLICT OF INTERESTS
The authors declare that there are no conflict of interests.


