Distinct Hepatic Gene-Expression Patterns of NAFLD in Patients With Obesity
Supported by the National Institutes of Health (R01 DK114144 to K.E.C., K23 DK113220 to L.E.D., K24 HL092902 to K.K.M., and K24 DK109940 to M.A.B) and by the German Research Foundation (DR 1161/1-1 to H.K.D. and BA 7175/1-1 to L.M.B.).
Potential conflict of interest: Dr. Bhatia consults for and owns intellectual property rights in Glympse Bio. Dr. Corey advises Novo Nordisk, Gilead, and Theratechnologies. Dr. Chung received grants from Boehringer Ingelheim, BMS, Roche, Merck, Gilead, Janssen, and GSK. Dr. Dichtel received grants from Pfizer and Perspectum. Dr. Gee consults for COVIDIN and Medtronic. She advises New View Surgical, Inc. Dr. Meireles consults for and received grants from Olympus. Dr. Miller received grants from Amgen and Pfizer. She owns stock and equity in BSX, GE, BDX, and BMY. Dr. Warren is employed by Third Rock Ventures. He owns stock in and patents with Glympse Bio. He owns patents with Massachusetts Institute of Technology.
Abstract
Approaches to manage nonalcoholic fatty liver disease (NAFLD) are limited by an incomplete understanding of disease pathogenesis. The aim of this study was to identify hepatic gene-expression patterns associated with different patterns of liver injury in a high-risk cohort of adults with obesity. Using the NanoString Technologies (Seattle, WA) nCounter assay, we quantified expression of 795 genes, hypothesized to be involved in hepatic fibrosis, inflammation, and steatosis, in liver tissue from 318 adults with obesity. Liver specimens were categorized into four distinct NAFLD phenotypes: normal liver histology (NLH), steatosis only (steatosis), nonalcoholic steatohepatitis without fibrosis (NASH F0), and NASH with fibrosis stage 1-4 (NASH F1-F4). One hundred twenty-five genes were significantly increasing or decreasing as NAFLD pathology progressed. Compared with NLH, NASH F0 was characterized by increased inflammatory gene expression, such as gamma-interferon-inducible lysosomal thiol reductase (IFI30) and chemokine (C-X-C motif) ligand 9 (CXCL9), while complement and coagulation related genes, such as C9 and complement component 4 binding protein beta (C4BPB), were reduced. In the presence of NASH F1-F4, extracellular matrix degrading proteinases and profibrotic/scar deposition genes, such as collagens and transforming growth factor beta 1 (TGFB1), were simultaneously increased, suggesting a dynamic state of tissue remodeling. Conclusion: In adults with obesity, distinct states of NAFLD are associated with intrahepatic perturbations in genes related to inflammation, complement and coagulation pathways, and tissue remodeling. These data provide insights into the dynamic pathogenesis of NAFLD in high-risk individuals.
Abbreviations
-
- BMI
-
- body mass index
-
- C4BPB
-
- complement component 4 binding protein beta
-
- COL1A1
-
- collagen, type I, alpha 1
-
- COL1A2
-
- collagen, type I, alpha 2
-
- CVD
-
- cardiovascular disease
-
- CXC
-
- chemokine (C-X-C motif)
-
- HCC
-
- hepatocellular carcinoma
-
- HDL
-
- high-density lipoprotein
-
- IFI30
-
- gamma-interferon-inducible lysosomal thiol reductase
-
- KEGG
-
- Kyoto Encyclopedia of Genes and Genomes
-
- LDL
-
- low-density lipoprotein
-
- MMP
-
- matrix metalloproteinase
-
- NAFLD
-
- nonalcoholic fatty liver disease
-
- NASH
-
- nonalcoholic steatohepatitis
-
- NLH
-
- normal liver histology
-
- PON3
-
- paraoxonase 3
-
- TGFB1
-
- transforming growth factor beta 1
Nonalcoholic fatty liver disease (NAFLD) is the most common cause of chronic liver disease worldwide, with an estimated global prevalence of 25% among adults.(1) It is associated with obesity, dyslipidemia, hypertension, and insulin resistance.(2, 3) NAFLD can progress from steatosis, to nonalcoholic steatohepatitis (NASH), NASH with fibrosis, and ultimately cirrhosis, which confers an elevated risk of hepatocellular carcinoma (HCC).(4, 5) Over the last two decades, NAFLD cirrhosis and HCC secondary to NAFLD cirrhosis have become leading indications for liver transplantation in the United States.(6-8)
Obesity is an independent, dose-dependent risk factor for NAFLD,(9) but only a subset of obese patients develop NAFLD and only a subset of these progress to NASH and cirrhosis.(10, 11) Currently, our understanding of the molecular mechanisms initiating and driving disease progression remains limited, hampering the accurate identification of patients at highest risk for liver-related morbidity and the design of specific preventative and therapeutic strategies. Human studies of NAFLD-associated molecular pathways are important for their direct relevance, but most human studies are limited by small sample sizes, inclusion of small numbers of advanced NAFLD, and control groups without similar risk factors (Table 1).(12-25)
| Details of Human Liver Samples Used by Past Studies | Sequencing Platform | References | |
|---|---|---|---|
| 1 | NASH: 16; NAFL: 15; obese: 12; normal weight: 14 | RNA-seq | Suppli et al.(12) |
| 2 | All stages of NAFLD: 45; control: 18 | Microarray | Ahrens et al.(13) |
| 3 | NAFLD: 27; steatohepatitis: 25; obese controls: 15 | Microarray | Teufel et al.(14) |
| 4 | Steatosis: 20; NASH: 19; healthy controls: 24 | Microarray | Arendt et al.(15) |
| 5 | NASH F0-F1: 40; NASH F3-F4: 32; validation cohort (NAFLD): 17 | Microarray | Moylan et al.(16) |
| 6 | Steatohepatitis: 8; steatosis: 14; controls: 10 (for microarray) and steatohepatitis: 10; steatosis: 30; controls: 18 (for quantitative real-time PCR) | Microarray and quantitative real-time PCR | Starmann et al.(17) |
| 7 | High-grade steatosis: 5; low-grade steatosis: 3; normal: 1 | Microarray | Wruck et al.(18) |
| 8 | NASH: 27; steatosis with nonspecific inflammation: 52; steatosis alone: 12; obese control: 7 | Microarray | Younossi et al.(19) |
| 9 | NASH: 29; steatosis alone: 12; obese control: 7; nonobese control: 6 | Microarray | Younossi et al.(20) |
| 10 | Bridging fibrosis, incomplete cirrhosis, cirrhosis: 65; lobular inflammation: 53; normal histology: 24 | RNA-seq | Gerhard et al.(21) |
| 11 | NAS score 0-1: 8; NAS score 2-4: 28; NAS score 5-6: 25 | RNA-seq | Hoang et al.(22) |
| 12 | NASH: 24; NAFLD: 23; healthy obese: 24; normal control: 38 | Microarray | Horvath et al.(23) |
| 13 | Normal liver/isolated steatosis: 94; severe NAFLD: 31 | RNA-seq | Baselli et al.(25) |
| 14 | Steatotic liver: 48; control 43 | Microarray | Šeda et al.(24) |
- Abbreviations: NAFL, nonalcoholic fatty liver; NAS, NAFLD activity score; PCR, polymerase chain reaction; RNAseq, RNA sequencing.
To obtain a more robust understanding of the molecular pathways that are differentially regulated during NAFLD disease progression, we examined gene expression in whole liver tissues from a cohort of 318 individuals with a high risk of fatty liver disease based on body mass index (BMI), but with a wide spectrum of liver pathology from normal liver tissue to NASH with fibrosis. Using the NanoString nCounter assay, we quantified the expression of 795 genes with known and presumed relevance to liver disease and fibrosis. We hypothesized that distinct transcriptional profiles characterize different NAFLD stages, with increasingly disease severity accruing progressive enrichment of dysregulated molecular pathways.
Participants and Methods
Study Population
Two groups of obese adults ([1] those with NAFLD evaluated in the Massachusetts General Hospital (MGH) NAFLD clinic (5%) and [2] those undergoing bariatric surgery [95%]) were enrolled prospectively in the MGH NAFLD cohort between December 2010 and 2016. Adults with radiographic NAFLD underwent percutaneous liver biopsy, and adults undergoing bariatric surgery had standard-of-care wedge liver biopsies performed intra-operatively. Half of each tissue biopsy was immediately flash frozen and stored at −80°C, and the remaining half was formalin-fixed and paraffin-embedded for clinical pathology evaluation. In total, 318 adults with available liver tissue were included in this study. Biopsies were read in a blinded manner by a hepatopathologist (Ricard Masia) for the presence of NAFLD. Normal liver was defined as <5% and NAFLD as >5% of hepatocytes with macrovesicular steatosis.(26) NASH was defined by the predominance of zone 3 macrovesicular steatosis, hepatocyte ballooning grade ≥1, and lobular inflammation grade ≥1 (presence of at least 1 foci per ×200 field) as defined by the NASH Clinical Research Network (NASH CRN).(26) Fibrosis was staged using the NASH CRN system, which grades fibrosis on a scale from 0 (absent) to 4 (cirrhosis). Liver biopsy specimens were categorized as (1) normal liver histology (NLH), (2) steatosis only (steatosis), (3) NASH without fibrosis (NASH F0), or (4) NASH with fibrosis (NASH F1-F4).
Messenger RNA Extraction and Gene-Expression Analysis
RNA extraction was performed on 5-20 μg of liver tissue using the miRNeasy Mini Kit (Qiagen, Hilden, Germany) for flash-frozen samples for the RNA-later liver and High Pure FFPET RNA Isolation Kit (Roche Life Science, Basel, Switzerland) for formalin-fixed paraffin-embedded tissue samples, according to the manufacturer’s instructions. RNA quantity and quality were assessed using an Agilent 2100 bioanalyzer (Santa Clara, CA). RIN numbers, ranging from 1.5 to 9, are appropriate for use with the nCounter Technology.(27)
Gene-expression analysis of liver samples was conducted using a NanoString probeset with 5 housekeeping genes and 795 target genes (Supporting Table S1), which were selected based on published evidence for a putative role in hepatic steatosis, inflammation, and fibrosis.
Analysis of Gene-Expression Data and Pathway Analysis
NanoString raw data were normalized to housekeeping genes (clathrin heavy chain [CLTC], glucuronidase beta [GUSB], phosphoglycerate kinase 1 [PGK1], succinate dehydrogenase complex flavoprotein subunit A [SDHA], and tubulin beta class I [TUBB]). The statistical limma R package (R Core Team, version 3.6.3) was used for differential expression analysis across NAFLD groups.(28) Linear models were developed and adjusted for covariates, namely, age, sex, diabetes status, and BMI. To correct for multiple comparisons, a P value cutoff was used, as target genes (795 genes) were not randomly selected; therefore, standard techniques to correct for multiple comparisons were not used, as suggested by NanoString Technologies.(29) We chose a stringent P value cutoff of 0.01 to reduce the chance of false-positive results. To determine increasing or decreasing of gene expression in a trend manner, we performed TukeyTrend analysis.(30) Volcano plots, heatmap plots, and gene count plots were created using the Enhancedvolcano package(31) and the Seurat(32) and the Ggpubr R packages, respectively.
Common hits between differentially expressed genes and trend analysis genes were subjected to gene-set enrichment analysis (GSEA).(33) Metric score used to generate rank list was based on sign of coefficient from trend analysis multiplied by the inverse of the P value. The curated immunological gene set collection of the Molecular Signature Database was used for GSEA.(34)
Data and Code Availability
The programming code for R are available upon request, addressed to the corresponding author ([email protected]). The NanoString processed and raw data are available at the National Center for Biotechnology Information GEO repository (accession number GSE163211).
Statistical Analysis
Descriptive statistics were calculated for demographic and clinical characteristics. Comparisons were performed using chi-square tests or Fisher exact tests for categorical variables and t-tests, or Wilcoxon rank-sum tests for continuous variables, depending on the normality of the distribution.
Results
Clinical Characteristics
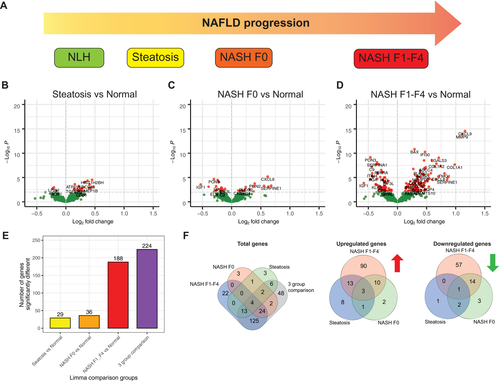
To define transcriptional states associated with distinct states of NAFLD, we assembled a liver biopsy repository for NanoString analysis including tissues from 318 individuals with severe obesity, a median BMI of 45.3 (interquartile range [IQR]: 41.3-51.7). The other demographic and clinical characteristics of the study cohort are given in Table 2. The cohort was predominantly female (76%) and White (63%). Median age was 44 years (IQR: 35-53 years), and metabolic comorbidities included dyslipidemia (36%), type 2 diabetes (29%), and coronary artery disease (7%). Based on histological evaluation, liver disease status was classified into four categories: NLH (n = 76, 24%), steatosis (n = 88, 28%), NASH without fibrosis or NASH F0 (n = 72, 23%), and NASH with fibrosis or NASH F1-F4 (n = 82, 26%), as shown in Fig. 1A.
| Level | Overall | NLH | Steatosis | NASH F0 | NASH F1-F4 | P Value | |
|---|---|---|---|---|---|---|---|
| n | 318 | 76 | 88 | 72 | 82 | ||
| Age (in years) | 44.0 [35.0, 53.0] | 41.0 [33.0, 51.0] | 46.5 [36.0, 54.3] | 45.0 [34.6, 53.0] | 45.0 [35.3, 56.0] | 0.146 | |
| Sex (%) | Female | 243 (76.4) | 65 (85.5) | 65 (73.9) | 59 (81.9) | 54 (65.9) | 0.018 |
| Male | 75 (23.6) | 11 (14.5) | 23 (26.1) | 13 (18.1) | 28 (34.1) | ||
| Race (%) | Hispanics | 19 (6.0) | 4 (5.3) | 6 (6.8) | 3 (4.2) | 6 (7.3) | 0.011 |
| Non-Hispanic Black | 98 (30.8) | 36 (47.4) | 27 (30.7) | 22 (30.6) | 13 (15.9) | ||
| Non-Hispanic White | 199 (62.6) | 35 (46.1) | 54 (61.4) | 47 (65.3) | 63 (76.8) | ||
| Unknown | 2 (0.6) | 1 (1.3) | 1 (1.1) | 0 (0.0) | 0 (0.0) | ||
| BMI (kg/m2) | 45.3 [41.3, 51.7] | 44.9 [40.8, 49.9] | 44.0 [41.0, 50.3] | 45.4 [42.1, 52.7] | 47.2 [42.1, 53.3] | 0.121 | |
| Weight (kg) | 127.3 [113.7, 145.1] | 122.6 [112.9, 137.2] | 123.0 [113.9, 140.6] | 131.5 [112.7, 151.4] | 135.6 [116.0, 155.1] | 0.042 | |
| Comorbidities | |||||||
| Coronary artery disease (%) | No | 297 (93.4) | 71 (93.4) | 82 (93.2) | 68 (94.4) | 76 (92.7) | 0.977 |
| Yes | 21 (6.6) | 5 (6.6) | 6 (6.8) | 4 (5.6) | 6 (7.3) | ||
| Dyslipidemia (%) | No | 202 (63.7) | 59 (77.6) | 60 (69.0) | 45 (62.5) | 38 (46.3) | <0.001 |
| Yes | 115 (36.3) | 17 (22.4) | 27 (31.0) | 27 (37.5) | 44 (53.7) | ||
| Type 2 diabetes (%) | No | 225 (70.8) | 70 (92.1) | 68 (77.3) | 51 (70.8) | 36 (43.9) | <0.001 |
| Yes | 93 (29.2) | 6 (7.9) | 20 (22.7) | 21 (29.2) | 46 (56.1) | ||
| Laboratory values | |||||||
| log10(ALT in U/L) | 1.48 [1.34, 1.62] | 1.37 [1.26, 1.51] | 1.45 [1.36, 1.57] | 1.52 [1.40, 1.62] | 1.61 [1.48, 1.76] | <0.001 | |
| log10(AST in U/L) | 1.30 [1.18, 1.45] | 1.26 [1.11, 1.34] | 1.30 [1.20, 1.41] | 1.26 [1.14, 1.40] | 1.43 [1.32, 1.54] | <0.001 | |
| Total cholesterol (mg/dL) | 175.5 [148.7, 196.0] | 174.0 [149.0, 200.5] | 182.0 [154.5, 202.5] | 177.0 [150.0, 195.3] | 167.0 [140.3, 187.7] | 0.069 | |
| HDL (mg/dL) | 43.0 [36.0, 52.0] | 46.0 [40.0, 56.0] | 45.0 [37.5, 53.0] | 41.5 [37.7, 52.5] | 37.0 [33.0, 46.0] | <0.001 | |
| LDL (mg/dL) | 101.0 [83.0, 122.0] | 100.0 [84.0, 121.7] | 107.0 [86.5, 127.0] | 101.0 [87.0, 118.5] | 97.0 [69.0, 110.0] | 0.052 | |
| Triglycerides (mg/dL) | 121.0 [84.7, 172.3] | 89.0 [67.0, 135.0] | 123.0 [85.5, 158.5] | 120.5 [85.0, 182.0] | 145.5 [112.0, 194.7] | <0.001 | |
| Creatinine (mg/dL) | 0.75 [0.66, 0.86] | 0.75 [0.68, 0.88] | 0.72 [0.61, 0.79] | 0.75 [0.70, 0.86] | 0.83 [0.68, 0.95] | 0.272 |
Notes:
- Values for categorical variables are expressed as n (percentage), and continuous variables are presented in the form of median [interquartile range].
- Abbreviations: ALT, alanine aminotransferase; AST, aspartate aminotransferase.
Differences in Gene Expression of Normal Liver Versus the Different Stages of NAFLD and NASH
Multigroup comparison between the different NAFLD disease states with NLH showed that 224 of 795 genes were differentially expressed between any of the disease states and healthy liver (NLH) (Fig. 1E,F and Supporting Table S5). As expected, the degree of differential gene expression varied among different disease stages. Comparing steatosis with NLH, we detected 29 differentially expressed genes, most of which were up-regulated in steatosis, including inflammatory markers such as tumor necrosis factor (Fig. 1B,E,F and Supporting Table S2). Similarly, comparing NASH F0 versus NLH revealed 36 genes to be differentially expressed, including down-regulation of paraoxygenase-3 (PON3) and insulin-like growth factor 1 and up-regulation of perilipin-2 and chemokine (C-X-C motif) ligand 9 (CXCL9) (Fig. 1C,E,F and Supporting Table S3). Complement-related genes such as C8B and C9 were down-regulated (Fig. 1C and Supporting Table S3). Overall, the analysis revealed limited dysregulation within the selected gene set during early stages of NAFLD compared to obese patients with NLH.
NASH F1-F4 liver tissue was characterized by 188 genes with significantly different expression levels compared with NLH (Fig. 1D-F and Supporting Table S4). We found increased expression of 117 genes, including mediators of tissue remodeling (e.g., collagen, type I, alpha 1 [COL1A1], collagen, type I, alpha 2 [COL1A2], connective tissue growth factor), cytokines and hepatokines (e.g., chemokine [C-C motif] ligand 21 [CCL21], CCL5, CXCL9, CXCL8), and molecules involved in cell-matrix interactions (e.g., a disintegrin and metallopeptidase 10 [ADAMTS10], ADAM17, galectin 3 [LGALS3]). Seventy-one genes were down-regulated in NASH F1-F4 compared with NLH, including genes encoding for proteins involved in lipid metabolism (e.g., PON3, peroxisome proliferator–activated receptor alpha), immune subset–defining genes (e.g., CD14), and genes encoding for components of the complement system (e.g., C8B, C9) (Supporting Table S4).
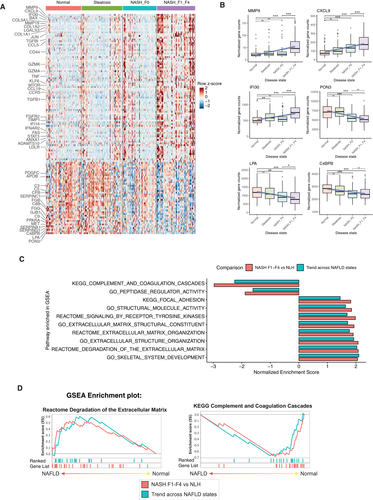
To understand the trend of gene expression across progressing NAFLD states, we performed Tukey trend analysis on the 225 genes differentially expressed in multigroup comparison. We detected 125 genes to be trending, 41 of which had downward trend and 84 had upward trend with increasing disease state (Fig. 2A and Supporting Table S6). The most upward-trending genes (lowest P values) were proteins remodeling the matrix such as metalloproteinases (e.g., matrix metalloproteinase 9 [MMP9], MMP19) (35) and interferon-induced chemokines/proteins (e.g., CXCL9, IFI30).(36) The most downward-trending genes were paraoxygenase-3 (PON3) and genes related to lipid peroxidation (e.g., lipoprotein[a] and complement related proteins, such as C4BPB).(37)
These data reveal a signature of genes that get dysregulated in a progressive manner from the earliest stages of NAFLD to more widespread dysregulation in later stages, when fibrosis is present.
Pathway and Functional Enrichment Analysis of Differentially Expressed and Trending Genes Reveal Multiple Dysregulated Molecular Pathways in NAFLD
Functional pathways corresponding to the gene changes in NAFLD were identified by GSEA using the Kyoto Encyclopedia of Genes and Genomic (KEGG) and Reactome gene sets (C2). The KEGG and Reactome gene sets are a collection of pathway maps that describe biological processes as a series of biochemical reaction. In addition, we also performed GSEA using the gene ontology (C5) gene set, which identifies characteristics of gene sets (molecular function, biological processes, and cellular components) based on previously defined categories.
Common GSEA Gene Sets Up-regulated and Down-regulated in Both NASH F1-F4 Versus NLH and Trending Genes Across NAFLD States
GSEA analysis identified multiple enriched pathways (false discovery rate <0.25) common to (1) direct comparison of NASH F1-F4 versus NLH, and (2) trending genes across NAFLD. In both of these analyses, up-regulated gene sets included those related to extracellular matrix pathways (Fig. 2C,D). The upward trending genes include two functionally distinct groups of genes related to extracellular matrix. On the one hand, we detected extracellular matrix–forming genes COL1A1, COL1A2, profibrotic genes such as transforming growth factor beta 1 (TGFB1), lumican (LUM), and thrombospondin 2 (THBS2),(38) and protease inhibitor genes such as serpin family H member 1 (SERPINH1) and tissue inhibitor of metalloproteinase 1 (TIMP1) being up-regulated. Conversely, we also observed extracellular matrix–degrading metalloproteinases (MMP9 and MMP19) (Fig. 3A) increasing with progressive NAFLD stages.
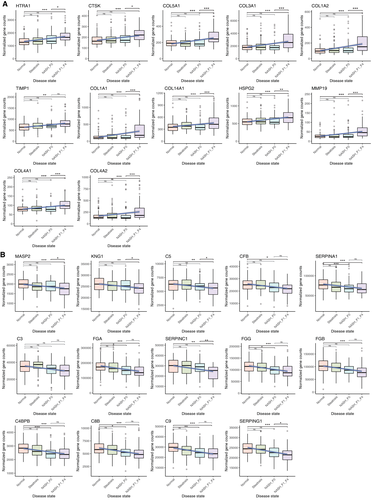
Conversely, the complement and coagulation cascade and peptidase activity pathways were down-regulated in both NASH F1-F4 versus NLH and in the trending analysis (Fig. 2C, D). Most of these genes involved in complement and coagulation cascade pathways, including C4BPB, C8B and C9, were significantly decreased already at an earlier stage of NAFLD (Fig. 3B).
Thus, we identified within our gene set two major themes of genes changing expression with increasing disease stage, with the down-regulation of the complement and coagulation system genes starting much earlier with steatosis and before the occurrence of fibrosis.
Discussion
In this study we aimed to identify characteristic patterns of intrahepatic gene-expression dysregulation in histologically healthy liver compared with different stages of fatty liver disease from NAFLD to NASH with fibrosis in adults with obesity. Importantly, we analyzed liver tissue from a large cohort of 318 adults, all with an elevated risk for NAFLD indicated by a median BMI of 45.3. This risk factor was evenly distributed throughout the cohort, as each of the four clinical outcome categories consisted of more than 75% of participants with BMIs greater than 40. Therefore, this human cohort poses a unique opportunity to identify molecular differences associated with different disease stages and even the absence of disease in the context of obesity, a major risk factor for NAFLD. This is distinct from animal models in which high caloric intake leads to predictable development of liver disease, and thus allows additional insights into human disease heterogeneity.
Using NanoString, we analyzed 795 genes with established or presumed relevance for liver disease and fibrosis in general and NAFLD in particular. Although NanoString offers a targeted transcriptomic analysis with minimal background signal, it imposes limits to the analysis, as we cannot make conclusions about pathways not represented in this gene set. Within the analyzed genes, we identified two major functional networks with extensive dysregulation: complement pathways and tissue remodeling and cell-matrix interactions (As summarized in Fig. 4 and Table 3). The down-regulation of complement-related genes was already observed in samples with early NASH (NASH F0), indicating that the transition from a purely metabolic to an inflammatory state affects specific areas of liver protein synthesis. The liver produces most of the complement proteins,(39) and more limited studies of select complements on the protein level have identified up-regulation and activation of some, most notably C3.(40-42) Our data suggest a more complex picture with both up-regulation and down-regulation, indicating a shift of the complement landscape that coincides with the addition of inflammation to a steatotic liver.
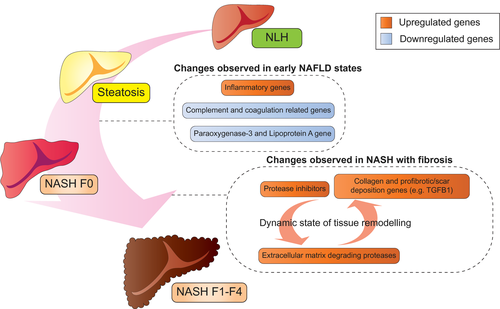
| Genes | Biological Significance and Change Observed in NAFLD |
|---|---|
| C9, C8B, C4BPB, FGG, FGA, and SERPINA1 | Complement and coagulation-related genes: early NAFLD changes; downward-trending gene expression across NAFLD stages and significantly reduced in gene expression in NASH F0 (early stage) |
| SERPING1, FGB, SERPINC1, C3, CFB, C5, KNG1, and MASP2 | Complement and coagulation related genes: significantly trending downward across NAFLD stages |
| PON3 and LPA | Paraoxygenase family protein associated with HDL and believed to slow progression of atherosclerosis; lipoprotein A, a serine peptidase: downward trending gene expression and significantly reduced in NASH F0 |
| COL1A1, COL1A2, COL4A1, COL4A2, COL3A1, COL5A1, COL6A3, COL14A1, TGFB1, LUM, and THBS2 | Collagen genes: profibrotic/scar deposition; increased in NASH with fibrosis |
| SERPINH1 and TIMP1 | Inhibit protease: stopping degradation-related enzymes; increased in NASH with fibrosis |
| MMP9, MMP19, HTRA1, and CTSK | Extracellular matrix degradation-related genes: increased in NASH with fibrosis |
| CXCL9, CXCL8, and IFI30 | Inflammation related genes: increased in progressive manner between NAFLD disease states |
- Abbreviations: C3/5/8B/9/FB, complement C3/5/8 beta chain/9/factor B; C4BPB, complement component 4 binding protein beta; COL, Collagen; CTSK, cathepsin K; CXCL8/9, C-X-C Motif Chemokine Ligand 8/9; FGB/G, fibrinogen beta/gamma chain; HTRA1, HtrA serine peptidase 1; KNG1, kininogen 1; LPA, lipoprotein(a); LUM, lumican; MASP2, MBL associated serine protease 2; MMP, Metalloproteinase; SERPINA1/C1/G1/H1, serpin family A/C/G/H member 1; THBS2, thrombospondin 2; TIMP1, tissue inhibitor of metalloproteinase 1.
Only with overt fibrosis did we observe up-regulation of genes associated with extracellular matrix organization. Fibrosis is a dynamic process involving extracellular matrix formation and degradation.(43) Matching this, we found matrix-degrading metalloproteinases and other proteases to be increased in NASH with fibrosis, whereas at the same time genes inhibiting proteases were also increased, reflecting a dynamic process in fibrotic NASH. Additional overexpression of genes promoting fibrosis and scar deposition, including collagen genes, most likely adds in tipping the balance toward progressive liver disease. Furthermore, we also observed CXC chemokine family genes, such as CXCL8 and CXCL9,(44, 45) being up-regulated progressively, suggesting increased recruitment of immune cells such as neutrophils and macrophages, which can also play a role in remodeling of the extracellular matrix. Together, the data indicate that typical molecular changes for fibrosis are only observed once histological changes are visible and that additional remodeling of the intrahepatic immune milieu might further contribute to disease progression.
We also found some more surprising individual genes with varied expression patterns. Most interestingly, we noted a stepwise decrease in PON3 expression with later NAFLD states. Paraoxonase has anti-inflammatory and anti-oxidant properties(46, 47); however, little information exists for its role in NAFLD. The PON family is associated with high-density lipoprotein (HDL) and can inhibit the formation of oxidized low-density lipoprotein (LDL), a form of LDL strongly associated with arteriosclerosis and cardiovascular disease (CVD).(48) While progression of NAFLD is known to be a risk factor for CVD, the mechanisms driving this relationship are not fully elucidated. Whether the hepatic down-regulation of PON3 seen here actually contributes to increased CVD risk or is an independent observation warrants further investigation.(49)
Although our approach allowed robust gene-expression quantitation, there are some limitations that need to be considered when interpreting our data. Because we included formalin-fixed paraffin-embedded samples, the NanoString assay was at the time the only suitable transcriptomic assay.(27) However, NanoString can only quantify a limited number of genes, compared with an unbiased whole genome approach. This most likely explains the limited differences we observed in the earlier stages of NAFLD, as in retrospect we might have biased our gene set toward NASH and fibrosis-related genes. The limited number of genes also reduces the power of pathway enrichment analyses; thus, we focused on the directionality (and not just the presence) of GSEA pathway enrichment for different disease states with respect to NLH to deduce our inference. Although these are relevant limitations, the expression changes that we were able to identify are uniquely robust due to the size of our cohort and the more limited measurements compared with an unbiased whole-genome approach.
In summary, we report gene-expression profiles of liver tissue from a uniquely large cohort of morbidly obese patients spanning the whole range of liver disease, from healthy to fibrosis, despite a highly elevated risk for NAFLD. The results robustly define transcriptional differences associated with distinct stages of NALFD, some of which warrant further investigation. Future studies in similarly large human cohorts with more recently available high throughput assays with greater breadth and resolution (i.e., single-cell whole-genome transcriptomics) will certainly allow additional insights into the molecular trajectory of NAFLD disease progression for each of the different cell populations in the liver. A combination of well-designed human studies with further adapted animal models will be key to fully understand NAFLD pathogenesis and to identify durable molecular drivers of disease progression.


