Loss of Hepatic Carcinoembryonic Antigen-Related Cell Adhesion Molecule 1 Links Nonalcoholic Steatohepatitis to Atherosclerosis
Supported by the National Institutes of Health (grants R01-HL112248, R01-DK054254, R01-DK083850 to S.M.N.; R15-HL145573 to W.L.; WV-INBRE grant P20-GM103434 to G.R.; R56-HL125619 to G.V.) and the Middle-East Diabetes Research Center (to H.E.G.).
Potential conflict of interest: Nothing to report.
Abstract
Patients with nonalcoholic fatty liver disease/steatohepatitis (NAFLD/NASH) commonly develop atherosclerosis through a mechanism that is not well delineated. These diseases are associated with steatosis, inflammation, oxidative stress, and fibrosis. The role of insulin resistance in their pathogenesis remains controversial. Albumin (Alb)Cre+Cc1flox(fl)/fl mice with the liver-specific null deletion of the carcinoembryonic antigen-related cell adhesion molecule 1 (Ceacam1; alias Cc1) gene display hyperinsulinemia resulting from impaired insulin clearance followed by hepatic insulin resistance, elevated de novo lipogenesis, and ultimately visceral obesity and systemic insulin resistance. We therefore tested whether this mutation causes NAFLD/NASH and atherosclerosis. To this end, mice were propagated on a low-density lipoprotein receptor (Ldlr)−/− background and at 4 months of age were fed a high-cholesterol diet for 2 months. We then assessed the biochemical and histopathologic changes in liver and aortae. Ldlr−/−AlbCre+Cc1fl/fl mice developed chronic hyperinsulinemia with proatherogenic hypercholesterolemia, a robust proinflammatory state associated with visceral obesity, elevated oxidative stress (reduced NO production), and an increase in plasma and tissue endothelin-1 levels. In parallel, they developed NASH (steatohepatitis, apoptosis, and fibrosis) and atherosclerotic plaque lesions. Mechanistically, hyperinsulinemia caused down-regulation of the insulin receptor followed by inactivation of the insulin receptor substrate 1–protein kinase B–endothelial NO synthase pathway in aortae, lowering the NO level. This also limited CEACAM1 phosphorylation and its sequestration of Shc-transforming protein (Shc), activating the Shc–mitogen-activated protein kinase–nuclear factor kappa B pathway and stimulating endothelin-1 production. Thus, in the presence of proatherogenic dyslipidemia, hyperinsulinemia and hepatic insulin resistance driven by liver-specific deletion of Ceacam1 caused metabolic and vascular alterations reminiscent of NASH and atherosclerosis. Conclusion: Altered CEACAM1-dependent hepatic insulin clearance pathways constitute a molecular link between NASH and atherosclerosis.
Abbreviations
-
- α-SMA
-
- alpha smooth muscle actin
-
- Alb
-
- albumin
-
- ANOVA
-
- analysis of variance
-
- ApoB
-
- apolipoprotein B
-
- B6
-
- C57BL/6J background
-
- BW
-
- body weight
-
- CD
-
- cluster of differentiation
-
- cDNA
-
- complementary DNA
-
- CEACAM1/Cc1
-
- carcinoembryonic antigen-related cell adhesion molecule 1
-
- CoA
-
- coenzyme A
-
- eNOS
-
- endothelial nitric oxide synthase
-
- ET-1
-
- endothelin-1
-
- Etar
-
- endothelin-1 receptor A
-
- Etbr
-
- endothelin-1 receptor B
-
- F
-
- fasted
-
- FASN
-
- fatty acid synthase
-
- fl
-
- flox
-
- H&E
-
- hematoxylin and eosin
-
- HC
-
- high cholesterol
-
- HDL
-
- high-density lipoprotein
-
- HDL-C
-
- high-density lipoprotein cholesterol
-
- HMG
-
- β-hydroxy β-methylglutaryl
-
- HMG-CoA
-
- β-hydroxy β-methylglutaryl coenzyme A
-
- Ib
-
- immunoblotting
-
- ICAM-1
-
- intercellular adhesion molecule 1
-
- IFN
-
- interferon
-
- IL
-
- interleukin
-
- Ip
-
- immunoprecipitation
-
- IR
-
- insulin receptor
-
- IRF-8
-
- interferon regulatory factor 8
-
- IRS
-
- insulin receptor substrate
-
- LDL
-
- low-density lipoprotein
-
- LDL-C
-
- low-density lipoprotein cholesterol
-
- LDLR
-
- low-density lipoprotein receptor
-
- MAPK
-
- mitogen-activated protein kinase
-
- MCP
-
- monocyte chemoattractant protein
-
- MOMA-2
-
- monocyte and macrophage-2
-
- mRNA
-
- messenger RNA
-
- NAD
-
- nicotinamide adenine dinucleotide
-
- NADPH
-
- nicotinamide adenine dinucleotide phosphate, reduced form
-
- NAFLD
-
- nonalcoholic fatty liver disease
-
- NASH
-
- nonalcoholic steatohepatitis
-
- NEFA
-
- nonesterified fatty acid
-
- NF-κB
-
- nuclear factor kappa B
-
- NOX1
-
- nicotinamide adenine dinucleotide phosphate, reduced form oxidase 1
-
- NPC1
-
- Niemann-Pick type C1 protein
-
- ORO
-
- Oil-Red-O
-
- Ox-LDL
-
- oxidized low-density lipoprotein
-
- p
-
- phosphorylated
-
- PBS
-
- phosphate-buffered saline
-
- PCR
-
- polymerase chain reaction
-
- qRT-PCR
-
- quantitative reverse-transcription polymerase chain reaction
-
- RF
-
- refed
-
- RPMI
-
- Roswell Park Memorial Institute
-
- Smad
-
- mothers against decapentaplegic homolog
-
- SREBP
-
- sterol regulatory element binding protein
-
- STAT
-
- signal transducer and activator of transcription
-
- TGF
-
- transforming growth factor
-
- Th
-
- T helper
-
- TNF
-
- tumor necrosis factor
-
- VLDL
-
- very low-density lipoprotein
-
- VLDL-C
-
- very low-density lipoprotein cholesterol
-
- WAT
-
- white adipose tissue
Nonalcoholic fatty liver disease (NAFLD) is a heterogeneous disease ranging from simple steatosis to different stages of nonalcoholic steatohepatitis (NASH) that include chicken-wire bridging fibrosis. With NAFLD/NASH growing at an epidemic rate, its progression to cirrhosis and liver adenocarcinoma has become a global concern.(1) To date, there has been no U.S. Food and Drug Administration-approved drug targeting NASH owing to our limited knowledge of the pathogenesis of the initiation and progression of the disease. This is in part due to the paucity of animal models that replicate faithfully the human condition. Despite controversy,(2) insulin resistance constitutes a risk factor for the early stages of NAFLD/NASH (steatosis).(3) Thus, treatment has commonly implicated a combinational therapy aimed at ameliorating insulin sensitivity to stop disease progression.(4)
In addition to liver dysfunction, patients with NAFLD/NASH are at a higher risk of developing cardiovascular diseases, including atherosclerosis.(4-7) This has stimulated interest in identifying shared molecular mechanisms underlying cardiometabolic diseases. Several common risk factors have been identified, including visceral obesity, insulin resistance, dyslipidemia, oxidative stress, and inflammation.(3, 8-11) Of these, the role of insulin resistance in linking NAFLD/NASH to atherosclerosis remains debatable. This is in part because of the heterogeneity of insulin resistance implicating altered metabolism and differential regulation of insulin signaling in a cell- and tissue-dependent manner.(12) Additionally, the cause–effect relationship between these anomalies has not been mechanistically fully resolved.(13, 14)
While hyperinsulinemia compensates for insulin resistance, some studies propose that hyperinsulinemia driven by impaired hepatic insulin clearance causes insulin resistance.(15, 16) The latter has been mechanistically demonstrated in mice with altered expression/function of carcinoembryonic antigen-related cell adhesion molecule 1 (CEACAM1; alias Cc1).(16) Consistent with its permissive effect on insulin clearance, mice with liver-specific deletion of the Ceacam1 gene (albumin [Alb]Cre+Cc1flox[fl]/fl) on C57BL/6J (B6) background exhibited impaired insulin clearance leading to chronic hyperinsulinemia at 2 months of age.(17) This was followed by hepatic insulin resistance and steatohepatitis at 6-7 months of age as well as hypothalamic insulin resistance, which caused hyperphagia contributing to systemic insulin resistance with concomitant release of nonesterified fatty acids (NEFAs) and adipokines from white adipose tissue (WAT).(17) Similarly, global null mutation of Ceacam1 (Cc1−/−) impaired insulin clearance and caused hyperinsulinemia followed by systemic insulin resistance, steatohepatitis, and visceral obesity, which were all reversed with liver-specific rescuing of Ceacam1.(18) In parallel, Cc1−/− developed hypertension with endothelial and cardiac dysfunction in relation to increased oxidative stress, which were all reversed by liver-specific rescuing of Ceacam1.(19) Mechanistically, this was mediated by hyperinsulinemia-driven down-regulation of cellular insulin receptors and subsequent reduction in plasma NO, with a reciprocal increase in endothelin-1 (ET-1) production(19) favoring vasoconstriction over vasodilation.(20)
In addition to an altered cardiometabolic system, global Cc1−/− mice also uniquely develop fatty streaks and plaque-like lesions in aortae despite the absence of proatherogenic hypercholesterolemia and hypertriglyceridemia.(21) These loss- and gain-of-function models highlight the important role that impaired CEACAM1-dependent insulin clearance pathways play in hyperinsulinemia-driven insulin resistance, NAFLD, and cardiovascular anomalies.
Given that Cc1−/− mice develop more progressive NASH features when fed a high-fat diet, including fibrosis and apoptosis,(22, 23) we investigated whether liver-specific AlbCre+Cc1fl/fl nulls develop NASH and atherosclerosis when propagated on a B6.low-density lipoprotein receptor (Ldlr)−/− background, with an overarching goal to investigate the role of hepatic insulin resistance in the mechanistic link between NAFLD/NASH and atherosclerosis.
Materials and Methods
Generation of Liver-Specific AlbCre+Cc1fl/fl Null Mice Propagated on an Ldlr−/− Background
C57BL/6J.AlbCre+Cc1fl/fl mice were generated, as described,(17) and backcrossed >6 times with Ldlr−/−;B6.129S7-Ldlrtm1Her/J (JAX#002207; Jackson Laboratory, Bar Harbor, ME). Offspring were genotyped by polymerase chain reaction (PCR) analysis of ear DNA, using Ceacam1-specific primers (Supporting Fig. S1). We used homozygotes with the wild-type Ceacam1 allele with AlbCre (Ldlr−/−AlbCre+Cc1+/+ or Alb+Cc1+/+) or without AlbCre (Ldlr−/−AlbCre–Cc1+/+ or Alb–Cc1+/+) and homozygotes with the Ceacam1-floxed allele with AlbCre (Ldlr−/−AlbCre+Cc1fl/fl or Alb+Cc1fl/fl) or without AlbCre (Ldlr−/−AlbCre–Cc1fl/fl or Alb–Cc1fl/fl); all homozygotes from the same breeding were used to mitigate potential confounding effects of floxing and introducing AlbCre.
Mice Maintenance
All animals were housed in a 12-hour dark–light cycle at the Division of Laboratory Animal Resources at each institution. Starting at 4 months of age, male mice were fed a high-cholesterol (HC) atherogenic diet ad libitum (Harlan Teklad, TD.88137; Harlan, Haslett, MI) containing 0.2% total cholesterol (42% kcal from fat; 42.7% kcal from carbohydrate [high sucrose 34% by weight]) for 2 months (unless otherwise noted). All procedures were approved by the institutional animal care and use committees at each institution.
Metabolic Phenotyping
Body composition was assessed by nuclear magnetic resonance (Bruker Minispec, Billerica, MA), as described.(19) For insulin or glucose tolerance, awake mice were fasted for 6 hours and injected intraperitoneally with either insulin (0.75 units/kg body weight [BW] human regular insulin [Novo Nordisk, Princeton, NJ] or 1.5 g/kg BW dextrose solution). Blood glucose was measured from the tail at 0-180 minutes. Retro-orbital venous blood was drawn at 1100 hours from overnight-fasted mice into heparinized microhematocrit capillary tubes (Fisherbrand, Waltham, MA). Plasma and tissue biochemistry parameters were assessed as detailed in the Supporting Information.
Enzymatic Activity Assays in Liver
Liver homogenates were centrifuged and fatty acid synthase (FASN) activity was assayed in a reaction mix containing 0.1 μCi [14C]malonyl-coenzyme A (CoA; Perkin-Elmer) and 25 nmol malonyl-CoA in the absence or presence of 500 μM nicotinamide adenine dinucleotide phosphate, reduced form (NADPH; Sigma-Aldrich, MO), as originally described.(24) Activity was calculated as counts per minute of [14C]-incorporated Bq/μg cell lysates. β-Hydroxy β-methylglutaryl (HMG)-CoA reductase activity was carried out following the manufacturer’s instructions (HMG-CoA Reductase Activity Colorimetric Assay Kit, ab204701; Abcam, Cambridge, MA).
Ex-Vivo Palmitate Oxidation
This assay was carried out in the presence of [1-14C]palmitate (0.5 mCi/mL; American Radiolabeled Chemicals Inc., St Louis, MO)-2 mM adenosine triphosphate, terminated with perchloric acid to recover trapped CO2 radioactivity. The partial oxidation products were then measured by liquid scintillation using CytoCint (MP Biomedicals, Solon, OH). The oxidation rate was expressed as the sum of total and partial fatty acid oxidation (nmoles/g/minute).(18)
Liver Histology
Formalin-fixed paraffin-embedded sections were stained with hematoxylin and eosin (H&E). Sections were deparaffinized and rehydrated before being stained with 0.1% sirius red stain (Direct Red80; Sigma-Aldrich), as described.(23)
En-Face and Lesion Analysis
Aortae were dissected from the root to the abdominal area and then formalin fixed. Connective tissues were removed from the longitudinally opened aortae, stained with Oil-Red-O (ORO) (#O0625; Sigma-Aldrich), fixed on a coverslip, and photographed with an Olympus CKX41 (Tokyo, Japan). The total surface and ORO-positive areas were determined using CellSens Standard software in area of pixel2. The extent of atherosclerotic lesions was defined as the percentage of total ORO-positive lesion area/total surface area.
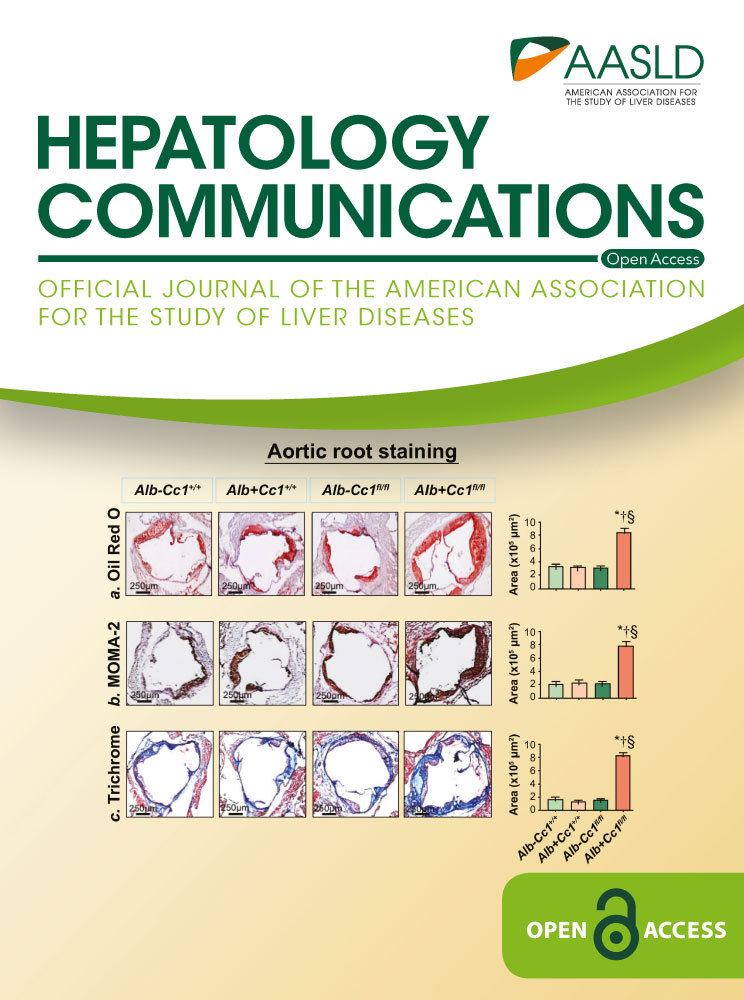
Aortic Root Sectioning and Plaque Analysis
Hearts were perfused through the left ventricle with 1X phosphate-buffered saline (PBS; Thermo Scientific, Waltham, MA), followed by 4% paraformaldehyde (Sigma-Aldrich) and cut and embedded in optimal cutting temperature (OCT) compound (Tissue-Tek 4583). This was followed by frozen sectioning on a microtome-cryostat (10 µm) starting from where the aorta exits the ventricle and moving toward the aortic sinus. Sections were stained with ORO or trichrome (Gomori's Trichrome Stain Kit, 87020; Thermo Scientific) or immunostained with monocyte and macrophage 2 (MOMA-2) antibody (1:500; Abcam, Cambridge, United Kindom) overnight at 4°C before incubating with secondary antibody for 1 hour (immunohistochemistry-labeled streptavidin biotin kit; Dako). Images were taken at 4× using an Olympus SZX7-TR30 microscope and quantified with the CellSens Standard program.
Intravital Microscopy of Leukocyte Adhesion on the Carotid Artery
Mice were anesthetized with ketamine and xylazine (100/10 mg/kg) and fixed on a 15-cm cell-culture lid in a supine position. The right jugular vein and left carotid artery were exposed through a middle incision, as described.(25) We injected 100 µL of 0.5 mg/mL rhodamine 6G (R4127; Sigma-Aldrich) through a jugular vein puncture to label cells having mitochondria, including leukocytes. The carotid artery was carefully isolated from the surrounding tissue, and one piece of small, U-shaped, black plastic was placed under the vessel to block background fluorescence. The carotid artery (~4-5 mm length) was observed in real time using an intravital microscope (Leica DM6 FS), and video images were captured with a 14-bit RetigaR1 charge-coupled device color digital camera (Teledyne QImaging, Surrey, Canada) and STP7-S-STDT Streampix7 software (Norpix, Montreal, Canada). Video images were analyzed offline for leukocyte adhesion. Cells that adhered to the vessel wall without rolling or moving for at least 3 seconds were counted over the vessel observed. Total numbers were used for statistical analysis.
Isolation of Peritoneal Macrophages
Mice were injected intraperitoneally with 1 mL thioglycollate (T9032; Sigma-Aldrich). Four days later, 6-8 mL of cold 1X PBS was injected into the peritoneal cavity; the peritoneal liquid was aspirated into conical centrifuge tubes and centrifuged to collect and culture the pellet in Roswell Park Memorial Institute (RPMI) medium (Thermo Scientific). Cells were treated overnight with 100 µg/mL of native low-density lipoprotein (LDL) (human plasma, 99% #J65039; Alfa Aesar, United Kingdom) or oxidized LDL (ox-LDL) (human plasma, Hi-TBAR #J65261; Alfa Aesar), fixed with 10% formalin for 10 minutes, and rinsed in PBS once (1 minute) and then with 60% isopropanol for 15 seconds. Cells were stained with filtered ORO (#O0625; Sigma-Aldrich) at 37°C for 1 minute in the dark, washed with 60% isopropanol for 15 seconds, then rinsed with PBS 3 times for 3 minutes each. Images were taken at 20× magnification.
Bone Marrow Isolation From Tibia and Femur
Mice were euthanized and their entire leg dissected. Skin was peeled off, and the tibia and femur were separated and placed in RPMI. The ends of both tibias and femurs were cut to flush out the bone marrow by using a syringe. Cells were collected after centrifugation and cultured in RPMI supplemented with 10-20 ng/mL recombinant macrophage colony-stimulating factor (Thermo Scientific).
Total RNA was isolated from cells using NucleoSpin RNA (740955.50; Macherey-Nagel, Bethlehem, PA). Complementary DNA (cDNA) was synthesized with the iScript cDNA Synthesis Kit (Bio-Rad), using 1 μg of total RNA and oligo deoxythymine primers. cDNA for total and Ceacam1-long (L) and short (S) isoforms were evaluated by quantitative reverse-transcription (qRT)-PCR (StepOne Plus; Applied Biosystems, Foster City, CA) and normalized against 18S, using primers listed in Supporting Table S1.
Western and qRT-PCR Analyses
Western blots and qRT-PCR analyses were carried out as routinely done and as detailed in the Supporting Information.
Statistical Analysis
Data were analyzed using one-way analysis of variance (ANOVA) with Tukey’s test for multiple comparisons, using GraphPad Prism6 software. Data were presented as mean ± SEM. P < 0.05 was considered statistically significant.
Results
Ldlr−/−AlbCre+Cc1fl/fl Mice Manifested Insulin Resistance
Starting at 5 weeks of HC intake (Table 1; Supporting Fig. S3), Ldlr−/−AlbCre+Cc1fl/fl mice manifested a higher body weight gain and exhibited an increase in fat and visceral mass with a reciprocal decrease in lean mass relative to the three control groups after 2 months of HC (Table 1). They maintained fasting hyperinsulinemia relative to their littermate controls (Table 1), with impaired insulin clearance, which was measured by steady-state C-peptide/insulin molar ratio (Table 1). Null mice exhibited higher postprandial blood glucose levels (Table 1) and intolerance to exogenous insulin and glucose relative to controls (Fig. 1A,B). Consistent with hyperinsulinemia repressing insulin receptor (IR) expression,(26) immunoblotting with α-IRβ and normalizing against α-tubulin showed a ~50% reduction in IR level in liver and WAT of mutants (Fig. 1Cb,c). Insulin release (Fig. 1Ca) in control but not null mice refed (RF) for 7 hours following an overnight fast induced IRβ phosphorylation relative to fasted (F) mice (Fig. 1Cb,c). Together, this demonstrated systemic insulin resistance with elevated fasting hyperglycemia in Ldlr−/−AlbCre+Cc1fl/fl mice (Table 1).
| Alb−Cc1+/+ | Alb+Cc1+/+ | Alb−Cc1fl/fl | Alb+Cc1fl/fl | |
|---|---|---|---|---|
| Body weight (g) | 33.1 ± 2.6 | 39.5 ± 1.6 | 38.8 ± 3.9 | 56.7 ± 2.2*-‡ |
| % Fat mass (NMR) | 4.7 ± 1.1 | 4.9 ± 0.7 | 4.8 ± 1.0 | 7.9 ± 1.3*-‡ |
| % Lean mass (NMR) | 64.1 ± 1.4 | 63.1 ± 0.8 | 62.1 ± 1.2 | 44.1 ± 0.8*-‡ |
| % Visceral fat (WAT/BW) | 2.1 ± 0.5 | 2.2 ± 0.4 | 2.2 ± 0.4 | 4.9 ± 0.3*-‡ |
| Fasting blood glucose (mg/dL) | 101 ± 8 | 105 ± 6 | 103 ± 7 | 135 ± 7*-‡ |
| Fed blood glucose (mg/dL) | 152 ± 5 | 154 ± 8 | 151 ± 8 | 185 ± 6*-‡ |
| Plasma insulin (pM) | 55.5 ± 3.7 | 54.4 ± 1.2 | 52.1 ± 2.5 | 92.1 ± 1.3*-‡ |
| Plasma C-peptide (pM) | 270.0 ± 3.0 | 282.0 ± 6.0 | 268.0 ± 6.3 | 352.0 ± 3.1*-‡ |
| Plasma C/I molar ratio | 5.1 ± 0.4 | 5.2 ± 0.1 | 5.2 ± 0.2 | 3.8 ± 0.1*-‡ |
| Hepatic triacylglycerol (μg/mg protein) | 79 ± 5 | 84 ± 6 | 81 ± 5 | 122 ± 4*-‡ |
| Hepatic total cholesterol (μg/mg protein) | 322 ± 11 | 318 ± 14 | 341 ± 13 | 672 ± 15†, ‡ |
| Hepatic free cholesterol (μg/mg protein) | 52 ± 3 | 49 ± 4 | 45 ± 4 | 97 ± 5*-‡ |
| Plasma NEFA (mEq/L × 10−2) | 50 ± 1 | 52 ± 4 | 52 ± 2 | 120 ± 8*-‡ |
| Plasma triacylglycerol (mg/dL) | 49 ± 2 | 48 ± 2 | 46 ± 2 | 81 ± 3*-‡ |
| Plasma total cholesterol (mg/dL) | 306 ± 11 | 407 ± 10 | 403 ± 15 | 709 ± 13*-‡ |
| Plasma free cholesterol (mg/dL) | 70 ± 1 | 80 ± 1 | 80 ± 1 | 150 ± 1*-‡ |
| Plasma VLDL-C (mg/dL) | 104 ± 31 | 95 ± 11 | 101 ± 12 | 177 ± 14*-‡ |
| Plasma LDL-C (mg/dL) | 157 ± 9 | 147± 14 | 175 ± 12 | 238 ± 2*-‡ |
| Plasma HDL-C (mg/dL) | 131 ± 10 | 134 ± 11 | 137 ± 13 | 70 ± 12*-‡ |
| Plasma ApoB (pg/mL) | 90 ± 6 | 90 ± 5 | 78 ± 3 | 142 ± 7*-‡ |
| Plasma PCSK9 (pg/mL) | 263 ± 107 | 256 ± 122 | 263 ± 63 | 341 ± 26*-‡ |
| Plasma ALT activity(mU/mg) | 12 ± 3 | 13 ± 2 | 12 ± 1 | 21 ± 4*-‡ |
| Plasma AST activity(mU/mg) | 63 ± 7 | 66 ± 5 | 59 ± 4 | 127 ± 8*-‡ |
- Male mice (4 months of age, n > 7/genotype) were fed an HC diet for 2 months before being killed. Except for fed blood glucose level that was assessed in blood drawn at 10 pm, mice were fasted overnight from 5 pm until 11 am the next day when retro-orbital blood was drawn and tissues were collected. Visceral adiposity was calculated as % of gonadal plus inguinal WAT per body mass; insulin clearance as steady-state plasma C/I molar ratio; and plasma VLDL-C was calculated as triacylglycerol × 0.2. Data were analyzed by one-way ANOVA with Tukey’s test for multiple comparisons, and values are expressed as mean ± SEM.
- * P < 0.05 vs. Alb–Cc1+/+.
- † P < 0.05 vs. Alb+Cc1+/+.
- ‡ P < 0.05 vs. Alb–Cc1fl/fl.
- Abbreviations: ALT, alanine aminotransferase; AST, aspartate aminotransferase; C/I, C-peptide/insulin; NMR, nuclear magnetic resonance; PCSK9, proprotein convertase subtilisin/kexin type 9.

Ldlr−/−AlbCre+Cc1fl/fl Mice Exhibited Altered Hepatic Lipid Metabolism With Hypertriglyceridemia and Hypercholesterolemia
Histologic evaluation of H&E-stained liver sections revealed diffused macrovesicular fat infiltration in Ldlr−/−AlbCre+Cc1fl/flmice compared to controls, which displayed predominantly microsteatosis (Fig. 2A), in agreement with their higher hepatic triacylglycerol content (Table 1). This likely resulted from increased lipid transport into hepatocytes (higher messenger RNA [mRNA] levels of cluster of differentiation [Cd]36, fatty acid transport protein 1 [Fatp1], and Fatp4 [Supporting Table S2]) and from de novo lipogenesis (higher mRNA [Fig. 3Aa; Supporting Table S2] and protein [Fig. 3Ab] levels of FASN stemming from hyperinsulinemia-driven transcriptional activation of sterol regulatory element binding protein 1c [Srebp1c] activity in null livers [Supporting Table S2]). Moreover, insulin release in RF (Fig. 1Ca) caused CEACAM1 phosphorylation (pCC1) and association with FASN in control but not in null livers, as shown by immunodetection of pCC1 in the FASN immunopellet (Fig. 3Ab). As shown by Najjar et al.,(24) this lowers hepatic FASN enzymatic activity in controls (Fig. 3Ac), whereas in null mice, de novo lipogenesis increased followed by redistribution of substrates to WAT to cause hypertriglyceridemia, visceral adiposity, and lipolysis (increased plasma NEFA levels) (Table 1). Compromised fatty acid β-oxidation contributed to fat accumulation in Ldlr−/−AlbCre+Cc1fl/fl livers (Fig. 3B).


Ldlr−/−AlbCre+Cc1fl/fl mice exhibited higher levels of hepatic and plasma total and free cholesterol. Plasma LDL cholesterol (LDL-C) and very low-density lipoprotein cholesterol (VLDL-C) were increased with a reciprocal decrease in high-density lipoprotein cholesterol (HDL-C) content in null mice (Table 1). This is consistent with increased hepatic cholesterol production in liver-specific inactivation of CEACAM1 (L-SACC1) mice with liver-specific CEACAM1 inactivation.(27) Accordingly, hepatic Srebp2 mRNA levels (Supporting Table S2), a master regulator of genes involved in cholesterol synthesis, including HMG-CoA reductase (Hmgcr) (Supporting Table S2), were elevated in parallel to its increased enzymatic activity (Fig. 3C) and an increase in plasma apolipoprotein B (ApoB) levels in mutants (Table 1). The increase in hepatic Srebp1c and Srebp2 mRNA was not associated with changes in hepatic insulin-induced gene 1 (Insig-1) and Insig-2a/b mRNA levels (Supporting Table S2). Whether the regulatory effect of these endoplasmic reticulum membrane proteins on cholesterol synthesis(28) were altered by liver-specific Ceacam1 deletion remains to be examined. Nevertheless, it is possible that, like Srebp1c, increased transcriptional activity of Srebp2 in Ldlr−/−AlbCre+Cc1fl/fl mice was driven by chronic hyperinsulinemia.(29)
Elevated LDL-C and non-HDL-C in Ldlr−/−AlbCre+Cc1fl/fl mice could also be caused by reduced clearance, as supported by elevated plasma levels of ApoB and proprotein convertase subtilisin/kexin type 9 (PCSK9) (Table 1). Also supporting this finding is reduced expression of LDL receptor-related protein 1 (Supporting Table S2), which is involved in hepatocytic clearance of chylomicron remnants. Whether CEACAM1 modulates LDL clearance is unclear, but mRNA levels of hepatic Niemann-Pick type C1 protein (Npc1), a late endosomal protein involved in exporting LDL-C to other cellular compartments, was reduced by ~3-fold in nulls (Supporting Table S2). This suggests partitioning of free cholesterol to mitochondria where it could contribute to the ~3-fold to 4-fold reduction in plasma glutathione (GSH) in nulls (Fig. 4Aa).(30) Together, this demonstrates that Ldlr−/−AlbCre+Cc1fl/fl mice developed the dyslipidemia profile of NAFLD and atherosclerosis.(8, 31)

Ldlr−/−AlbCre+Cc1fl/fl Mice Exhibited Inflammation in Liver
H&E staining revealed few inflammatory islands with no change in the hepatocellular architecture of control livers (Fig. 2A). In contrast, Ldlr−/−AlbCre+Cc1fl/fl mice exhibited multiple and extended foci of mononuclear inflammatory infiltrates in hepatic lobules and periportal areas (Fig. 2A). qRT-PCR analysis (Supporting Table S2) showed activated macrophages (F4/80; Cd68) and T cells (Cd4/Cd8) without significance changes in anti-inflammatory regulatory T-cell (Treg) pools, such as forkhead box protein P3 (FoxP3) and interleukin (Il)-10 (Supporting Table S2). Elevated hepatic mRNA of interferon gamma (Ifnγ) but not Il-4/Il-13 suggests a CD4+T helper 1 (Th1) but not CD4+Th2 response in mutant livers.
Consistent with nuclear factor kappa B (NF-κB) activation (phosphorylation) in nulls (Fig. 2C), hepatic mRNA of its targets tumor necrosis factor alpha (Tnfα) and Il-6 (Supporting Table S2) and their plasma levels (Figs. 4Ab,c) were elevated in nulls.
Hepatic mRNA (Supporting Table S2) and plasma levels (Fig. 4Ac) of IL-6 were higher in nulls. This could activate (phosphorylate) signal transducer and activator of transcription (STAT3) (Fig. 2C) to induce monocyte chemoattractant protein 1 (Mcp-1)/chemokine (C-C motif) ligand 2 (Ccl2) in monocytes/macrophages and their migration (Supporting Table S2) in addition to repressing IFN regulatory factor 8 (Irf-8) (Supporting Table S2), which could in turn induce Cd11b macrophage expression (Supporting Table S2).
WAT of null mice exhibited more macrophage recruitment, as demonstrated by higher mRNA levels of F4/80, Cd68, Tnfα, Il-1β, and Il-6 (Supporting Table S3). This could significantly contribute to elevated plasma IL-6 and TNFα levels and to systemic proinflammatory and insulin resistance in Ldlr−/−AlbCre+Cc1fl/fl mice.(32)
Ldlr−/−AlbCre+Cc1fl/fl Mice Exhibited Oxidative Stress and Apoptosis in Liver
Hepatic mRNA levels of oxidative stress markers (NADPH oxidase 1 [Nox1], Nox4, glycosylated 91-kDa glycoprotein [Gp91]) were elevated by ~2-fold to 3-fold in nulls (Supporting Table S2). Consistently, plasma NO level was lower (Fig. 4Ad) and NAD/NADH was higher (Fig. 4Ae) in nulls. Together with increased plasma 8-isoprostane (Fig. 4Af), this demonstrated oxidative stress and lipid peroxidation in nulls.
Consistent with oxidative stress causing apoptosis in the presence of high TNFα levels,(10) CCAAT/enhancer binding protein homologous protein (CHOP) levels were elevated in null livers (Fig. 2C). This was supported by a ~2-fold increase in mRNA levels of markers of hepatocyte injury (Supporting Table S2), without noticeable ballooning (Fig. 2A). Consistently, Ldlr−/−AlbCre+Cc1fl/fl mice developed liver dysfunction (elevated plasma alanine aminotransferase [ALT] and aspartate aminotransferase [AST] activities) (Table 1).
Ldlr−/−AlbCre+Cc1fl/fl Mice Exhibited Hepatic Fibrosis
Sirius red staining (Fig. 2B) revealed a perivenular and/or pericellular bridging “chicken-wire” pattern of collagen deposition in mutant livers, despite elevated levels of the proinflammatory antifibrotic IFNγ cytokine. This was supported by higher protein levels of alpha smooth muscle actin (α-SMA) (Fig. 2C) and mRNA levels of profibrogenic genes (α-Sma, collagen type VI alpha 3 chain [Col6α3], and transforming growth factor beta [Tgfβ]) together with activation of the TGFβ-mothers against decapentaplegic homolog 3 (Smad3) pathway (Fig. 2C) that could result from TNFα suppression of Smad7, an inhibitor of TGFβ activation, in null livers (Supporting Table S2).
Fibrosis could stem from increased plasma and hepatic levels of ET-1 (Fig. 4Ag) that could activate the profibrogenic ET-1 receptor A (Etar) with ~15-fold higher expression than receptor B (Etbr) (Fig. 4Ba). Elevated plasma ET-1 levels likely resulted from lower plasma prostaglandin E2 (PGE2)(33) (Fig. 4Ah) and hyperinsulinemia.(20)
Development of Atherogenic Lesions in Ldlr−/−Cre+Cc1fl/fl Aortae
En-face analysis revealed a 2-fold to 3-fold increase in the plaque area of mutants fed HC for 2 months (Fig. 5A) but not 1 month (not shown). ORO staining of aortic root cross-sections showed lipid deposition in mutant intima (Fig. 5Ba and graph). Consistently, mRNA levels of genes involved in fat (Cd36, Srepb-1c, Fasn) and cholesterol (Srebp2, Hmgcr, and Npc1) transport and synthesis were higher in null aortae (Supporting Table S4).

Immunostaining of aortic root cross-sections with α-MOMA-2 showed inflammatory infiltration in Ldlr−/−AlbCre+Cc1fl/fl aortic walls (Fig. 5Bb and graph). Intravital microscopy demonstrated ~5-fold increase in the adhesiveness of circulating leukocytes to the carotid artery endothelium of mutants (Fig. 6A and graph). Accordingly, mRNA levels of vascular cell adhesion protein 1 (Vcam-1), intercellular adhesion molecule 1 (Icam-1), and P-selectin, which play an important role in attracting leukocytes to endothelium, were higher in Ldlr−/−AlbCre+Cc1fl/fl aortae (Supporting Table S4).

mRNA levels of cadherin 5, type 2 (VE-cadherin) and β-catenin, which preserve endothelial integrity and regulate leukocyte adhesion, were reduced by ~2-fold to 3-fold in Ldlr−/−AlbCre+Cc1fl/fl aortae (Supporting Table S4). Contributing to junctional permeability and transendothelial migration of immune cells in Ldlr−/−AlbCre+Cc1fl/fl aortae is the 2-fold to 3-fold decrease in mRNA levels of vascular endothelial growth factor A (Vegf-A) and its receptor (Vegfr-2), Vegfr-1, and angiopoietins (Ang-1 and Ang-2) in mutant aortae (Supporting Table S4). Intact Ceacam1 mRNA (total and L and S isoforms) in aortae (Fig. 6C) and macrophages (Fig. 6D) ruled out changes in Ceacam1 expression and its potential effect on the transendothelial migration of leukocytes in nulls.
Consistent with monocyte infiltration through permeable endothelium, the pool of activated macrophages (F4/80, Cd68, Il-1β, TNFα, toll-like receptor (Tlr)2/4) (Supporting Table S4) increased in nulls. Accordingly, NF-κB phosphorylation was elevated (Fig. 6B) to induce TNFα and IL-6 transcription in Ldlr−/−AlbCre+Cc1fl/fl (Supporting Table S4) macrophages in response to free-cholesterol accumulation,(34) as suggested by lower Npc1 mRNA levels.
Elevated IL-6 could activate (phosphorylate) STAT3 (Fig. 6B) to induce Mcp-1/Ccl2 (Supporting Table S4), which mediates transendothelial migration of monocytes/macrophages and represses Irf-8 (Supporting Table S4) to increase expression of CD11b, a receptor for ICAM-1 involved in leukocyte adhesion, in mutant aortae (Supporting Table S4).
Additionally, mRNA of markers of activated T cells (Cd4, Cd8) but not the atheroprotective Treg (FoxP3 and Il-10) were elevated in null aortae (Supporting Table S4). This induced an atherogenic CD4+Th1 response rather than the atheroprotective CD4+Th2 type, as suggested by high Ifnγ but not Il-4/Il-13 mRNA levels in mutant aortae (Supporting Table S4).
ORO staining of peritoneal macrophages treated with native or ox-LDL indicated a shared susceptibility to Ox-LDL for lipid-loaded macrophage formation by all mouse groups (Fig. 6E). This ruled out differential macrophage preactivation (priming), assigning a major role for systemic factors in the development of atherosclerosis in Ldlr−/−AlbCre+Cc1fl/fl mice.
Ldlr−/−Cre+Cc1fl/fl Aortae Exhibited Fibrosis
Trichrome staining of aortic root sections showed ~5-fold to 6-fold increase in collagen deposition in mutant mice (Fig. 5Bc and graph). This was supported by higher mRNA levels of profibrogenic genes (connective tissue growth factor [Ctgf], Col6α3, α-Sma, fibronectin, Tgfβ) (Supporting Table S4) and by the activation of the TGFβ-Smad3 pathway in mutant aortae (Fig. 6B), resulting, in part, from lower Smad7 mRNA (Supporting Table S4). Fibrosis in Ldlr−/−AlbCre+Cc1fl/fl aortae could be mediated by the higher profibrogenic activity of plasma and aortic ET-1, as supported by the ~115-fold rise in the Etar/Etbr ratio (Fig. 4Bb).
Mechanisms Underlying Altered Vascular Morphogenesis in Ldlr−/−Cre+Cc1fl/fl Mice
Consistent with lower plasma NO levels (Fig. 4Ad), aortic NO (Fig. 4C) and mRNA levels of Gp91, Nox1, and Nox4 were lower in mutants (Supporting Table S4). Because hyperinsulinemia suppresses NO and induces ET-1,(20) we examined whether insulin signaling was altered in mutant aortae. Immunoblotting with α-IRβrevealed a ~50% decrease in IR protein content in mutants (Fig. 7A), likely driven by hyperinsulinemia.(26) Immunoblotting with α-IRβ (Fig. 7A) demonstrated blunted insulin-stimulated IRβ phosphorylation in mutants (Fig. 7Ba; RF). Consistently, insulin failed to induce the phosphorylation of downstream signaling molecules (insulin receptor substrate 1 [IRS1], Akt, and endothelial nitric oxide synthase [eNOS]) in mutant aortae (Fig. 7B-D). Dysregulated insulin-dependent eNOS activation yielded compromised NO production in Ldlr−/−AlbCre+Cc1fl/fl aortae.
Restricted IRβ phosphorylation failed to phosphorylate CEACAM1 (Fig. 7E; immunoprecipitation with α-pCC1), thus diminishing Shc sequestration and its rerouting to IRβ, as shown by the higher IRβ level in the Shc immunopellet (Fig. 7E, middle gel). This was facilitated by the reciprocal decrease in IRS1 binding to IRβ (Fig. 7B) because Shc and IRS1 compete for binding to the Asn-Pro-Glu-Tyr960 sequence in IRβ.(16) Higher Shc/IRβ association amplified insulin-stimulated mitogen-activated protein kinase (MAPK) phosphorylation to a larger extent in mutant aortae (Fig. 7F), inducing ET-1 (Et-1)(20) by 4-fold to 5-fold in mutant aortae (Supporting Table S4).
Discussion
Fed a regular chow diet, mice with global Ceacam1 deletion (Cc1−/−) and liver-specific deletion (AlbCre+Cc1fl/fl) and inactivation (L-SACC1) manifested hyperinsulinemia-driven insulin resistance, early stage NASH (steatohepatitis with hepatic fibrosis), and visceral obesity.(17, 35, 36) In addition to this cluster of metabolic abnormalities, Cc1−/− mice developed several cardiovascular features of metabolic syndrome: endothelial dysfunction, hypertension, kidney dysfunction, cardiac dysfunction with myocardial hypertrophy, and small intimal plaque-like lesions with fat and macrophage deposition in aortae. The restricted size of these aortic lesions (~5-fold smaller than ApoE−/−)(21) was attributed to their limited lipidemia (elevated plasma NEFA in the absence of hypercholesterolemia or hypertriglycedemia). These metabolic factors, driven by impaired insulin clearance owing to Ceacam1 loss in liver and kidney combined with increased endothelial permeability and defective vascular remodeling due to the removal of Ceacam1 in endothelial cells(37) and a robust proinflammatory response to the loss of Ceacam1 in immune cells,(38) could have all contributed to the development of plaque-like lesions in Cc1−/− mice. By specifically deleting Ceacam1 from the liver, the current studies demonstrated that on the Ldlr−/− background, an HC diet-induced increase in hepatic cholesterol and triglyceride synthesis and their defective clearance synergized with hepatic insulin resistance to cause progressive NASH and atheroma.
As we have previously shown,(17) loss of CEACAM1 in liver impaired hepatic insulin clearance to cause chronic hyperinsulinemia and subsequent down-regulation of the insulin receptor and blunting of insulin signaling in hepatic and extrahepatic tissues (such as WAT and aortae). This led to increased hepatic FASN activity and de novo lipogenesis, which together with compromised fatty acid β-oxidation led to hepatic steatosis. In addition to hyperphagia driven by reduced insulin receptor in the hypothalamus,(17) repartitioning of hepatic VLDL-triglycerides to WAT induced visceral adiposity and the subsequent release of NEFA and adipokines (such as IL-6 and TNFα) that triggered systemic insulin resistance and activated several proinflammatory pathways in Ldlr−/−AlbCre+Cc1fl/fl livers and aortae.
The current studies provide in vivo evidence of hepatic insulin resistance playing an inciting factor in the pathogenesis of NASH and atherosclerosis. Mice with liver-specific deletion of the insulin receptor developed extreme insulin resistance and hyperinsulinemia (in part due to impaired insulin clearance). On an atherogenic diet, they developed atherosclerosis.(39) In contrast, Ldlr−/− mice with preserved hepatic insulin sensitivity but total loss of insulin receptor in extrahepatic peripheral tissues, including endothelial cells, showed a partial protection against atherosclerosis.(40) Similarly, liver-specific rescuing of Ceacam1 restored insulin clearance and subsequently curbed hyperinsulinemia and systemic insulin resistance and all cardiometabolic abnormalities of Cc1−/− nulls.(18, 19) Together with the current studies, this highlights the proatherogenic role of hepatic insulin resistance in association with dyslipidemia (low HDL, high VLDL and small dense LDL-ApoB particles, and high triglyceride secretion).(31)
The regulation of insulin signaling by CEACAM1 provides a molecular basis for the “dual insulin signaling hypothesis”(6) that links impaired hepatic insulin clearance to common features of NAFLD/NASH and atherosclerosis, such as low-grade inflammation, oxidative stress, endothelial dysfunction, and fibrosis. As we have shown,(16, 21, 41) insulin-stimulated phosphorylated CEACAM1 binds to Shc to sequester it and reduce coupling of the ras-MAPK pathway to the insulin receptor and restrict NF-κB activation and the transcription of profibrogenic ET-1. By sequestering Shp2, CEACAM1 provides a positive feedback on the IRS1/2-phosphoinositide 3-kinase (PI3K)-Akt-eNOS pathway, promoting NO synthesis and maintaining endothelial function. Thus, insulin-stimulated phosphorylation of CEACAM1 mediates the anti-oxidative and vasodilation-permissive effects of insulin.(20) In hepatocytes, CEACAM1 binding to Shc stabilizes the insulin–insulin receptor complex and targets it to the endocytosis pathways, while its Shp2 binding facilitates insulin translocation between the lysosomal and endosomal compartments to mediate its degradation and receptor’s recycling to the plasma membrane. These shared mechanisms of the regulatory effect of CEACAM1 on insulin metabolism and signaling support our findings that liver-specific deletion of Ceacam1 impairs insulin clearance to cause chronic hyperinsulinemia and modulate insulin signaling in liver and extrahepatic tissues (such as aortae). This tips the balance toward oxidative stress and endothelial dysfunction on one hand (altered metabolic arm of signaling) and inflammation and fibrosis (altered proliferative arm of signaling). Endothelial dysfunction in aortae induces VCAM-1 and ICAM-1 expression to capture leukocytes on the endothelium. That altered insulin signaling is required to mediate the metabolic basis of atherosclerosis is supported by findings that hyperinsulinemia in the absence of impaired insulin signaling and lipid homeostasis did not cause atherosclerosis in ApoE−/− haploinsufficient insulin-receptor mice.(42)
Consistent with NAFLD/NASH(43) and atherosclerosis(12) being linked to insulin resistance by their shared low-grade proinflammatory state, Ldlr−/−AlbCre+Cc1fl/fl mice manifested a remarkable increase in sera and tissues levels of IL-6, TNFα, IL-1β, MCP1, and others in association with ectopic fat accumulation and an increase in visceral obesity. This points to activation of macrophages in liver and aortae, likely by IFNγ released from the atherogenic CD4+Th1 helper cells. Activation of NF-κB by TNFα can increase production of ET-1 from hepatic and aortic macrophages(44) to contribute to fibrosis in both tissues. The rise in TNFα can also suppress Smad7 and its inhibitory effect on the TGFβ pathway, which together with IL-6 would lead to fibrosis.(45) In light of intact expression of CEACAM1 isoforms and absence of preactivation of Ldlr−/−AlbCre+Cc1fl/fl macrophages and lack of macrophage priming or preactivation, this altered response must be related to a cell-autonomous effect brought about by Ceacam1 deletion in liver, likely due to an increase in fat deposition and macrophage recruitment. Moreover, the activated IL-6/STAT3 pathway up-regulated Mcp-1/Ccl2 expression in monocytes/macrophages and repressed Irf-8 to induce Cd11b expression in macrophages to contribute to their elevated transendothelial migration in aortae(46) and to steatohepatitis(47) in Ldlr−/−AlbCre+Cc1fl/fl mice.
Collectively, the cardiometabolic phenotype of Ldlr−/−AlbCre+Cc1fl/fl mice provides in vivo evidence that NAFLD/NASH and atherosclerosis do not simply develop in parallel but that insulin resistance connects them mechanistically within the overall lipidemic-inflammatory microenvironment of metabolic syndrome. The current studies assign a key role for altered hepatic CEACAM1-dependent insulin clearance pathways in insulin resistance characterized by an imbalance of insulin signaling favoring ectopic fat accumulation, visceral obesity, endothelial dysfunction, oxidative stress, inflammation, and fibrogenesis. Thus, the current studies demonstrate a causative role for NAFLD in the pathogenesis of atherosclerosis mediated by impaired insulin clearance driving chronic hyperinsulinemia and followed by hepatic insulin resistance and increased lipogenesis and lipid secretion. The importance of these findings is supported by the reported lower hepatic CEACAM1 levels in patients with insulin-resistant obesity with NAFLD(48) and the attribution of hyperinsulinemia to impaired insulin clearance in these patients.(49) With Ceacam1 expression being induced(50) by most of the drugs that are used to treat these patients,(4) the current studies provide impetus to test whether CEACAM1 is a potential target for drug development against the cardiometabolic anomalies of metabolic syndrome.
Acknowledgment
We thank Hannah Stankus at the Najjar Laboratory for excellent technical support. We thank Gretel Toloza-Alvarez, a Marshall University student, at the Wei Li laboratory for excellent assistance in counting adhesive leukocytes. We also thank the Frederick W. Hiss endowment fund at the University of Toledo and the Osteopathic Heritage Foundation for the John J. Kopchick, Ph.D., Eminent Research Chair fund to S.M.N.