Characterization of Gut Microbiota, Bile Acid Metabolism, and Cytokines in Intrahepatic Cholangiocarcinoma
Abstract
Intrahepatic cholangiocarcinoma (ICC), a type of bile duct cancer, has a high mortality rate. Gut microbiota, bile acid (BA) metabolism, and cytokines have not been characterized in patients with ICC, and better noninvasive diagnostic approaches for ICC are essential to be established. Therefore, in this study we aimed to improve our understanding of changes in gut microbiota, BA metabolism, and cytokines in patients with ICC. We found that the α-diversities and β-diversities of ICC were highest and that the abundances of four genera (Lactobacillus, Actinomyces, Peptostreptococcaceae, and Alloscardovia) were increased in patients with ICC compared with those in patients with hepatocellular carcinoma or liver cirrhosis and in healthy individuals. The glycoursodeoxycholic acid and tauroursodeoxycholic acid (TUDCA) plasma-stool ratios were obviously increased in patients with ICC. Furthermore, the genera Lactobacillus and Alloscardovia that were positively correlated with TUDCA plasma-stool ratios were combined to discriminate ICC from the other three diseases. Vascular invasion (VI) frequently led to a poor prognosis in patients with ICC. Compared with patients with ICC without VI, patients with VI had a greater abundance of the family Ruminococcaceae, increased levels of plasma interleukin (IL)-4 and six conjugated BAs, and decreased levels of plasma IL-6 and chenodeoxycholic acid. A positive correlation between plasma taurocholic acid and IL-4 was observed in patients with ICC. Plasma TUDCA was negatively correlated with the abundance of the genus Pseudoramibacter and the survival time of patients with ICC, but had no effect on tumor size, as determined in two murine tumor models. Conclusion: In this study, we identified some biomarkers, including gut microbiota, BAs and inflammatory cytokines, for the diagnosis of ICC and prediction of VI in patients with ICC.
Abbreviations
-
- AUC
-
- area under the curve
-
- BA
-
- bile acid
-
- CA
-
- cholic acid
-
- CA 19-9
-
- carbohydrate antigen 19-9
-
- CCA
-
- cholangiocarcinoma
-
- CDCA
-
- chenodeoxycholic acid
-
- CI
-
- confidence interval
-
- GCDCA
-
- glycochenodeoxycholic acid
-
- GDCA
-
- glycodeoxycholic acid
-
- GUDCA
-
- glycoursodeoxycholic acid
-
- HCC
-
- hepatocellular carcinoma
-
- ICC
-
- intrahepatic cholangiocarcinoma
-
- IL
-
- interleukin
-
- LC
-
- liver cirrhosis
-
- LDA
-
- linear discriminant analysis
-
- LEFSe
-
- linear discriminant effect size
-
- MCP
-
- monocyte chemoattractant protein
-
- OTU
-
- operational taxonomic unit
-
- PSR
-
- plasma-stool ratio
-
- ROC
-
- receiver operating characteristic
-
- TCA
-
- tricarboxylic acid
-
- TDCA
-
- taurodeoxycholic acid
-
- TG
-
- triglyceride
-
- TGF
-
- transforming growth factor
-
- TNF
-
- tumor necrosis factor
-
- TUDCA
-
- tauroursodeoxycholic acid
-
- VI
-
- vascular invasion
Cholangiocarcinoma (CCA), also known as bile duct cancer, is the second most common malignancy of the liver, accounting for 10%-20% of primary hepatic malignancies.1, 2 CCA is classified as intrahepatic, perihilar, or distal based on anatomic location.3 Although considered a rare type of cancer, intrahepatic cholangiocarcinoma (ICC) is associated with a high mortality rate and has shown increased incidence in recent years. Many risk factors, including primary sclerosing cholangitis, hepatitis C virus, hepatitis B virus, smoking, cirrhosis and obesity, are involved in ICC.4
The gut microbiota is involved in protection against or promotion of different diseases, including various cancers.5 The gut microbiota composition differs in several diseases, including obesity, inflammatory bowel disease, and hepatocellular carcinoma (HCC), suggesting a distinct intestinal metabolism and immune response in each patient.6 Ponziani et al. reported the features of the gut microbiota association with HCC in patients with cirrhosis with nonalcoholic fatty liver disease.7 Moreover, correlations between the gut microbiota and liver cirrhosis (LC) were also characterized by metagenomics analysis.8 However, the features of the gut microbiota in patients with ICC and the interactions of ICC with the gut microbiota have not been clarified. Small ICCs can be difficult to distinguish from HCC.9 Moreover, the distinct compositions of the gut microbiota among patients with ICC, HCC, and LC and healthy individuals are unclear.
The gut microbiota mediates bile acid (BA) metabolism by transforming intestinal BA into secondary and unconjugated forms.10 BAs are produced in the liver via cytochrome P450-mediated oxidation of cholesterol.11 Notably, serum BA composition patterns differ in various liver diseases and can be used for diagnosis.12 BAs have been reported to regulate CCA cell growth13, 14; however, the mechanisms through which specific gut microbiota mediate BA compositions in ICC to affect tumor progression are still unclear.
Vascular invasion (VI) is negatively correlated with prognosis in patients with ICC. However, no other predictors of VI in ICC have been reported, and the relationships among VI, gut microbiota, BAs, and cytokines in patients with ICC have not been evaluated.
Therefore, in this study, we characterized the gut microbiota, BAs, and cytokines to identify biomarkers for ICC diagnosis and VI prediction and explored the correlations of these factors with ICC.
Materials and Methods
Patients
Four groups (84 individuals) were included in this study. The demographic information and clinical characteristics of all patients are given in Supporting Table S1. Among the patients enrolled in the study, 28 patients with ICC (group I) and 28 patients with HCC (group H) were identified by pathological diagnosis. The other two groups included 16 patients with LC (group L) diagnosed using biopsy and 12 normal (healthy) individuals (group N). Healthy individuals with no prior cancer or liver disease diagnoses were selected among hospital researchers for group N. The histology of diseased and healthy peripheral liver tissues is shown in Supporting Fig. S1. The individuals enrolled in our study were treated at our hospital between 2016 and 2017. The exclusion criteria were as follows: (1) patients with hilar or distal cholangiocarcinoma, (2) patients with intrahepatic metastasis of extrahepatic cholangiocarcinoma, (3) patients with ICC mixed with HCC, (4) patients with other malignancies, (5) individuals with incomplete information, (6) individuals who abused alcohol, and (7) individuals who recently received treatment with antibiotic or probiotics. VI of ICC was also defined by the findings on final pathologic analysis. The study was approved by the ethics review committee of the Fifth Medical Center of PLA General Hospital. All participants provided informed consent for participation in this study.
Sample Collection
Blood plasma samples were collected for measurement of BAs and cytokines. Stool samples were collected to analyze BAs, and DNA was extracted for gut microbiota analysis.
DNA Extraction and 16S Ribosome RNA V4 Region Sequencing
DNA extraction was carried out according to the MoBio PowerSoil DNA Isolation Kit 12888-100 protocol (Qiagen, Hilden, Germany), and DNA was stored at −80°C in Tris-EDTA buffer solution (Sigma-Aldrich, St. Louis, MO) before use. To enable amplification of the V4 region of the 16S ribosomal RNA gene and add barcode sequences, unique fusion primers were designed based on the universal primer set, 515F (5′-GTGYCAGCMGCCGCGGTAA-3′) and 806R (5′-GGACTACNVGGGTWTCTAAT-3′), along with barcode sequences. PCR mixtures contained 1 μL of each forward and reverse primer (10 μM), 1 μL of template DNA, 4 μL of deoxyribonucleotide triphosphates (2.5 mM), 5 μL of 10 × EasyPfu Buffer (TransGen Biotech Co., Beijing, China), 1 μL of EasyPfu DNA Polymerase (2.5 U/μL), and 1 μL of double distilled water in a 50-μL reaction volume. Thermal cycling consisted of an initial denaturation step at 95°C for 5 minutes, followed by 30 cycles of denaturation at 94°C for 30 seconds, annealing at 60°C for 30 seconds, and extension at 72°C for 40 seconds, with a final extension step at 72°C for 4 minutes. Amplicons from each sample were run on an agarose gel. The expected band size for 515f-806r was about 300-350 bp. Amplicons were quantified with the Qubit dsDNA HS Assay Kit (Q32854; Thermo Fisher, Waltham, MA/Invitrogen, Carlsbad, CA) following the manufacturer’s instructions. The amplicon library for high-throughput sequencing on the Illumina MiSeq platform was combined with an equal amount and subsequently quantified (KAPA Library Quantification Kit KK4824; Kapa Biosystems, Wilmington, MA) according to the manufacturer’s instructions.
Profiling of 16S Ribosomal RNA Gene Sequencing Data
Using the Quantitative Insights into Microbial Ecology 1.8.0 pipeline1, the raw sequences were processed to concatenate reads into tags according to the overlapping relationship; then, reads belonging to each sample were separated with barcodes, and low-quality reads were removed. The processed tags were clustered into the operational taxonomic units (OTUs) at the commonly used 97% similarity threshold. The OTUs were assigned to taxa by matching to the Greengenes database (Release 13.82). A phylogenetic tree of representative sequences was built. Alpha and beta diversity analyses were performed. Distances were calculated with R (3.3.1, flexmix package).
Bile Acid Detection15
The stool samples were weighted and transferred to a 1.5 mL-centrifuge tube followed by a supplement of 1 mL methanol. Then the tubes were shocked at room temperature for 1 hour and centrifuged at 13,200 rpm for 10 minutes. The supernatant was vacuum-dried and resuspended into 150 μL methanol. After a second centrifugation, the supernatant of stool extract was measured.
An aliquot of 200 μL of blood plasma was extracted with 600 μL of methanol containing the internal standards. The mixture was shocked at room temperature for 10 minutes and centrifugated at 13,200 rpm for 10 minutes. The 500 μL supernatant was vacuum-dried and resuspended into 100 μL methanol. After a second centrifugation, the supernatant of plasma extract was measured.
The stool and plasma extracts as well as the BA reference standards were analyzed with an UltiMate 3000 ultra-performance liquid chromatography (UPLC) coupled with a Q Exactive mass spectrometer (MS) (Thermo Fisher). The entire UPLC-MS system was controlled by Xcalibur 3.0 software. All chromatographic separations were performed with a HSS (High Strength Silica) T3 C18 column (1.7 μm, 100 mm × 2.1 mm internal dimensions; Waters, Milford, MA) and the injection volume was 1 μL. The mass spectrometer was operated in negative polarity with a 3-kv spray voltage. The heated capillary temperature was 320°C. The sheath gas and auxiliary gas were 30 psi and 10 psi, respectively. The parameters for the full mass scan were as follows: a resolution of 70,000, an auto gain control target under 1 × 10⁶, a maximum isolation time of 50 ms, and a mass-to-charge ratio range of 100-1,500. The calibration was customized for the analysis of Q Exactive to keep the mass tolerance of 5 ppm. The UPLC-MS raw data were analyzed using Xcalibur 3.0 software to obtain the calibration equations and the quantitative concentration of each BA in the samples. The BA standards were TUDCA, glycoursocholic acid (GUDCA), taurocholic acid (TCA), glycocholic acid (GCA), taurochenodeoxycholic acid, taurodeoxycholic acid, taurolithocholic acid, glycolithocholic acid, ursodeoxycholic acid, lithocholic acid, dehydrocholic acid, glycochenodeoxycholic acid (GCDCA), glycodeoxycholic acid (GDCA), cholic acid (CA), chenodeoxycholic acid (CDCA), and free deoxycholic acid (DCA).
Measurement of Cytokines and Histamine
The concentrations of blood plasma interleukin (IL)-4, tumor necrosis factor (TNF)-α, IL-6, IL-10, transforming growth factor (TGF)-β1, TGF-β2, IL-1β, monocyte chemoattractant protein (MCP)-1, and histamine were analyzed using the ProcartaPlex Multiplex Immunoassay system (eBioscience, Inc., San Diego, CA) and related enzyme-linked immunosorbent assay kits, according to the manufacturer’s instructions.
Murine Tumor Models
Male BALB/c nude mice (4 weeks old) were purchased from the Vital River Company (Beijing, China) and housed under specific pathogen-free conditions. Nude mice received TUDCA dissolved in 0.5% sodium carboxymethyl cellulose at a dose of 1,000 mg/kg once daily, and a control group received the same volume of vehicle by gavage 5 days per week for 8 weeks. The TUDCA/vehicle fed nude mice were divided into two groups at the second week, respectively, followed by hypodermic or intrahepatic injection of cholangiocarcinoma cell line QBC939 (2 × 10⁶ cell/mouse) into the mice of each group. The tumor size of each injected mice was measured at the end of the eighth week. All animal studies were approved by the Animal Welfare and Ethics Committee of the Fifth Medical Center of PLA General Hospital.
Statistical Analysis
Spearman’s correlation was calculated using R 3.3.1 software and SPSS 22.0 software. Correlation of gut microbiota with BAs was visualized through a heatmap.
Results
Gut Microbiota Features of ICC, HCC, LC, and Healthy Individuals
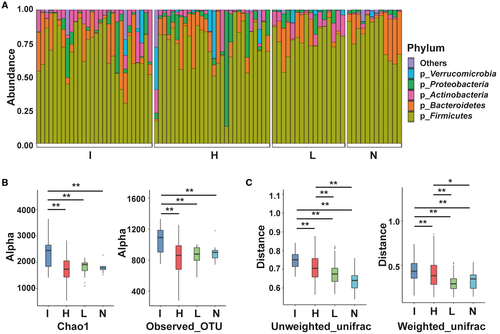
The characteristics of stool bacteria among the four groups were analyzed using 16S sequencing. The phylum Firmicutes was the most abundant in all groups (Fig. 1A). α-Diversity metrics showed that group I had the highest biodiversity among all four groups (Fig. 1B). There were no differences in α-diversity among patients with HCC, patients with LC, and healthy individuals. The stool bacterial community profiles for patients with ICC were the least homogeneous among the four groups with regard to β-diversity (Fig. 1C). Additionally, the homogeneity of stool bacterial communities in patients with HCC was lower than that of the remaining two groups.
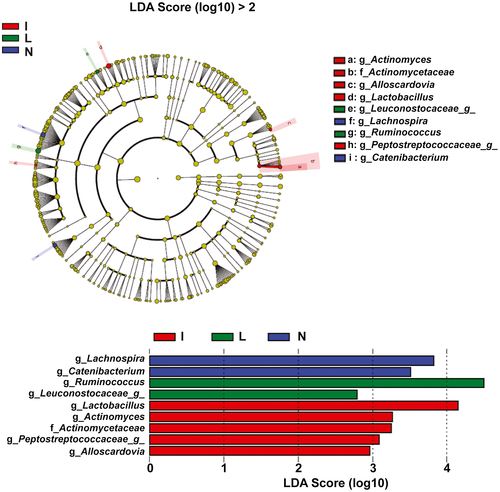
At the genus level, patients with ICC showed higher prevalence rates of Lactobacillus, Actinomyces, Peptostreptococcaceae, and Alloscardovia than the other groups by linear discriminant effect size (LEFSe) analysis (Fig. 2). The genera Ruminococcus and Leuconostocaceae were most abundant in group L, and the genera Lachnospira and Catenibacterium were most abundant in group N. However, compared with other groups, group H had no abundant genera.
Bile Acid Biomarkers for ICC Diagnosis
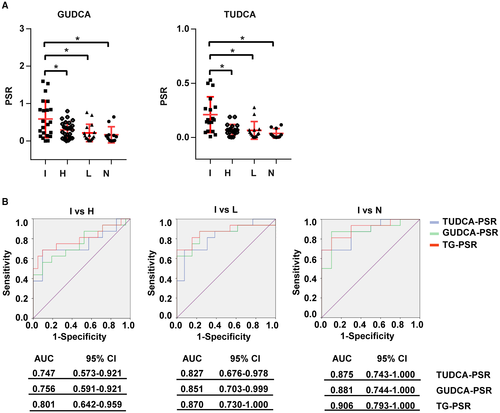
The gut microbiota can mediate the metabolism of primary BAs into secondary BAs and the deconjugation of BAs. In this study, we measured the levels of 16 BAs in blood plasma and stool samples from all participants using mass spectrometry. Among the four groups, there were no single BAs that could significantly distinguish ICC from HCC, LC, and healthy individuals. Therefore, we then calculated the plasma-stool ratios (PSRs) of BAs in each participant and found that the PSRs of two conjugated BAs were able to distinguish ICC from the other three groups. As shown in Fig. 3A, TUDCA-PSR and GUDCA-PSR were significantly higher in patients with ICC than in patients with HCC or LC and in healthy individuals. The diagnostic values of TUDCA-PSR and GUDCA-PSR were examined by receiver operating characteristic (ROC) analysis (Fig. 3B). The area under the curve (AUC) value of triglyceride (TG)-PSR, which indicated combining TUDCA-PSR and GUDCA-PSR between ICC and HCC, was 0.801 (95% confidence interval [CI]: 0.642-0.959). Additionally, the AUC value of TG-PSR between ICC and LC was 0.870 (95% CI: 0.730-1.000), and the AUC value of TG-PSR between ICC and healthy individuals was 0.906 (95% CI: 0.793-1.000). However, no PSRs of other BAs were significantly different among the four groups (Supporting Fig. S2A). Carbohydrate antigen 19-9 (CA 19-9), carcinogenic embryonic antigen (CEA), and cancer antigen 125 (CA 125) were used as positive controls in the comparisons of the four groups, and these three markers showed the highest concentrations in patients with ICC (Supporting Fig. S2B).
Genera Lactobacillus and Alloscardovia were Positively Correlated With TUDCA-PSR and Combined to Identify ICC
The correlation of the gut microbiota with TUDCA-PSR and GUDCA-PSR was analyzed. TUDCA-PSR was strongly positively correlated with the genera Lactobacillus and Alloscardovia (Fig. 4A). In contrast, GUDCA-PSR tended to be positively correlated with the genera Lactobacillus, Actinomyces and Alloscardovia, but no statistically significant differences were observed. The genus Catenibacterium was negatively correlated with GUDCA-PSR and TUDCA-PSR.
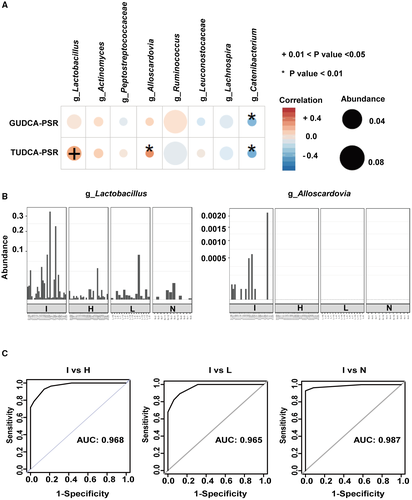
The abundances of Lactobacillus and Alloscardovia were further evaluated in each participant in the four groups. Lactobacillus was the most abundant. Notably, Alloscardovia was only observed in patients with ICC (Fig. 4B). Based on the logistic regression model, the genera Lactobacillus and Alloscardovia were combined to distinguish ICC from HCC, LC, and healthy controls by ROC curve analysis. As shown in Fig. 4C, the combination of the two genera could discriminate ICC from HCC with an AUC of 0.968. These two genera yielded AUCs of 0.965 and 0.987 to distinguish ICC from LC and healthy controls, respectively.
Gut Microbiota was Associated With VI in Patients With ICC
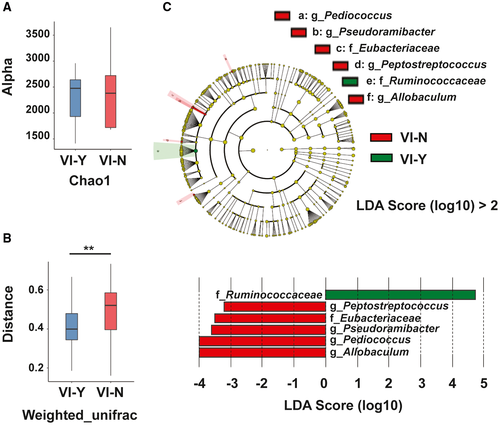
VI is associated with a poor prognosis in patients with cancer. In group I, the 3-year survival rates of patients with VI and without VI were 24.2% and 54.7%, respectively (Supporting Table S2). We further characterized the gut microbiota of patients with ICC with and without VI. Compared with patients with ICC without VI (group VI-N), patients with ICC with VI (group VI-Y) had similar α-diversity (Fig. 5A). In contrast, group VI-N showed higher β-diversity than group VI-Y (Fig. 5B). LEFSe analysis was used to determine the abundance of the gut microbiota in the two groups. The family Ruminococcaceae was more abundant in group VI-Y than in group VI-N. Compared with group VI-Y, group VI-N showed higher abundances of the family Eubacteriaceae and the genera Allobaculum, Pediococcus, Pseudoramibacter, and Peptostreptococcus (Fig. 5C). These results indicated that the gut microbiota was related to VI in patients with ICC.
Changes in Bile Acids and Inflammatory Cytokines in Patients With ICC With VI
Next, we compared stool and plasma BAs in groups VI-N and VI-Y. Six plasma BAs (i.e., CDCA, GCDCA, TCA, GDCA, TDCA, and TUDCA) had different concentrations in the two groups. The concentrations of plasma GCDCA, TCA, GDCA, TDCA, and TUDCA were higher in group VI-Y than in group VI-N. These five BAs were conjugated BAs. In contrast, the concentration of plasma CDCA (free BA) was higher in group VI-N (Fig. 6A).
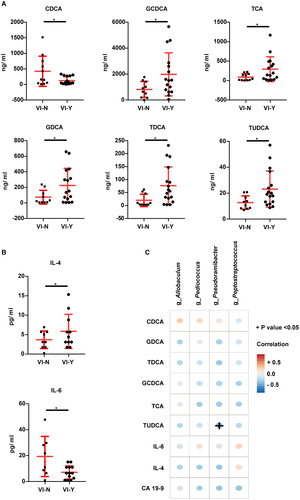
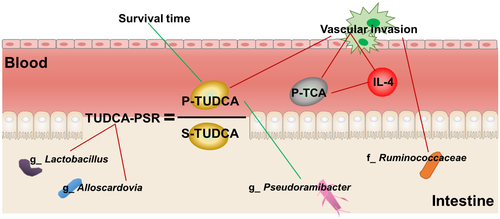
BAs interact with their receptors (farnesoid X receptor and G protein-coupled BA receptor 1) to regulate inflammation.16, 17 We detected some cytokines, including IL-4, TNF-α, IL-6, IL-10, TGF-β1, TGF-β2, IL-1β and MCP-1, and histamine in blood plasma. As shown in Fig. 6B, patients with ICC with VI had higher levels of IL-4 and lower levels of IL-6 than patients with ICC without VI. However, the levels of TNF-α, IL-10, TGF-β1, TGF-β2, IL-1β, MCP-1, and histamine were similar between the two groups (Supporting Fig. S3A). Additionally, IL-4 levels were positively correlated with plasma TCA (r = 0.505, P = 0.023) by correlation analysis (Supporting Table S3).
Three conventional ICC markers (i.e., CA 19-9, CA 125, and CEA) were compared between the two groups, and only CA 19-9 was found to be increased in patients with ICC with VI (Supporting Fig. S3B). Moreover, the correlations of plasma CDCA, GCDCA, TCA, GDCA, TDCA, TUDCA, IL-4, IL-6, and CA 19-9 with various genera (Allobaculum, Pediococcus, Pseudoramibacter, and Peptostreptococcus) were analyzed. The genus Pseudoramibacter was negatively correlated with plasma TUDCA, whereas there were no correlations with the other genera (Fig. 6D).
TUDCA was Negatively Correlated With Survival in Patients With ICC but was Not Related to Tumor Size
These results indicated that plasma TUDCA may be related to ICC development. We analyzed the correlations of plasma TUDCA with survival, tumor number, tumor size, and lymph node metastasis again. Patients with ICC with lower plasma TUDCA levels had longer survival times (Fig. 7A). Moreover, plasma TUDCA was positively correlated with tumor number, but was not correlated with tumor size and lymph node metastasis (Supporting Table S4).
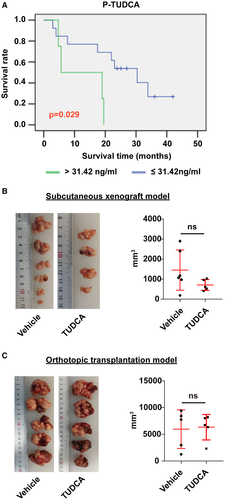
It had been reported that TUDCA inhibits the growth of Mz-ChA-1 cholangiocarcinoma cells18; therefore, we further determined the role of TUDCA in tumor growth using two murine cholangiocarcinoma models. As shown in Fig. 7B,C, mice fed TUDCA had tumor sizes similar to those in the vehicle-treated group in both mouse models, consistent with our clinical analysis.
Discussion
ICC is a devastating malignancy with high incidence and mortality rates. However, few studies had evaluated the features of the gut microbiota. Therefore, in this study, we characterized the gut microbiota, BAs, and cytokines in patients with ICC in order to explore the complex features of this malignancy.
In this study, we found that the α-diversities and β-diversities of the gut microbiota in ICC were obviously increased. Negative feedback, which is controlled by interplay between microbial metabolic activities and host pathways, is thought to promote high bacterial diversity.19 However, the negative feedback affecting the composition of the gut microbiota in patients with ICC has not been identified. LEFSe analysis identified four genera (i.e., Lactobacillus, Actinomyces, Peptostreptococcaceae, and Alloscardovia) showing higher abundances in ICC. Avilés-Jiménez et al. previously showed that the abundance of bile duct Actinomyces was increased in extrahepatic cholangiocarcinoma compared with that in benign biliary pathology.20 Thus, the increased Actinomyces in the bile duct of patients with extrahepatic cholangiocarcinoma may have originated from the intestine.
The gut microbiota mediates the metabolism of BAs. Accordingly, in this study, we quantified stool BAs, plasma BAs, and BA-PSRs. Some studies have reported that BA levels in patients with CCA were different from those in healthy individuals and patients with benign biliary disease. Total serum BAs were higher in patients with CCA than in healthy controls. The ratio of glycine-conjugated BAs to taurine-conjugated BAs was decreased in patients with CCA. In a previous study, total BAs, CA, and CDCA in the gallbladder bile was higher in patients with CCA than in patients with benign biliary disease.21 However, no specific BAs have been identified as diagnosis markers for CCA or ICC. ICC is notoriously difficult to diagnose because of its paucicellular nature, anatomic location, and silent clinical characteristics.4, 22 Poorly differentiated HCC and ICC show similar presentation with regard to pathology, and noninvasive diagnostic approaches have low accuracy for distinguishing ICC from HCC.23 Additionally, there are currently no specific tumor markers for CCA.24 In this study, we found that TUDCA-PSR and GUDCA-PSR could be used to discriminate ICC from HCC, LC, and healthy controls. TUDCA-PSR and GUDCA-PSR were highest in the ICC group. The use of the BA-PSR could minimize individual variation, regardless of the baseline level of BAs. To evaluate the diagnostic potential of TUDCA-PSR and GUDCA-PSR, large-scale studies are required.
By Spearman correlation analysis, we found that TUDCA-PSR was positively correlated with Lactobacillus and Alloscardovia. However, no statistically significant correlations of stool and plasma TUDCA with these two genera were observed. The genus Lactobacillus had a higher abundance in ICC. In contrast, in a previous study in db/db-intermittent fasting mice, plasma TUDCA was significantly increased and gut Lactobacillus was enriched, but the correlations between TUDCA-PSR and Lactobacillus were not reported.25 A recent study also reported that Lactobacillus could deconjugate BAs.11 Alloscardovia is a new genus in the family Bifidobacteriaceae and is gram-positive.26 These bacteria are considered nonpathogenic in humans and have been isolated from the blood, urine, urethra, oral cavity, tonsils, lung abscesses, and aortic valves.27 The exact relationship of Alloscardovia with clinical diseases has not been reported. We detected Alloscardovia only in patients with ICC; however, the reason for this is still unknown. Notably, combination of genera Lactobacillus and Alloscardovia had an outstanding classification performance for ICC in our test groups. However, because of the small sample size of our study, multicenter studies or more volunteers are required to examine the diagnostic efficiency of this approach.
VI of ICC can induce tumor metastasis, resulting in poor treatment outcomes. However, the association of the gut microbiota with VI in patients with ICC is unknown. Our results showed that one family and four genera of gut microbiota were more abundant in patients with ICC without VI than in patients with VI. The higher β-diversity in group VI-N may contribute to reduced tumor VI. The family Ruminococcaceae was more abundant in group VI-Y than in group VI-N. Plieskatt et al. reported that the intestinal microbiota, including Ruminococcaceae, was increased in an Opisthorchis viverrini–induced CCA hamster model, resulting in a distinct inflammatory response related to CCA development.28 Moreover, Ponziani et al. reported that Ruminococcaceae was increased in patients with cirrhosis and HCC compared with those without HCC, suggesting a role in the progression of the disease via increased inflammation and protumorigenic stimulation.7
BAs are not only the metabolic product of hepatic cholesterol metabolism but are also involved in tumor diagnosis and progression.13, 29 BAs and cytokines were altered between patients with ICC with VI and those without VI. Patients with ICC with VI had increased plasma GCDCA, TCA, GDCA, TDCA, TUDCA, and IL-4 and decreased plasma CDCA and IL-6. Free BAs (i.e., CA, DCA, and CDCA) inhibited the growth of cholangiocarcinoma cells by promoting apoptosis and decreased IL-6 expression in QBC939 cells, whereas conjugated BAs (GCA, GDCA, and GCDCA) stimulated cell growth and increased IL-6 expression in QBC939 cells.13, 30 TCA also mediated CCA cell proliferation, migration, and invasion,14 whereas TCA and TUDCA had no significant effect on IL-6 secretion in murine biliary epithelial cells.31 However, in our study, plasma IL-6 was not higher in group VI-Y than in group VI-N. TCA has been reported to modulate TNF-α and IL-1β expression and increase the CD4+/CD8+ T-cell ratio in mice.32 In this study, we found that plasma TCA was positively correlated with plasma IL-4 and IL-1β; however, it is unclear how TCA regulates IL-4 expression. IL-4 could induce M2-activated tumor-associated macrophages that are significantly associated with Opisthorchis viverrini–induced CCA metastasis and promote pancreatic islet cancer invasion.33, 34 Further studies are necessary to evaluate the relationship of IL-4 with VI in ICC.
In this study, we found that patients with ICC with lower plasma TUDCA had prolonged survival; however, the levels of other BAs, cytokines, and histamine did not correlate with survival time (Supporting Fig. S4A,B). Moreover, patients with ICC with higher CA 19-9 had shorter survival times (Supporting Fig. S4C), consistent with the results of Yoo et al.35 TUDCA is used to treat primary sclerosing cholangitis, which is considered as the risk factor of CCA. The reason that plasma TUDCA was negatively correlated with survival of patients with ICC in our results is unknown. More data were required to study this negative correlation. About the role of TUDCA in tumor growth, the results of our two in vivo models were not consistent with the in vitro results. This discrepancy may highlight the complexity of the body system, supporting the notion that cellular studies do not necessarily reflect the real host response.
In conclusion, we characterized the gut microbiota and metabolism of BAs in ICC and proposed some diagnostic markers, including two PSRs of BAs (TUDCA-PSR and GUDCA-PSR) and two genera (Lactobacillus and Alloscardovia), for ICC. We systematically demonstrated the relationships among gut microbiota, BAs, and cytokines (Fig. 8).


