Methionine Adenosyltransferase α1 Is Targeted to the Mitochondrial Matrix and Interacts with Cytochrome P450 2E1 to Lower Its Expression
Abstract
Methionine adenosyltransferase α1 (MATα1, encoded by MAT1A) is responsible for hepatic biosynthesis of S-adenosyl methionine, the principal methyl donor. MATα1 also act as a transcriptional cofactor by interacting and influencing the activity of several transcription factors. Mat1a knockout (KO) mice have increased levels of cytochrome P450 2E1 (CYP2E1), but the underlying mechanisms are unknown. The aims of the current study were to identify binding partners of MATα1 and elucidate how MATα1 regulates CYP2E1 expression. We identified binding partners of MATα1 by coimmunoprecipitation (co-IP) and mass spectrometry. Interacting proteins were confirmed using co-IP using recombinant proteins, liver lysates, and mitochondria. Alcoholic liver disease (ALD) samples were used to confirm relevance of our findings. We found that MATα1 negatively regulates CYP2E1 at mRNA and protein levels, with the latter being the dominant mechanism. MATα1 interacts with many proteins but with a predominance of mitochondrial proteins including CYP2E1. We found that MATα1 is present in the mitochondrial matrix of hepatocytes using immunogold electron microscopy. Mat1a KO hepatocytes had reduced mitochondrial membrane potential and higher mitochondrial reactive oxygen species, both of which were normalized when MAT1A was overexpressed. In addition, KO hepatocytes were sensitized to ethanol and tumor necrosis factor α–induced mitochondrial dysfunction. Interaction of MATα1 with CYP2E1 was direct, and this facilitated CYP2E1 methylation at R379, leading to its degradation through the proteasomal pathway. Mat1a KO livers have a reduced methylated/total CYP2E1 ratio. MATα1’s influence on mitochondrial function is largely mediated by its effect on CYP2E1 expression. Patients with ALD have reduced MATα1 levels and a decrease in methylated/total CYP2E1 ratio. Conclusion: Our findings highlight a critical role of MATα1 in regulating mitochondrial function by suppressing CYP2E1 expression at multiple levels.
Abbreviations
-
- ALD
-
- alcoholic liver disease
-
- ATP
-
- adenosine triphosphate
-
- co-IP
-
- coimmunoprecipitation
-
- CYP2E1
-
- cytochrome P450 2E1
-
- HCC
-
- hepatocellular carcinoma
-
- HSP
-
- heat shock protein
-
- IP
-
- immunoprecipitation
-
- KO
-
- knockout
-
- MAT
-
- methionine adenosyltransferase
-
- me-CYP2E1
-
- methylated CYP2E1
-
- mROS
-
- mitochondrial ROS
-
- MS
-
- mass spectrometry
-
- NAFLD
-
- nonalcoholic fatty liver disease
-
- NIAAA
-
- National Institute on Alcohol Abuse and Alcoholism
-
- ROS
-
- reactive oxygen species
-
- SAM
-
- S-adenosyl methionine
-
- siRNA
-
- small interfering RNA
-
- SLC25A26
-
- solute carrier family 25, member 26
-
- t1/2
-
- biological half-life
-
- TNF-α
-
- tumor necrosis factor α
-
- WT
-
- wild type
S-adenosyl methionine (SAM) is the principal biological methyl donor of the cell that is synthesized by methionine adenosyltransferase (MAT), an enzyme encoded by the MAT gene, which is one of the 482 essential genes required for survival.1 Two genes in mammals (MAT1A and MAT2A) encode for the catalytic subunits MATα1 and MATα2. The former is expressed largely in normal liver, and the latter is expressed in all extrahepatic tissues.1 Patients with chronic liver disease have reduced hepatic MAT activity, due to both a decrease in MAT1A mRNA levels and inactivation of MATα1 protein itself.1 MAT1A expression is reduced in individuals with alcoholic hepatitis,2 in those with nonalcoholic fatty liver disease (NAFLD) with more advanced fibrosis,3 in nearly 90% of patients with cirrhosis,4 and in most patients with hepatocellular carcinoma (HCC).4, 5 Mat1a knockout (KO) mice have chronic hepatic SAM deficiency and spontaneously develop steatohepatitis and HCC.6, 7 These mice are also sensitized to CCl4-induced hepatotoxicity, due to higher cytochrome P450 2E1 (CYP2E1) expression,7 and display a decrease in mitochondrial membrane potential.8 However, the underlying mechanism for increased CYP2E1 expression is unknown, and whether this contributes to a lower mitochondrial membrane potential in Mat1a KO mice is also unclear.
CYP2E1 has been implicated in numerous diseases, and its expression is up-regulated in alcoholic liver disease (ALD)9, 10 and NAFLD.11, 12 CYP2E1 has been shown to be localized within several subcellular compartments including the endoplasmic reticulum (ER) and Golgi apparatus and within the mitochondrial matrix.13-17 It has been suggested that CYP2E1-mediated damage to mitochondrial membrane potential and function, through the production of reactive oxygen species (ROS), may be an early event in liver injury.9, 10
We recently showed that MATα1 interacts with proteins such as c-MYC and MAX (MYC-associated factor x) to modulate E-box-dependent gene expression.18, 19 The aims of this work were to further define what proteins could interact with MATα1 and to explore how MATα1 regulates CYP2E1 expression and mitochondrial function. Here, we revealed the finding that MATα1 is localized to the mitochondrial matrix where it interacts with CYP2E1 to influence mitochondrial membrane potential and generation of ROS. Our results revealed a role of MATα1 in providing a mitochondrial source of SAM in hepatocytes and that it negatively regulates CYP2E1 protein stability through methylation at a critical arginine residue.
Materials and Methods
Mat1a KO and WT Mice Experiments
Mat1a KO mice were described.6 Four-month-old male KO and wild-type (WT) littermates were used for this study unless specified in the figure legend. Some mice were used for isolation of hepatocytes as described,20 whereas other mice livers were used for RNA, protein analysis, and isolation of mitochondria as described in Supporting Information.
Female WT mice were treated with ethanol or pair-fed control diet following the protocol of the National Institute on Alcohol Abuse and Alcoholism (NIAAA) model.21 All procedure protocols, use, and the care of the animals were reviewed and approved by the Institutional Animal Care and Use Committee at Cedars-Sinai Medical. Please see Supporting Information for details.
Human Samples
Liver specimens from subjects with ALD (n = 5) were obtained from the explant during liver transplantation. All had history of alcohol consumption averaging at least 80 g/day for men or 50 g/day for women, for at least 10 years.22 This criterion is based on epidemiological evidence of the alcohol consumption and cirrhosis relationship.23 We excluded patients with hepatitis B or C, autoimmune liver disease, hemochromatosis, Wilson disease, and HCC. Patients’ clinical characteristics are shown in Supporting Table S1. Liver samples from controls (n = 4) were from subjects with no known history of excessive alcohol use or underlying chronic liver disease. They were obtained during abdominal surgeries for various causes. Samples were obtained under a protocol approved by the Human Subjects and Institutional Review Board at Indiana University Indianapolis. Written informed consent was obtained from each participant.
Mitochondrial Membrane Potential and ROS Measurements
Mitochondrial membrane potential was measured using the MitoProbe JC-1 (Molecular Probes, Eugene, OR) assay kit following the protocol provided. Mitochondrial ROS was measured using the MitoSOX Red kit (Molecular Probes, Eugene, OR) according to the manufacture’s guide. Five micromolar antimycin A was added 10 minutes after (SML0737; Sigma, St. Louis, MO) or 5 μM of MitoTEMPO was added an hour before the start of the assay for positive and negative controls, respectively.
Additional Methods
All other methods used are described in detail in the Supplemental Methods section of the Supporting Information.
Results
MATα1 Interactome Includes A Predominance of Mitochondrial Proteins
To define the MATα1 interactome, we performed immunoprecipitation (IP) with an anti-MATα1 antibody (Ab) using liver lysates from WT and Mat1a KO mice. Proteins were then separated on sodium dodecyl sulfate–polyacrylamide gel electrophoresis and identified using mass spectrometry (MS). Silver stain was used to highlight the differences between the WT and Mat1a KO mice samples (Supporting Fig. S1A). Of the top 24 highest-scoring proteins, 11 of them were mitochondrial (Supporting Table S2). To further examine the MATα1 interactome, gene ontology and Kyoto Encyclopedia of Genes and Genomes pathways enrichment analysis were performed using the STRING database (https://string-db.org/). Of the total 375 proteins, 40% were classified as mitochondrial, with most of them associated to the mitochondrial matrix and inner mitochondrial membrane (Supporting Fig. S1B,C). Additionally, the main mitochondrial metabolic pathways including glycolysis, the tricarboxylic cycle, and oxidative phosphorylation were all enriched (Supporting Fig. S1D). CYP2E1, a protein that is elevated in the Mat1a KO mouse liver that can also target the mitochondria, was also identified (Supporting Table S2).
MATα1 Is Localized to the Mitochondrial Matrix of Hepatocytes
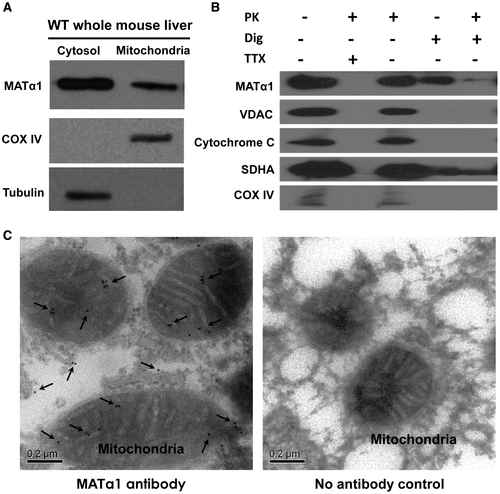
Because mitochondrial proteins account for such a high proportion of the MATα1 interactome, we next examined whether MATα1 was localized within the mitochondria. Isolation of mitochondria from WT mice liver revealed the presence of MATα1 within this organelle (Fig. 1A). To determine localization within the mitochondria, WT mice liver mitochondria were subjected to subfractionation with chemical agents to access the different compartments, followed by western blotting with known marker proteins of each mitochondrial compartment, which revealed MATα1 to be in the matrix, as shown in the final column (Fig. 1B). To confirm the matrix location of MATα1 and rule out the possibility of contamination from the other cellular compartments, immunogold electron microscopy (EM) was performed using WT mouse liver, and the presence of MATα1 can be seen as discrete concentric gold particles within the mitochondrial matrix and cytosol (Fig. 1C, left panel), which are absent in the negative control (Fig. 1C, right panel; Supporting Fig. S2).
MATα1 Interacts With Molecular Chaperones, and its Mitochondrial Targeting Requires HSP70A8
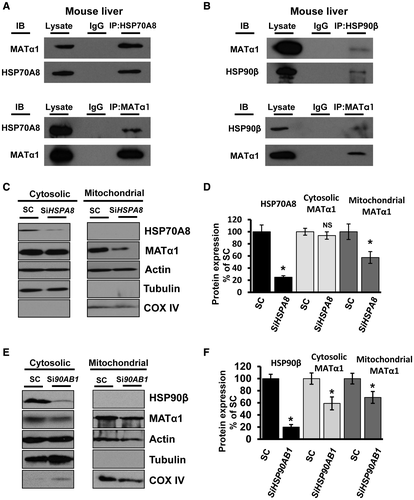
MATα1’s presence in the mitochondrial matrix of hepatocytes prompted us to question how this protein is targeted to this organelle. Because MATα1 contains no mitochondrial targeting sequence to aid localization to the mitochondria as determined by multiple organelle localization prediction servers (TargetP, Multiloc, and MitoFates), other known mechanisms of protein trafficking to the mitochondria were studied, namely, the use of heat shock proteins (HSPs).24 HSP70A8 and HSP90β, HSPs known to be involved in protein trafficking, were identified to interact with MATα1 (Supporting Table S2). IPs using WT mouse liver were carried out and showed that MATα1 interacts with the cytosolic molecular chaperones HSP70A8 and HSP90β (Fig 2A,B). When HSPA8 was knocked down in HepG2 cells, MATα1 levels decreased in the mitochondrial fraction by 45%, suggesting that HSP70A8 plays an important role in MATα1 localization to the mitochondria (Fig 2C,D; and second small interfering RNA [siRNA] shown in Supporting Fig. S3A). In contrast, when HSP90AB1 was knocked down, mitochondrial MATα1 also fell by 32%, but this was due to a drop by the same amount of cytosolic MATα1 (Fig. 2E,F; and second siRNA shown in Supporting Fig. S3B).
MATα1 Affects Mitochondrial Function, Mitochondrial ROS, and Mitochondrial Membrane Potential
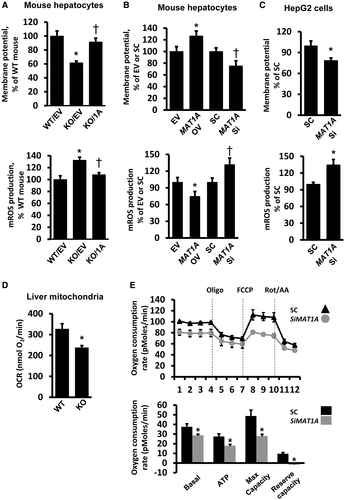
It was reported that Mat1a KO mice had reduced mitochondrial membrane potential,8 so functional experiments were explored to evaluate the effect of MATα1 on mitochondrial function. Consistent with published data,8 we found that the hepatocytes from the Mat1a KO mouse showed a 40% reduction in mitochondrial membrane potential as compared with WT hepatocytes, which could be restored on the overexpression of MAT1A (Fig. 3A). Levels of mitochondrial ROS (mROS) were elevated in Mat1a KO hepatocytes by 30% and were normalized to WT level after MAT1A overexpression (Fig. 3A). To rule out the possibility of spurious signals in the mROS experiments, we included either antimycin A, an inhibitor to the mitochondrial respiration complex III, or the superoxide scavenger mitoTEMPO as positive and negative controls, respectively (Supporting Fig. S3C-E). Using WT hepatocytes, overexpressing MAT1A increased the mitochondrial membrane potential (25%), whereas silencing caused the opposite effect (Fig. 3B; and second siRNA shown in Supporting Fig. S4A). mROS levels fell in WT hepatocytes on the overexpression of MAT1A (25%), and levels increased by 30% when MAT1A was silenced (Fig. 3B; and second siRNA shown in Supporting Fig. S4A). Silencing MAT1A in HepG2 cells had the same effect as in WT hepatocytes, lower membrane potential (20%) and higher mROS levels (35%) as compared with the scramble control (Fig. 3C; and second siRNA shown in Supporting Fig. S4B).
To examine whether Mat1a KO hepatocytes are sensitized to stress, mitochondrial membrane potential and mROS were measured after treatment with either tumor necrosis factor α (TNF-α) or ethanol. TNF-α had no significant effect on WT hepatocytes, but it caused a 17% decrease in membrane potential and a 40% increase in mROS levels in Mat1a KO hepatocytes (Supporting Fig. S4C). Interestingly, ethanol addition resulted in a 50% increase in membrane potential of WT hepatocytes, but it lowered the membrane potential of Mat1a KO hepatocytes by 22% (Supporting Fig. S4D). Ethanol induced mROS in WT hepatocytes by 50% but caused nearly a 2-fold increase in Mat1a KO hepatocytes (Supporting Fig. S4D).
To further study the effects of MATα1 on mitochondrial function, we performed respirometry experiments. The oxygen consumption rate was 30% lower in isolated liver mitochondria from Mat1a KO mice as compared with WT (Fig. 3D). Silencing of MAT1A in HepG2 cells significantly decreased basal respiration, adenosine triphosphate (ATP) production, the maximum respiratory capacity, and the reserve capacity (Fig 3E; and second siRNA shown in Supporting Fig. S4E).
MATα1 and CYP2E1 Interact With Each other Directly
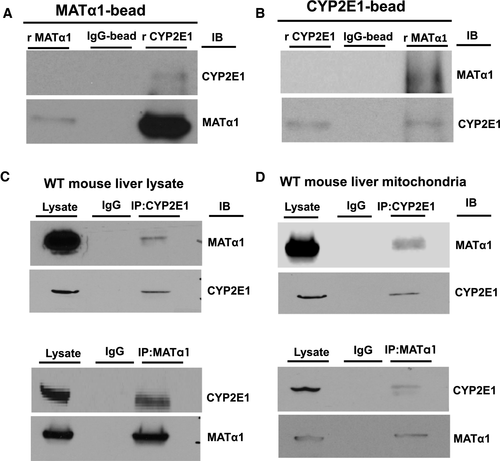
CYP2E1, a protein known to target to mitochondria and one that generates ROS, was identified by MS as a potential binding partner of MATα1 (Supporting Table S2). To confirm this interaction, we performed pull-down assays with purified recombinant proteins and a series of IP experiments. Direct interaction between CYP2E1 and MATα1 was demonstrated using recombinant proteins (Fig. 4A,B), whereas endogenous interaction was demonstrated by co-IP in both mouse liver lysates (Fig. 4C) and isolated mouse liver mitochondria (Fig. 4D).
MATα1 Negatively Regulates CYP2E1 Expression
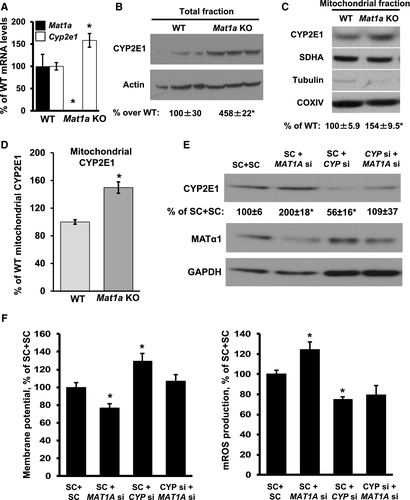
We next examined how MATα1 influences CYP2E1 expression and the functional outcome of their interaction. Levels of Cyp2e1 mRNA were increased by 50% in Mat1a KO mice livers compared with the WT control (Fig. 5A), whereas CYP2E1 protein levels in the Mat1a KO livers were 4.6-fold of the WT controls, suggesting that the predominant mechanism for increased CYP2E1 expression lies at the protein level (Fig. 5B). Isolated mitochondria from WT and Mat1a KO mice livers showed a 54% increase in mitochondrial CYP2E1 level in the Mat1a KO (Fig. 5C). This increase was also confirmed using MS (Fig. 5D). Because the dominant mechanism of MATα1-mediated suppression of CYP2E1 lies at the protein level, we investigated how this occurs and the functional consequences.
MAT1A Knockdown-Mediated Mitochondrial Dysfunction Is CYP2E1 Dependent
CYP2E1 is known to influence mitochondrial function,10 which prompted us to examine whether MAT1A-mediated changes in CYP2E1 expression could play an important role in mitochondrial function. Knockdown of MAT1A in WT mouse hepatocyte cells doubled CYP2E1 protein abundance; whereas knockdown of CYP2E1 did not change the level of MATα1 expression, it prevented MAT1A knockdown-mediated CYP2E1 induction (Fig. 5E; and second siRNA shown in Supporting Fig. S5A). Knockdown of MAT1A decreased mitochondrial membrane potential by 25%, whereas mROS levels increased by 25%. Knockdown of CYP2E1 resulted in a 30% increase in mitochondrial membrane potential and a 30% decrease in mROS. Combined knockdown of MAT1A and CYP2E1 caused no change in membrane potential, but the increase in mROS after MAT1A knockdown was blocked (Fig. 5F; and second siRNA shown in Supporting Fig. S5B).
CYP2E1 Is Methylated, and me-CYP2E1 Level Is Reduced in Mat1a KO Liver Mitochondria
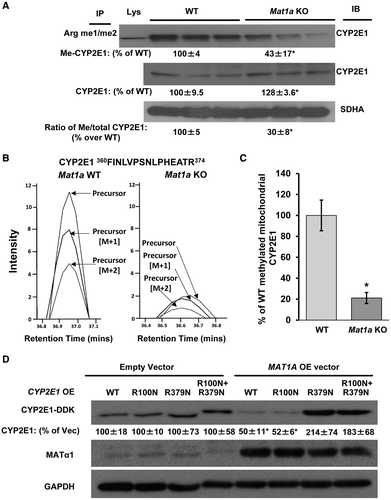
Interaction of MATα1 and CYP2E1 raised the possibility that CYP2E1 might be methylated and that this could regulate its protein stability. Co-IP using both WT and Mat1a KO mice liver mitochondria with anti-mono/dimethylarginine Ab followed by immunoblotting for CYP2E1 revealed CYP2E1 to be methylated, and methylated CYP2E1 (me-CYP2E1) levels were higher in the WT mitochondria compared with the Mat1a KO, whereas total CYP2E1 protein levels were higher in the Mat1a KO, resulting in a 70% decrease in me-CYP2E1/total CYP2E1 ratio (Fig. 6A). The decrease in methylated CYP2E1 in Mat1a KO mouse liver mitochondria was also confirmed using MS (Fig. 6B,C).
MATα1-Mediated Down-Regulation of CYP2E1 Protein Level Requires R379 Methylation
To identify the possible site of methylation on CYP2E1, methylation prediction servers were run using the human CYP2E1 protein sequence, which led to the identification of two arginine residues, R100 and R379 (Supporting Table S3). Mutation of these residues to asparagine, both single and double mutations, and overexpression in HepG2 cells showed that they were stably expressed to a level comparable to WT CYP2E1 (Fig. 6D). Interestingly, when MAT1A was also overexpressed, a clear reduction in WT and R100N CYP2E1 was observed (50%), but this reduction did not occur when R379N or the double mutant CYP2E1 was overexpressed, suggesting that R379 is critical for MATα1-dependent CYP2E1 degradation (Fig. 6D).
MATα1 Reduces the Half-Life of CYP2E1 and Aids its Degradation Through the Proteasomal Pathway
To examine the effect that methylation had on the stability of CYP2E1, CYP2E1 was overexpressed alone or with MAT1A before using cycloheximide (CHX) to stop de novo protein synthesis in HepG2 cells. Overexpression of MAT1A significantly reduced the biological half-life (t1/2) of coexpressed CYP2E1 by almost 40% (Fig. 7A,B). To see whether the effect of MAT1A overexpression is mediated by enhanced proteasomal degradation of CYP2E1, HepG2 cells were transfected with CYP2E1-DDK, with or without MAT1A overexpression vectors, and treated with the proteasomal inhibitor MG132. Figure 7C shows that MG132 completely abolished MAT1A overexpression-mediated down-regulation of CYP2E1 protein level. We further examined the effects of MG132 by performing a time course over 6 hours. CYP2E1 protein levels remained relatively stable over 6 hours, but on addition of MG132, CYP2E1 levels nearly doubled over the same time course (Supporting Fig. S6A). When MAT1A is co-overexpressed, there is a slight decrease in the levels of CYP2E1, which was blocked on MG132 treatment (Supporting Fig. S6B).
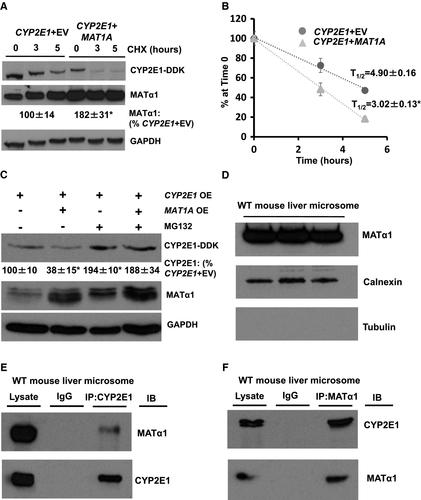
As MAT1A overexpression-mediated down-regulation of CYP2E1 protein level seemed to occur through the proteasomal degradation pathway, we examined whether MATα1 was also localized in the microsome. On isolation of microsomes from mouse liver, the presence of MATα1 could be seen through western blot, along with calnexin, a marker of the endoplasmic reticulum, and absence of tubulin, a marker of the cytosol, to show the purity of the isolation (Fig. 7D). Further IP studies revealed that MATα1 and CYP2E1 also interact in this subcellular compartment (Fig. 7E,F).
It has been reported that levels of CYP2E1 fall during hepatocyte dedifferentiation,25 so we compared CYP2E1 protein expression in WT and Mat1a KO hepatocytes cultured for 48 hours. Consistent with reports,25 levels of CYP2E1 fell in WT hepatocytes by 50% over 48 hours. CYP2E1 levels also fell in Mat1a KO hepatocytes, but by 48 hours, its level was much higher than that of WT hepatocytes (Supporting Fig. S6C).
Levels of CYP2E1 and me-CYP2E1 are Increased in Human ALD and A Mouse Model of Chronic and Binge Ethanol Feeding
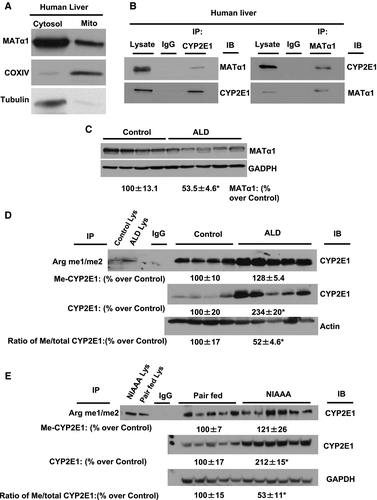
To extend our observations to pathophysiological state in humans, we determined the mitochondrial presence of MATα1 and its interaction with CYP2E1 and levels of MATα1 protein as well as methylated CYP2E1 levels in the liver tissues of subjects with ALD, a known liver condition with increased protein expression of CYP2E1. Normal human liver showed the presence of MATα1 within the mitochondria (Fig. 8A). The endogenous interaction of MATα1 and CYP2E1 was confirmed by performing co-IP (Fig. 8B). Consistent with lower MAT1A mRNA levels in ALD,2 MATα1 protein levels are reduced in ALD as compared with normal controls (Fig. 8C). CYP2E1 is methylated in human liver samples, and those from patients with ALD have higher total CYP2E1 level but a lower me-CYP2E1 to total CYP2E1 ratio as compared with normal controls (Fig. 8D), which was similar to what was observed in the Mat1a KO animal model (Fig. 6A). Furthermore, similar to human ALD, samples from the NIAAA mouse model, a model of chronic and binge ethanol feeding,21 showed that the me-CYP2E1 to total CYP2E1 ratio was lower as compared with pair-fed controls (Fig. 8E).
Discussion
Up until recently, the general understanding has been that MAT1A-encoded isoenzymes are cytosolic and provide SAM biosynthesis in normal liver. It is well accepted that MAT1A expression and SAM levels fall in chronic liver disease and HCC.1 Mice lacking Mat1a have higher total lipid peroxides in serum and altered mitochondrial membrane potential, are sensitized to CCl4-induced hepatotoxicity due to higher CYP2E1 expression, and spontaneously develop steatohepatitis and HCC.6, 7 Much of the phenotype of Mat1a KO mice was thought to be consequences of cytosolic SAM deficiency, although how SAM deficiency resulted in increased CYP2E1 expression was unclear. More recently, our study and others have shown that MATα1 can target the nuclear compartment where it can regulate gene expression by epigenetic mechanisms.26-28 In addition, we recently showed that MATα1 interacts directly with MAX and c-MYC and negatively regulates E-box-driven reporter activity.19 This prompted us to investigate the MATα1 interactome, which revealed the unexpected high number of mitochondrial proteins, including CYP2E1 (Supporting Table S2). In the course of these investigations, we unveiled two main findings. The first is that MATα1 is targeted to the mitochondria where it plays an important role in regulating mitochondrial function, and the second is that MATα1’s importance in mitochondrial function is related to its ability to negatively regulate CYP2E1 expression.
It has been known for a long time that Mat1a KO mice have lower mitochondrial membrane potential, which was thought to be due to reduced prohibitin 1 (PHB1) expression.8 PHB1 is an important mitochondrial chaperone protein whose stability is regulated by the SAM level.8 However, when we noticed that 40% of all the interacting proteins and 46% of the top MATα1 interacting proteins were mitochondrial, we examined more closely whether MATα1 could also target the mitochondria (Supporting Fig. S1; Supporting Table S2). Using a variety of tools, from co-IP to mitochondrial subfractionation and finally to immunogold EM, we demonstrated the unequivocal presence of MATα1 in the mitochondrial matrix (Fig. 1; Supporting Fig. S2). Previous investigations highlighted the importance of SAM within the mitochondria, which led to the identification of the SAM channel transporter, solute carrier family 25, member 26 (SLC25A26), that was believed to be the only mechanism to allow SAM entry into the mitochondrial matrix in cells.29 Members of the SLC25 family encode for mitochondrial carriers that are membrane-embedded proteins, which translocate solutes across the inner mitochondrial membrane.29, 30 The importance of SAM within the mitochondria can be seen in patients who have mutations resulting in nonfunctional SLC25A26 proteins. Three cases of SLC25A26 mutations have been reported where a lack of a functional channel caused lactic acidosis, cystic necrosis of the germinal matrix, and cardiopulmonary failure.31 Interestingly, there was no mention of any liver abnormality. Although hepatocytes also express this channel (data not shown), the presence of MATα1 in the mitochondrial matrix suggests that it can also provide a local source of SAM, which may be necessary because SAM has a half-life of only about 5 minutes32 and is competed for by hundreds of enzymes.33 The fact that liver is where 85% of all transmethylation reactions take place1 supports the notion that having MATα1 near important substrates in the mitochondria facilitates their regulation by methylation.
Targeting of MATα1 to the mitochondrial matrix essentially involves two stages: (1) targeting to and recognition by the mitochondria and (2) translocation through the outer and inner membrane by import machinery. MATα1 does not contain the classical amino-terminal cleavable presequence for mitochondrial targeting as determined by TargetP, Multiloc, and MitoFates, or an internal mitochondrial intermembrane space signal that would directly target it to the mitochondria.34 One well-established method of mitochondrial protein recruitment is through HSPs, which play a major role in trafficking proteins to and across the mitochondria membranes.24 From MS results, multiple HSPs were found to potentially interact with MATα1, including the constitutively expressed cytosolic chaperones, HSP70A8 and HSP90β, as well as several mitochondrial matrix HSPs, including HSP60, HSP70A9, and TRAP-1 (Supporting Table S2). Co-IP experiments using mouse liver lysate showed that MATα1 interacted with the cytosolic HSP proteins HSP70A8 and HSP90β, suggesting that they may facilitate successful transport of MATα1 to the mitochondria (Fig. 2A,B). Our finding that knockdown of HSPA8 reduced the amount of MATα1 in the mitochondria by 45% (Fig. 2C,D; Supporting Fig. S3A) is consistent with the notion that HSP70A8 plays an important role in MATα1 mitochondrial targeting. Interestingly, silencing of HSP90AB1 reduced the cytosolic and mitochondrial MATα1 fraction by around 40%, suggesting that this chaperone may play a role in the maturation of MATα1 rather than aiding its translocation to the mitochondria (Fig. 2E,F; Supporting Fig. S3B). Further studies are needed to elucidate the precise mechanism of entry into the mitochondrial matrix.
Mat1a KO mice livers are known to have lower mitochondrial membrane potential.8 To directly assess mitochondrial function, we used the mitochondrial Seahorse analyzer with both a cellular system and isolated mitochondria, examining whether MATα1 modulates mitochondrial respiration and energy production in the liver. For that, we isolated liver mitochondria from WT and Mat1a KO mice and measured real-time oxygen consumption as a readout of oxidative phosphorylation. In addition, to be able to determine key parameters of mitochondrial function, we silenced MAT1A in HepG2 cells. As expected, our studies show that MATα1 positively regulates mitochondrial function in the liver both in vitro and in vivo. Its absence significantly decreased adenosine diphosphate–stimulated respiration in isolated liver mitochondria (Fig. 3D) and basal respiration and ATP-linked respiration in HepG2 cells (Fig. 3E; Supporting Fig. S4E). The maximal respiratory capacity, which shows the maximum rate of respiration that the cell can achieve and mimics the physiological energy demand, as well as the reserve capacity, which is an estimate of the potential bioenergetic reserve the cell can call on in times of stress, were significantly reduced on MAT1A silencing. We also found that Mat1a KO hepatocytes were much more susceptible to the effects of TNF-α and ethanol on mitochondrial function. TNF-α had little effect on WT hepatocytes but raised mROS and lowered mitochondrial membrane potential in Mat1a KO hepatocytes (Supporting Fig. S4C). Similarly, ethanol raised mROS levels much more in KO hepatocytes. Intriguingly, ethanol treatment increased membrane potential in WT hepatocytes but lowered it in KO hepatocytes (Supporting Fig. S4C). Our results are consistent with a report that showed ethanol hyperpolarized mitochondrial membrane potential in mouse myocardial cells.35 Taken together, these results support a major role of MATα1 in mitochondrial function.
Among the MATα1 interacting proteins, we focused on CYP2E1 because our earlier study showed that Mat1a KO mice are sensitized to CCl4-induced liver injury and that this was due to increased CYP2E1 expression and activity.7 CYP2E1 is an important target because its induction is implicated in a variety of human diseases, including diabetes, ALD, and NAFLD.36 A marked increase in mitochondrial CYP2E1 content is associated with mitochondrial oxidative stress, suggesting a direct role of CYP2E1 in ROS production.17, 37 Our study found that MATα1 regulates CYP2E1 expression negatively by two different mechanisms. One is at the mRNA level, as Cyp2e1 mRNA level increased by 50% in Mat1a KO mice (Fig. 5A), and the second is at the protein level, as Mat1a KO mice had a 4.6-fold increase in CYP2E1 in total protein level (Fig. 5B). CYP2E1 induction in many instances (such as by alcohol) also occurs largely at the posttranslational level by regulating its proteasomal degradation.10 This prompted us to devote our efforts to elucidate how MATα1 regulates CYP2E1 at the protein level and examine the functional consequences.
We found that recombinant MATα1 and CYP2E1 can directly interact in vitro, and endogenous proteins interact in total, mitochondrial, and microsomal lysates (Fig. 4; Fig. 7E,F). Because we speculated that mitochondrial MATα1 may be providing a local source of SAM to methylate its targets, we next examined whether CYP2E1 might be methylated. Indeed, we found lower methylated CYP2E1 but higher total CYP2E1 in the KO mitochondria (Fig. 6A), suggesting that methylation of CYP2E1 may destabilize the protein. This was also true in human ALD, a disease in which MATα1 is decreased, CYP2E1 is increased, and total liver lysate showed a reduction in me-CYP2E1 (Fig. 8C,D). A similar decrease in me-CYP2E1 to total CYP2E1 ratio also occurred in the NIAAA mouse model (Fig. 8E). Methylation prediction servers highlighted several arginine residues as possible candidates but did not predict any lysine residues (Supporting Table S3). Analysis of the human CYP2E1 crystal structure (PDB:3T3Z) showed that R379 would be the most likely target of methylation as its side chain was surface accessible, unlike R100, whose side chain was involved in forming hydrogen bonds with the protoporphyrin IX moiety of CYP2E1 (Supporting Fig. S7A-C). Mutagenesis studies confirmed that R379 of CYP2E1 is the critical residue that is required for MATα1 overexpression to destabilize CYP2E1 (Fig. 6D). To the best of our knowledge, CYP2E1 has not been shown to be methylated. Although our current study is mainly focused on the mitochondria, it is highly likely that methylation of CYP2E1 is also occurring in the other cellular compartments such as the ER and may similarly affect its stability, as we also found MATα1 to be present in the microsomal fraction where it interacts with CYP2E1 (Fig. 7D,F).
We also examined the effect MATα1 had on the degradation of CYP2E1. Overexpression of MATα1 reduced the amount of CYP2E1 protein, but this effect was blocked on the addition of MG132, a proteasomal inhibitor (Fig. 7C), supporting our notion that methylation of CYP2E1 at R379 enhances CYP2E1 degradation through the proteasomal system. To this, on blocking of de novo protein synthesis by CHX, addition of MAT1A reduced the t1/2 of CYP2E1 from 5 to 3 hours (Fig. 7A,B), further providing evidence that methylation of CYP2E1 leads to its decreased protein stability. The rapid phase degradation of CYP2E1 has been reported to have a t1/2 between 3 and 6 hours in rat hepatoma cells38, 39 and between 2.5 and 6 hours in HepG2 cells expressing human CYP2E1,40 which is consistent with our findings. Although there are proteases within the mitochondria, there is no proteasomal system, so how mitochondrial methylated CYP2E1 could be degraded is not clear. One possible explanation is that on methylation, CYP2E1 is transported out of the mitochondria for degradation through the proteasomal degradation system. There is evidence of proteins being transported out of the mitochondria, as a recent report by Sutendra et al.41 described the accumulation of pyruvate dehydrogenase in the nucleus in the S-phase of the cell cycle where it participated in histone acetylation. It was devoid of presequences, suggesting that the proteins interacted with mitochondrial processing peptidase before nuclear translocation. Lavie et al.42 recently published that the inner mitochondrial matrix protein succinate dehydrogenase was found ubiquitinated within the mitochondrial but did not identify if this modification occurred before protein entry into the mitochondria. Although the mitochondrial matrix is not accessible to the cytosolic proteasome, the outer mitochondrial membrane is. Ubiquitination of key mitochondrial outer membrane proteins can alter mitochondrial dynamics through fusion (mitofusins) and fission of mitochondria.43 The ubiquitination proteasome-mediated degradation of the mitofusin proteins Mitofusin 1 and Mitofusin 2 in damaged mitochondria is necessary in order to prevent fusion with healthy mitochondria and favor fragmentation instead.43 Whether loss of MAT1A leads to a difference in the mitochondrial ubiquitination pattern is an intriguing topic for future investigation.
Because an increase in mitochondrial CYP2E1 can cause mitochondrial dysfunction,10 we examined what role increased CYP2E1 expression played in the MAT1A knockdown-mediated mitochondrial dysfunction. We found that MAT1A knockdown mediated fall in mitochondrial membrane potential and that increase in mROS required CYP2E1 induction (Fig. 5E,F), which support an important role for CYP2E1. However, we cannot exclude participation of other mitochondrial proteins that interact with MATα1, such as ATP synthase (Supporting Table S2). Future studies will examine whether these proteins are methylated and whether methylation alters their functionality.
In conclusion, our current study showed that MATα1 is targeted to the mitochondrial matrix in hepatocytes to provide an immediate source of SAM to important substrates that are regulated by methylation. MATα1 negatively regulates CYP2E1 expression mainly at the protein levels. Our data support that CYP2E1 methylation at R379 enhances its proteasomal degradation. These findings may help explain the consequences of MAT1A down-regulation that occur in many chronic human diseases, including ALD, where there is a decrease in MATα1 and me-CYP2E1 and an increase in total CYP2E1 levels.


