Hepatocellular Carcinoma-Associated Protein TD26 Interacts and Enhances Sterol Regulatory Element-Binding Protein 1 Activity to Promote Tumor Cell Proliferation and Growth
Supported by the National Natural Science Foundation of China (81670562 to X. Kong, 81670598 and 81472243 to Q. Xia, and 81372233 to H. Wu) and grant from the Shanghai Municipal Education Commission—Gaofeng Clinical Medicine Grant Support (20171911) to X. Kong, national science and technology major grant (2017ZX10203204-006-005) to X. Kong, and the National Key Joint Efforts Foundation on Precision Medicine (2017YFC908100) to Q. Xia.
Abstract
Hepatocellular carcinoma (HCC) is a leading cause of cancer-related death worldwide. Increased lipogenesis has been reported to play a critical role in HCC progression. However, the underlying mechanism contributing to lipogenesis increase in HCC remains elusive. Here, we show that HCC-associated protein TD26 (TD26) was highly expressed in HCC tumor tissues compared to matched normal tissues. From the clinicopathologic analyses of two independent HCC cohorts, we demonstrate that TD26 expression was positively correlated with tumor size and was an independent predictor of overall survival (OS) and recurrence-free survival (RFS) in HCC patients. Our metabolomics assays demonstrate that TD26 had no effect on glycometabolism, but significantly increased lipogenesis in HCC cells. In addition, our functional assays indicate that TD26 promoted HCC cell proliferation and tumor growth. We further demonstrate that TD26-mediated increase in lipogenesis and tumor cell proliferation was SREBP1 dependent. Mechanistically, we demonstrate that, through its C-terminus (amino acids [aa] from 121 to 198), TD26 interacted with the truncated nuclear sterol regulatory element-binding protein 1 (SREBP1) form (nSREBP1), but not full-length SREBP1 (flSREBP1), to block adenosine 5′-monophosphate (AMP)-activated protein kinase (AMPK)-mediated inhibition on SREBP1 activity, resulting in increased lipogenesis, elevated tumor cell proliferation, and enhanced tumor progression. Conclusion: We propose that TD26 is a positive regulator on SREBP1 transactivity, and the interaction between TD26 and SREBP1 can serve as a potential therapeutic target for HCC treatment.
Hepatocellular carcinoma (HCC) is the most common primary malignancy of liver cancer with a high global prevalence. Although HCC is the sixth-most common cancer, it ranks as the second-leading cause of cancer-related death worldwide attributed to its poor prognosis.1 After stage evaluation, only 20% patients with early-stage HCC are eligible for potentially curative treatment, including liver resection, transplantation, and local ablation, which commonly leads to promising 5-year survival rates up to 75%.2 However, most patients with advanced HCC are treated with palliative or symptomatic care with 10%-40% 3-year survival rate or less than 3-month survival, respectively.3 Sorafenib is a small inhibitor of several tyrosine protein kinases, including vascular endothelial growth factor receptor, platelet-derived growth factor receptor, and Raf. Although sorafenib has been recently approved by the U.S. Food and Drug Administration as the first-line treatment for advanced HCC and showed improved survival rates in those patients, the responsive rate to sorafenib remains low and the median overall survival (OS) is marginally extended by 2.8 months.4 These disappointing results suggest the existence of primary or acquired sorafenib resistance in HCCs. In fact, several oncogenic pathways, such as phosphatidylinositol 3-kinase/protein kinase B (AKT), Janus kinase/signal transducer and activator of transcription, and hypoxia, have been reported to be responsible for sorafenib resistance in HCCs.5-7 Therefore, identification of therapeutic targets is urgently required to develop drugs for second-line HCC treatment or combined treatment with sorafenib.
Recent accumulating evidence has linked aberrant lipogenesis to cancer, given that unconstrained lipogenesis is necessary to provide cancer cells enough lipid building blocks to support their uncontrolled proliferation.8-10 In human HCCs, increased lipid biosynthesis has been reported to promote HCC development11 whereas suppression of fatty acid synthase (FASN), a rate-limiting enzyme in lipogenesis, has been suggested to impair growth in human HCC cells.12 Moreover, a recent study has indicated that sterol regulatory element-binding protein 1 (SREBP1), a well-known transcriptional master regulator involved in lipogenesis, contributes to HCC progression by promoting cancer cell growth and metastasis.13 These findings strongly indicate that increased lipogenesis is an important driving force in supporting HCC progression. However, the molecular mechanism regarding increased lipogenesis in human HCC remains elusive.
HCC-associated protein TD26, also known as ANGPTL8 or betatrophin, was first identified as a gene highly expressed in HCC samples by suppression subtractive hybridization in 2004.14 TD26 locates on chromosome 19p13.2 and encodes a protein composed of 198 amino acids (aa).15 Sequence analysis of TD26 has disclosed an N-terminal signal peptide from aa 1 to 21 for TD26 secretion or transmembrane and a coiled-coil domain from aa 170 to 190.16 Functional studies indicated that TD26 may be largely involved in lipid metabolism as evidenced by the fact that TD26 overexpression increases plasma triglyceride (TG) levels,16, 17 and that TD26 is enriched in adipocytes and liver with a prolipogenic function.18 Interestingly, although TD26 was initially identified as an HCC-associated gene, whether TD26 plays a role in malignancy of HCC is not explored.
SREBPs, including SREBP1 and SREBP2, are a family of basic helix-loop-helix–leucine zipper (bHLH-Zip) domain and membrane-bound transcription factors dictating the expression of a number of genes involved in biosynthesis of lipid and cholesterol.19 Unlike other bHLH-Zip proteins, SREBPs are first synthesized as inactive and endoplasmic reticulum (ER)-bound precursors. After a two-step cleavage which is mediated by Site-1 protease (S1P) and Site-2 protease (S2P), these inactive precursors are processed into truncated and activated mature SREBPs, which in turn translocate to the nucleus, resulting in transactivation of downstream target genes.20 Previous studies have demonstrated that SREBP1 is responsible for the synthesis of cholesterol, fatty acids, and triglycerides whereas SREBP2 preferentially activates the synthesis of cholesterol by transactivating several key downstream lipogenesis enzymes including FASN, stearoyl-CoA desaturase-1 (SCD1), acetyl-CoA carboxylase-1 (ACC1), and ATP citrate lyase (ACLY).21, 22 Recent studies have demonstrated that SREBP1 is involved in cell proliferation in varieties of human cancers and is activated by the oncogenic AKT-mTORC1 (mammalian target of rapamycin complex 1) signaling pathway and inhibited by the tumor suppressor 5′-monophosphate (AMP)-activated protein kinase (AMPK).23-26 Meanwhile, SREBP1 has been reported to positively correlate with tumor size and tumor-node metastasis (TNM).27, 28 Thus, SREBP1-mediated lipogenesis may hold promise for treatment of malignant tumors.
In this study, we show that TD26 expression was up-regulated in HCC tissues compared to matched normal tissues. In addition, clinicopathological analyses from two independent HCC cohorts showed that TD26 positively correlates with tumor size and serves as an independent predictor for OS and recurrence-free survival (RFS) in HCC patients. Our functional studies further demonstrate that TD26 increased HCC lipogenesis and proliferation and indicate that TD26-mediated increased lipogenesis and cell proliferation is SREBP1 dependent. Mechanistically, we demonstrate that, through its C-terminus (aa from 121 to 198), TD26 can solely interact with the nuclear SREBP1 form (nSREBP1), but not full-length SREBP1 (flSREBP1), to block AMPK-mediated inhibition on SREBP1 activity, resulting in increased lipogenesis, elevated tumor cell proliferation, and enhanced tumor progression.
Patients and Methods
PATIENTS AND SAMPLES
Tumor tissues and matched normal tissues were collected from HCC patients who received curative surgery. A total of 56 pairs of primary HCC tumor tissues and matched normal tissues and 96 HCC tumor samples were collected from the Department of Liver Surgery, Renji Hospital, School of Medicine, Shanghai Jiaotong University (Shanghai, China). The 56 pairs of primary HCC tumor tissues and the matched normal tissues were used for real-time quantitative PCR (qPCR) and western blotting assays, and the 96 tumor samples were used for tissue microarray. In addition, a total of 163 HCC tumor samples gathered from Shanghai Eastern Hepatobiliary Surgery Hospital were used to generate a second HCC tissue microarray cohort. Patient samples were obtained following informed consent and protocols, which were approved by the ethical review committee of the World Health Organization Collaborating Center for Research in Human Production (authorized by Shanghai Municipal Government).
IMMUNOHISTOCHEMISTRY STAINING AND ANALYSIS
A total of 259 HCC tumor samples (96 from the Renji Hospital and 163 from Shanghai Eastern Hepatobiliary Surgery Hospital) were stained with the TD26 antibody (Sigma-Aldrich, MO). Statistics of TD26 scores were conducted according to the ratio and intensity of positive-staining areas. Staining areas were scored as follows: 0%-5%, score 0; 6%-35%, score 1; 36%-70%, score 2; and beyond 70%, score 3. Signal intensity was scored on a scale of 0-3: 0, negative; 1, weak; 2, moderate; and 3, strong. Two experienced pathologists scored the TD26 staining independently, and the final immunohistochemistry (IHC) score was the score average from both pathologists.
CELL LINES AND CELL CULTURE
HCC cell lines SMMC-7721, HepG2, Huh-7, SUN-449, SUN-387, MHCC-97L, MHCC-97H, Hep3B, and HEK 293T were purchased from Shanghai Institutes for Biological Sciences, Chinese Academy of Sciences. All cell lines were routinely cultured in Dulbecco's modified Eagle's medium supplemented with 10% fetal calf serum, 100 U/mL of penicillin, and 100 g/mL of streptomycin in a humidified cell incubator under an atmosphere of 5% CO2 at 37oC. Exponentially growing cells were used for subsequent experiments.
XENOGRAFT STUDIES IN NUDE MICE
Six-week-old male BALB/c (nu/nu) mice were bred at the laboratory animal facility, and each mouse was subcutaneously injected with a total of 1.0 × 10⁶ tumor cells. Tumor sizes were measured every 3 days. Mice were sacrificed to measure tumor burden. All procedures were performed in accord with the regulations and internal biosafety and bioethics guidelines of Renji Hospital, School of Medicine, Shanghai Jiao Tong University (Shanghai, China). Harvested tumors were then used for IHC and western blotting with antibodies against TD26 (Sigma-Aldrich), proliferating cell nuclear antigen (PCNA; Cell Signaling Technology, MA), and Ki67 (Abcam, MA).
qPCR
Total RNA was extracted using a TRIzol kit (Invitrogen), following the manufacturer's instructions, and reverse transcribed to complementary DNA (cDNA) with a cDNA Synthesis kit (Takara, Japan) according to the protocol. qRT-PCR was used to quantify mRNA levels with SYBR Green PCR Master Mix (Bio-Rad, CA). Primers were as follows: TD26 (F:5′-CTTAAAGGCTCACGCTGACAAG-3′;R:5′-TGGAGTCTCTCCTGGATCTGTC-3′); SREBP1 (F:5′-GCTGCTGACCGACATCGAA-3′;R:5′-CCAGCATAGGGTGGGTCAAA-3′); FASN (F:5′-TATGAAGCCATCGTGGACGG-3′;R:5′-CATGCTGTAGCCCACGAGT-3′); SCD1 (F:5′-CACTTGGGAGCCCTGTATGG-3′;R:5′-TGAGCTCCTGCTGTTATGCC-3′); ACC1 (F:5′-CTTGAGGGCTAGGTCTTTCTGG-3′;R:5′-CTGGTTCAGCTCCAGAGGTT-3′); ACLY (F:5′-CAGTCCCAAGTCCAAGATCCC-3′;R:5′-GTCTCGGGAGCAGACATAGT-3′); and β-actin (F:5′-TCACCCACACTGTGCCCATCTACGA-3′;R:5′-CAGCGGAACCGCTCATTGCCAATGG-3′).
MASS SPECTROMETRY
Mass spectrometry (MS) analyses were performed using a high-performance liquid chromatography system (1260 series; Agilent Technologies) and mass spectrometer (Agilent 6460; Agilent Technologies). A 10-cm dish of cultured tumor cells were collected, adding 1.5 mL of chloroform/methanol (2:1, v/v), vortex mixing 1 minute, 3,000-rpm centrifugation for 10 minutes, 800-uL organic phase adding into a clean tube, and dried with nitrogen. Sample preparation processes were performed in accord with the above method of parallel preparation of quality control samples. Mass spectrometric analysis was conducted by adding a 200-uL isopropanol/methanol solution (1:1, v:v), and the supernatant was used for analyzing. For targeted metabolomic analyses, multiple reaction monitoring transitions representing the metabolites were simultaneously monitored, and the positive/negative polarity switching was used. Data analyses were performed as instructions by Shanghai Applied Protein Technology.
TG AND CHOLESTEROL ASSAYS
Intracellular TG levels were measured using a TG assay kit (Nanjing Jiancheng Bioengineering Institute, China). Intracellular cholesterols (ChEs) were detected using a ChE assay kit (Nanjing Jiancheng Bioengineering Institute, China). All assays and data analyses were performed according to the manufacturer's protocol.
LUCIFERASE REPORTER ASSAYS
SREBP1 reporter vector and a Renilla luciferase plasmid at a ratio of 10:1 were cotransfected into HEK293T together with vector control, TD26 overexpression, negative control (NC), or TD26/short hairpin RNA. Twenty-four hours after transfection, cell lysates were analyzed using the dual-luciferase reporter assay kit (Promega, USA) according to the manufacturer's instructions. The ratio of firefly luciferase to Renilla activity was performed in triplicate, and three independent experiments were carried out.
CO-IMMUNOPRECIPITATION
Cells were harvested and lysed in immunoprecipitation (IP) lysis buffer (Thermo Fisher, Inc, MA), supplemented with protease inhibitor cocktail (Merck Millipore, Germany) at 4°C. Cell lysates were rotated for 30 minutes at 4°C and cleared by centrifuge at full speed. Extracts of proteins were then incubated with indicated antibodies for 24 hours at 4°C followed with 1-hour incubation with Protein A/G (Pierce, MA) at 4°C. After five-time wash (15 min/time) with IP lysis buffer, protein samples were collected by boiling in 2× SDS (sodium dodecyl sulfate) loading buffer and subjected to standard SDS/polyacrylamide gel electrophoresis and western blotting. Primary antibodies used in this study: anti-TD26 (BioLegend), anti-SREBP1 (Santa Cruz, TX), anti-AMPK (Santa Cruz, TX), anti-IgG (immunoglobulin G; Abcam), and anti-Flag (Cell Signal Technology, MA).
STATISTICAL ANALYSIS
Data are expressed as mean ± SEM. The Student t test and one-way analysis of variance were used to analyze the data, and the significance level was set at P < 0.05.
Results
TD26 IS UP-REGULATED IN HCC TISSUES AND IS A POOR PROGNOSTIC MARKER IN HCC
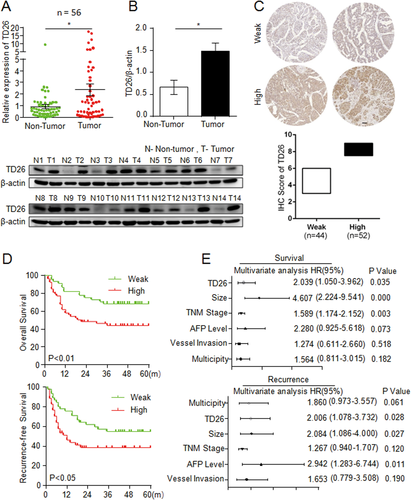
To determine the role of TD26 in HCC, we first measured the expression of TD26 in HCC tumor tissues and matched normal tissues by qRT-PCR and western blotting. qRT-PCR assays showed significantly higher TD26 expression in tumor tissues compared to matched normal tissues (Fig. 1A). Western blotting assays also showed greater TD26 expression in tumor tissues than that in matched normal tissues (Fig. 1B). This finding is consistent with a previous study showing higher TD26 transcript levels in HCC samples compared to normal tissues.14 In addition, three HCC data sets (GSE37988, GSE57958, and GSE63898) from the Gene Expression Omnibus (GEO) database were consulted to confirm TD26 up-regulation in HCC tissues (Supporting Fig. S1A). To evaluate the association between TD26 and the clinicopathological features of HCC, we determined TD26 expression in two independent HCC cohorts by IHC followed with independent visual scoring of two pathologists. We scored TD26 levels in HCC samples on a scale of 3-9, in which a score less than 6 was defined as weak expression and a score greater than 6 was marked as high expression (Fig. 1C and Supporting Fig. S1). Further analyses revealed that TD26 expression was significantly correlated with tumor size (Supporting Tables S1 and S3) and associated with poor OS and RFS (Fig. 1D and and Supporting Fig. S1C). More important, multivariate Cox regression analyses demonstrated TD26 as an independent predictor for both poor OS and tumor recurrence (Fig. 1E and Supporting Fig. S1D; Supporting Tables S2 and S4). Therefore, our findings indicate that TD26 expression is up-regulated in HCC and could serve as an independent predictor for OS and RFS in HCC patients.
TD26 PROMOTES HCC CELL PROLIFERATION IN VITRO
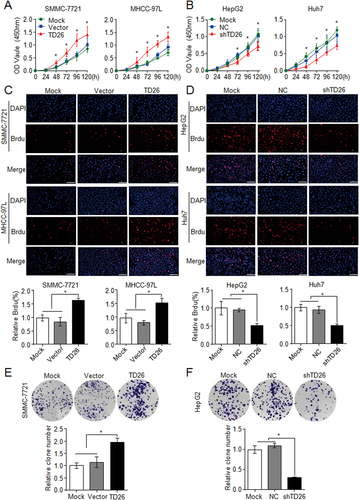
To perform an in vitro functional study of TD26 in HCC cells, we started to examine TD26 expression in eight HCC cell lines. qPCR and western blotting assays showed high TD26 expression in HepG2 and Huh7 and low TD26 levels in SMMC-7721 and MHCC-97L cells (Supporting Fig. S2A). Therefore, TD26 knockdown and overexpression was carried out in HepG2/Huh7 and SMMC-7721/MHCC-97L cells, respectively (Supporting Fig. S2B). Because our clinicopathological analyses indicated that TD26 levels positively correlate with tumor size (Supporting Tables S1 and S3), we started to examine whether TD26 affects HCC proliferation. Cell Counting Kit-8 (CCK8) assays indicated that TD26 overexpression or knockdown significantly promoted or inhibited cell growth in corresponding HCC cells, respectively (Fig. 2A,B). Bromodeoxyuridine (BrdU) incorporation assays showed that cell proliferation was increased in SMMC-7721/MHCC-97L cells with TD26 overexpression and was decreased in HepG2/Huh7 cells with TD26 knockdown (Fig. 2C,D). In addition, western blotting assays also showed that TD26 positively regulated PCNA levels in HCC cells (Supporting Fig. S2B). Furthermore, two-dimensional colony formation assays showed that TD26 overexpression or knockdown significantly enhanced or impaired colony formation ability in corresponding HCC cells, respectively (Fig. 2E,F and Supporting Fig. S2C). Such TD26-mediated tumor proliferation changes seem not related to apoptosis, because there were no alterations on apoptosis levels in HCC cells with either overexpression or knockdown of TD26 (Supporting Fig. S2D). Therefore, these in vitro findings indicate that TD26 promotes cell proliferation in HCC cells.
TD26 PROMOTES HCC TUMOR GROWTH IN VIVO
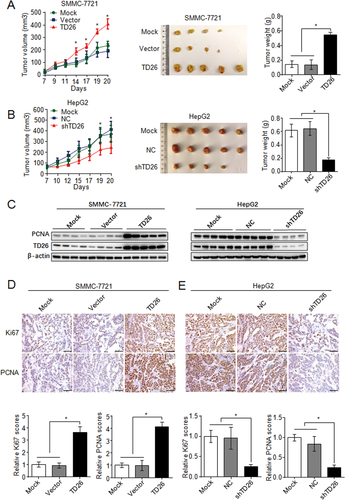
Because TD26 can positively regulate HCC cell proliferation, we then started to investigate whether TD26 can promote HCC tumor growth in vivo. A human tumor xenograft model was utilized by injecting HCC cells with either stable TD26 overexpression or knockdown into nude mice subcutaneously. Tumors derived from SMMC-7721 cells with TD26 overexpression grew faster than the mock or vector controls, whereas tumors generated from HepG2 cells with TD26 knockdown showed significant growth inhibition compared to their mock or NC counterparts (Fig. 3A,B). As a result, SMMC-7721 cells with TD26 overexpression exhibited greater tumor mass whereas HepG2 cells with TD26 knockdown displayed reduced tumor burden compared to their controls (Fig. 3A,B). In line with this TD26-induced tumor growth, western blotting assays showed increased PCNA levels in the SMMC-7721 xenografts with TD26 overexpression, but decreased PCNA levels in HepG2 xenografts with TD26 knockdown (Fig. 3C). Consistent with this western blotting result, IHC staining in tumor resections also showed higher PCNA and Ki67 levels in SMMC-7721 tumors overexpressing TD26 (Fig. 3D), but lower levels in HepG2 tumors knocking down TD26 (Fig. 3E). Taken together, these findings indicate that TD26 promotes HCC tumor growth probably by increasing tumor cell proliferation.
TD26 POSITIVELY CORRELATES WITH LIPOGENESIS IN HCC CELLS AND TISSUES
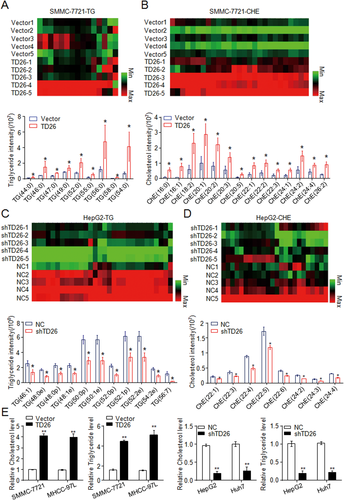
Given that a previous study has shown the involvement of TD26 in autophagy activation,29 we detected the autophagic flux in HCC cells with either TD26 knockdown or overexpression. Consistent with the previous study, TD26 overexpression or knockdown respectively increased or decreased the autophagic flux (Supporting Fig. S3A). However, although the treatment of chloroquine, an autophagy inhibitor,30 apparently blocked the autophagy flux, it had no effect on TD26-mediated HCC proliferation enhancement (Supporting Fig. S3B,C), suggesting that autophagy is not related to TD26-mediated tumor cell proliferation. Because abnormal glucose and lipid metabolism have been suggested to be involved in HCC development,11, 31, 32 we started to examine whether TD26 can affect glucose or lipid metabolism in HCC cells. Consistent with previous findings showing that TD26 has no effect on glucose metabolism,17 our MS assays also demonstrated that neither TD26 overexpression nor knockdown changes the glucometabolic profiles in HCC cells (Supporting Fig. S4A). In contrast, TD26 was significantly and positively correlated with lipogenesis because SMMC-7721 cells with TD26 overexpression showed increased cellular levels of TG (Fig. 4A), ChE (Fig. 4B), lysophosphatidylcholine (LPC; Supporting Fig. S4B), and phosphatidylcholine (PC; Supporting Fig. S4C), whereas HepG2 cells with TD26 knockdown showed decreased cellular levels of these lipid metabolites (Fig. 4C,D and Supporting Fig. S4D,E). In addition, ChE and TG colorimetric assays further confirmed such a positive correlation of TD26 with lipogenesis in HCC cells (Fig. 4E). To further examine whether TD26 is associated with lipogenesis in HCC tissues, we detected severity of steatosis by Oil Red assay and TD26 levels by IHC in HCC sections and found the positive correlation between TD26 and lipid contents in HCCs (Supporting Fig. S5A). Meanwhile, enzyme-linked immunosorbent assay (ELISA) of TG and ChE and western blotting assays of TD26 also showed that TD26 positively correlates with levels of TG and ChE in HCCs (Supporting Fig. S5B). Therefore, those findings indicate that TD26 is positively associated with lipogenesis and ChE biosynthesis in HCCs both in vitro and in vivo.
TD26 ENHANCES SREBP1 TRANSACTIVITY BY INCREASING THE NUCLEAR FORM OF SREBP1
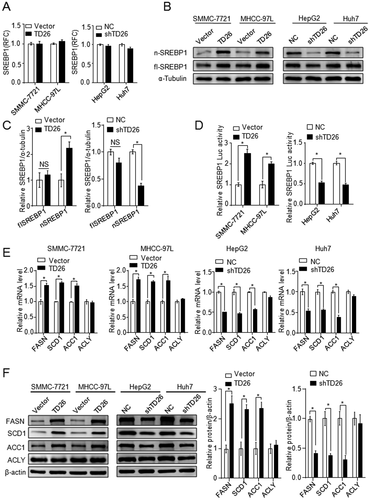
Given that TD26 is positively associated with both lipogenesis and ChE biosynthesis and that SREBP1 is mainly responsible for biosynthesis of ChE, fatty acids (FAs), and TGs,21 we started to assess whether TD26 affects SREBP1 expression and transactivity. Although qPCR assays showed there was no alteration on SREBP1 mRNA levels in HCC cells with either TD26 overexpression or knockdown (Fig. 5A), western blotting assays demonstrated that TD26 overexpression or knockdown respectively increased or decreased the levels of nSREBP1, but did not affect the levels of flSREBP1 (Fig. 5B,C). Consistent with TD26-mediated nSREBP1 level changes, SREBP1 luciferase assays also demonstrated that TD26 overexpression and knockdown respectively increases and impairs the transactivity of SREBP1 (Fig. 5D). In response to this SREBP1 transactivity change, expression of its downstream target genes, including FASN, SCD1, and ACC1, was increased upon TD26 overexpression and decreased when TD26 was being knocked down (Fig. 5E,F). Together, these findings indicate that TD26 augments nSREBP1 levels and SREBP1 transactivity in HCC cells.
SREBP1 INHIBITION IMPAIRS TD26-INDUCED HCC CELL PROLIFERATION
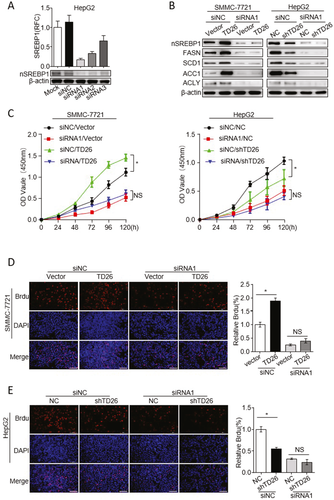
Because TD26 can enhance SREBP1 transactivity, we next sought to answer whether SREBP1 transactivity is required for TD26-induced HCC cell proliferation. We used both SREBP1 small interfering RNAs (siRNAs) and inhibitors to achieve SREBP1 inhibition. SREBP1 siRNAs significantly inhibited the expression of SREBP1 and its downstream target genes, FASN, SCD1, ACC, and ACLY (Fig. 6A,B). CCK8 assays showed that TD26-related HCC cell growth enhancement was abolished after treatment of SREBP1 siRNAs (Fig. 6C,D). Meanwhile, BrdU incorporation assays further demonstrated that inhibition of SREBP1 significantly impaired TD26-mediated HCC cell proliferation (Fig. 6E,F). In addition, treatments of SREBP1 inhibitors Betulin and Fatostain33-35 in HCC cells achieved similar results (Supporting Fig. S6). Taken together, these findings indicate that transactivity of SREBP1 is required for TD26-mediated proliferation increase in HCC cells.
TD26 INTERACTS WITH nSREBP1 TO BLOCK AMPK-MEDIATED INHIBITION ON SREBP1
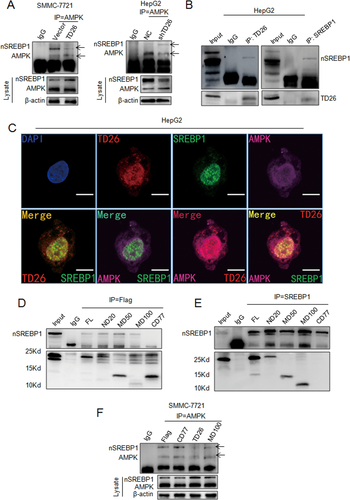
A previous study indicates that AMPK can interact with SREBP1 to inhibit its processing and nuclear translocation.26 We then sought to examine whether TD26 can affect the interaction between AMPK and SREBP1. Overexpression of TD26 in SMMC-7721 cells apparently attenuated the interaction between AMPK and nSREBP1 whereas TD26 knockdown in HepG2 cells markedly increased this interaction (Fig. 7A). To examine the possibility that TD26 may compete with AMPK to interact with nSREBP1, we performed co-immunoprecipitation (Co-IP) assays by using antibodies against endogenous TD26 and SREBP1 in HepG2 cells. IP of endogenous TD26 detected the presence of nSREBP1 in the complex with TD26, and the reciprocal Co-IP also confirmed the interaction between TD26 and nSREBP1 (Fig. 7B). Interestingly, we did not detect interaction between TD26 and flSREBP1 (data not shown). Meanwhile, immunofluorescent (IF) staining confirmed the colocalization of endogenous TD26 (red), SREBP1 (green), and AMPK (purple) in HCC cells (Fig. 7C and Supporting Fig. S7). Moreover, IF staining in SMMC7721 cells TD26 overexpression also showed enhanced nuclear translocation of SREBP1 (Supporting Fig. S7). Because some recent studies have shown that glucose/insulin or metformin can respectively induce or inhibit TD26 expression,36, 37 we then examined the interactions between TD26, AMPK, and SREBP1 in the context of insulin, metformin, and different concentrations of glucose. Glucose and insulin treatment apparently increased TD26 levels and enhanced the interaction between SREBP1 and TD26, but impaired the interaction between SREBP1 and AMPK, whereas metformin treatment decreased TD26 levels, greatly enhanced SREBP1-AMPK interaction, and mitigated SREBP1-TD26 interaction (Supporting Fig. S8). This finding suggests that the interactions between TD26, AMPK, and SREBP1 are subjected to metabolic regulation at multiple levels. To characterize the functional region(s) of TD26 contributing to interacting with nSREBP1, we constructed a series of Flag-tagged expression vectors encoding truncated TD26 and cotransfected them with the nSREBP1 expression vector into 293T cells (Supporting Fig. S9A). FL, ND, CD, and MD respectively stand for full-length, N-terminal, C-terminal, and middle-domain deletion (Supporting Fig. S9A). Ectopic expression of those truncated TD26 fragments was detected by immunoblotting (Supporting Fig. S9B). IP indicated that TD26-CD77 was not able to interact with nSREBP1, suggesting that the TD26 region from the residue of 121 to 198 is essential for the interaction between TD26 and nSREBP1 (Fig. 7D,E). To examine whether the interaction between TD26 and nSREBP1 competes with the interaction of AMPK with nSREBP1, we transfected TD26 full-length, TD26-MD100, and TD26-CD77 into SMMC-7721 cells and detected the interaction changes between AMPK and nSREBP1. Like full-length TD26, TD26-MD100, a truncated TD26 fragment containing the region from 121 to 198, can inhibit the interactions between AMPK and nSREBP1, whereas TD26-CD77 failed to do so (Fig. 7F). Taken together, these findings indicate that, by interacting with SREBP1, TD26 blocks the interaction between AMPK and nSREBP1.
TD26 INTERACTING WITH nSREBP1 IS ESSENTIAL FOR TD26-MEDIATED TUMOR PROGRESSION IN HCC CELLS
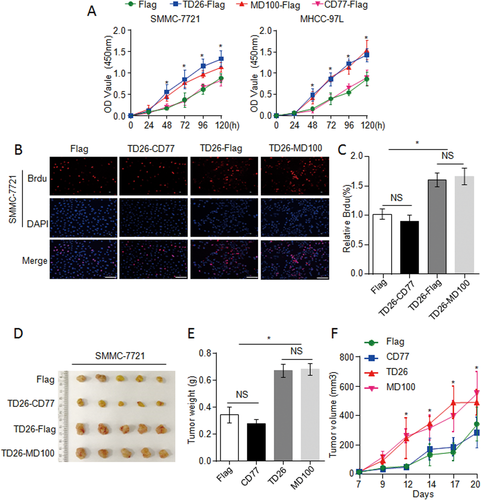
To assess whether the interaction between TD26 and nSREBP1 is required for TD26-induced tumor proliferation, SMMC-7721 and MHCC-97L cells were infected with lentiviral vectors encoding flag control, TD26 full-length, TD26-MD100, or TD26-CD77 respectively. CCK8 assays demonstrated that TD26-MD100, but not TD26-CD77, enhanced cell proliferation (Fig. 8A). In line with CCK8 results, BrdU incorporation assays demonstrated increased cell proliferation in cells with TD26 or TD26-MD100 overexpression, but not with TD26-CD77 overexpression (Fig. 8B,C and Supporting Fig. S10A,B). Moreover, the xenograft mouse models showed that only TD26 full-length or TD26-MD100 enhanced tumor growth whereas TD26-CD77 could not (Fig. 8D-F). Therefore, these findings indicate that the interaction between TD26 and nSREBP1 is required for TD26-induced tumor proliferation in HCC cells.
Discussion
In the present study, we demonstrate that TD26 is highly expressed in HCC tumor tissues. From the clinicopathological analyses of two independent HCC cohorts, we demonstrate that TD26 is positively correlated with tumor size and is an independent predictor for OS and RFS in HCC patients. We further demonstrate that TD26 increases HCC cell proliferation and tumor growth by enhancing SREBP1-dependent lipogenesis. Mechanistically, we demonstrate that, through its C-terminal region (aa from 121 to 198), TD26 can compete with AMPK to interact with nSREBP1, but not flSREBP1, resulting in increased SREBP1 transactivity, lipogenesis, and tumor progression in HCC (Supporting Fig. S12).
TD26 is a well-known secretory protein produced by liver and adipose tissues, but some recent studies have also demonstrated an intracellular function of TD26.38 For example, Zhang et al. have recently demonstrated that TD26 can negatively regulate nuclear factor kappa B intracellularly, and TD26 self-oligomerization is essential for this negative regulation. Interestingly, the N-terminal signal peptide (secretory signal peptide) of TD26 is not required for such self-oligomerization.38 To further characterize the subcellular localization of TD26 in HCC in vivo, we examined our TD26 IHC results in HCC samples. Although we observed strong TD26 signals surrounding the tumor cells which may come from secretory TD26 or membrane-bound TD26, we also detected abundant intracellular TD26 signals (Supporting Fig. S11A). Those intracellular TD26 signals are either surrounding the nuclei or in the nuclei (Supporting Fig. S11A). In addition, we overexpressed C-terminal flag-tagged TD26 full-length (FL) and TD26 N-terminal deletion (ND; without secretory signal peptide) in HCC cell lines. Western blotting and ELISA assays showed that the secretory signal peptide is not required for TD26 expression, but is essential for secretion of TD26 (Supporting Fig. S11B-D). Moreover, IF staining clearly showed the intracellular abundance of endogenous TD26 in HCC cells (Fig. 7C and Supporting Fig. S7). These findings indicate that TD26 can function intracellularly independent of its secretory feature.
Although TD26 has been initially detected to be highly expressed in HCC tissues since 2004,14 the functional studies on TD26 are mainly focused on diabetes and obesity because of its physiological role in glucose homeostasis and lipid metabolism.39 Several studies have reported increased TD26 levels in obesity and/or diabetes patients.40, 41 In addition, a recent study indicates increased TD26 levels in patients with cirrhosis.42 Given that diabetes, obesity, and cirrhosis are risk factors for HCC, it is conceivable that TD26 may play a role in HCC development. The present study demonstrates that TD26 is an independent predictor for OS and RFS in HCC patients and contributes to HCC development by promoting cell proliferation and tumor growth. These findings suggest TD26 as a prognostic and therapeutic target for HCC treatment.
In recent years, high-throughput sequencing has identified thousands of putative oncogenic point mutations, translocations, amplifications, and deletions,43, 44 which make cancers extremely heterogeneous and difficult to treat by only targeting single or a few oncogenic alterations. It is becoming clear that certain metabolic alterations, such as increased glycolysis or lipogenesis, are essential for malignant cancers. Those cancer-associated metabolism alterations may serve as simple and effective therapeutic targets for cancer treatment.46 When oncogenic activations of hypoxia-inducible factor 1 alpha, MYC, RAS, and mutant p53 have linked to higher glycolysis in cancer development,46 the mechanisms related to increase in cancer-associated lipogenesis are poorly understood. In this study, we demonstrate that TD26 is a causal factor of the increased lipogenesis in HCC and that increased lipogenesis is required for TD26-mediated tumor progression.
SREBP1 is a master transcriptional factor responsible for the induction of genes involved in biosynthesis of ChE, FA, and TG. Previous studies indicate that SREBP1 depletion blocks cell-size increase in immortalized human epithelial cells and RNA interference of the fly SREBP1 homolog (HLH160/dSREBP) resulted in a reduction in cell and organ size, strongly suggesting that SREBP1-mediated lipogenesis may relate to cell growth.25 SREBP1 activation has been observed in human glioblastoma multiforme with active mutations of epidermal growth factor receptor. More important, blockage of lipid synthesis inhibited xenograft growth of those glioblastoma.47 These findings strongly suggest that SREBP1 is a promising therapeutic target of cancer. Some recent studies demonstrate that the AKT-mTORC1 signaling pathway activates transactivity of SREBP1 whereas AMPK represses it.25, 26 In the present study, we demonstrate that TD26 is a positive regulator of SREBP1 in HCC by interacting with SREBP1 to compete with AMPK-mediated inhibition on SREBP1.
nSREBP1 is a partial proteolytic product of flSREBP1 and shares the common aa sequence with the N-terminal half of flSREBP1, but we demonstrate that TD26 solely interacts with nSREBP1 but not flSREBP1. Given that flSREBP1 is mainly locked at the ER membrane and nSREBP1 is located in the Golgi and nuclei,48 we assume that the interaction between TD26 and nSREBP1 may not occur at the ER.
It has been reported that TD26 may also be subjected to a partial degradation to generate a short fragment carrying aa from C-terminal 139 to 198.49 A previous study has demonstrated that this C-terminal short form and full-length of TD26 are both increased in obese people and only the full-length TD26, but not the C-terminal short form, is positively associated with elevated fasting blood glucose.41 Interestingly, in the present study, we show that the C-terminus of TD26 (from aa 121-198) is essential for TD26 interacting with SREBP1. These findings suggest that the endogenous C-terminal short form of TD26 may play a major role in modulating TD26-mediated increase of lipogenesis and cell proliferation in HCC.
Potential conflict of interest
Nothing to report.
REFERENCES
Author names in bold designate shared co-first authorship.
Abbreviations
-
- aa
-
- amino acids
-
- ACC1
-
- acetyl-CoA carboxylase 1
-
- ACLY
-
- ATP citrate lyase
-
- AMPK
-
- adenosine 5′-monophosphate (AMP)-activated protein kinase
-
- BrdU
-
- bromodeoxyuridine
-
- CCK8
-
- Cell Counting Kit-8
-
- ChE
-
- cholesterol
-
- ER
-
- endoplasmic reticulum
-
- FASN
-
- fatty acid synthase
-
- flSREBP1
-
- full-length SREBP1
-
- HCC
-
- hepatocellular carcinoma
-
- IF
-
- immunofluorescent
-
- IgG
-
- immunoglobulin G
-
- IHC
-
- immunohistochemistry
-
- IP
-
- immunoprecipitation
-
- LPC
-
- lysophosphatidylcholine
-
- NC
-
- negative control
-
- nSREBP1
-
- nuclear sterol regulatory element-binding protein 1
-
- OS
-
- overall survival
-
- PC
-
- phosphatidylcholine
-
- PCNA
-
- proliferating cell nuclear antigen
-
- RFS
-
- recurrence-free survival
-
- SCD1
-
- stearoyl-coenzyme A desaturase 1
-
- siRNAs
-
- small interfering RNAs
-
- SREBP1
-
- sterol regulatory element-binding protein 1
-
- TG
-
- triglyceride
-
- TNM stage
-
- tumor nodule and metastasis stage


